YouTube Video Review version:
Intro
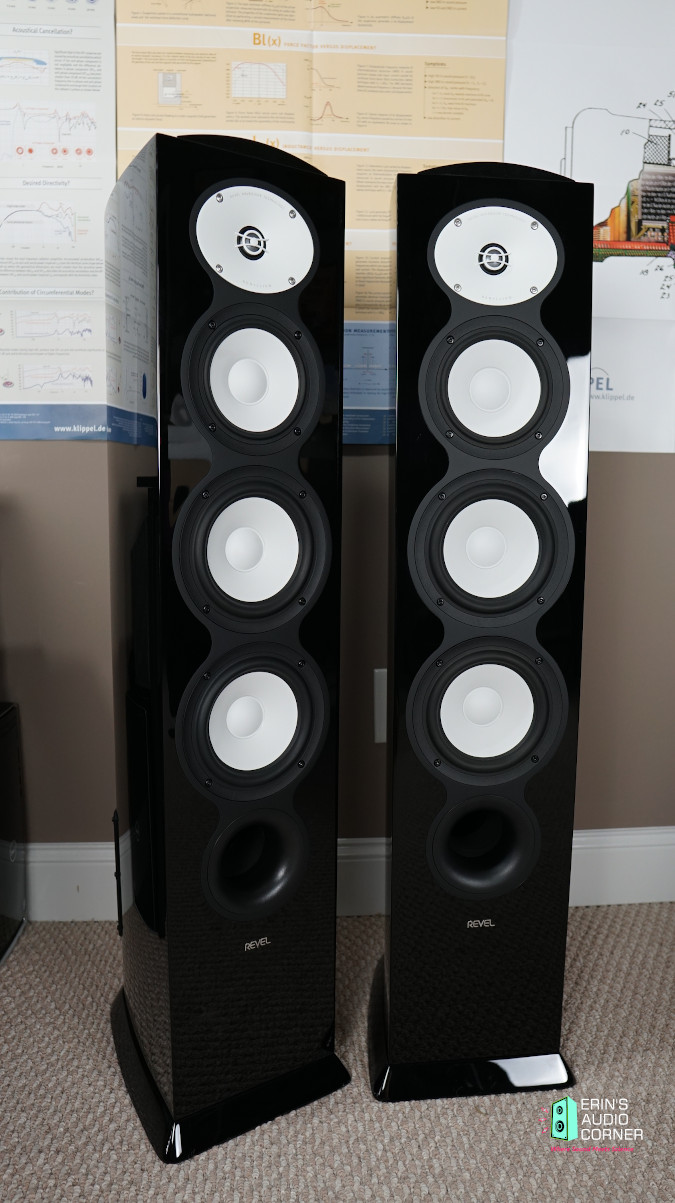
The Revel Performa F226Be is a “compact” floorstanding 3-way loudspeaker from Revel’s PerformaBe lineup featuring (2) 6.5-inch midwoofers, a single 5.25-inch midrange and a 1-inch Beryllium dome tweeter on a waveguide. This speaker retails for $3500 USD/each ($7k USD/pair).
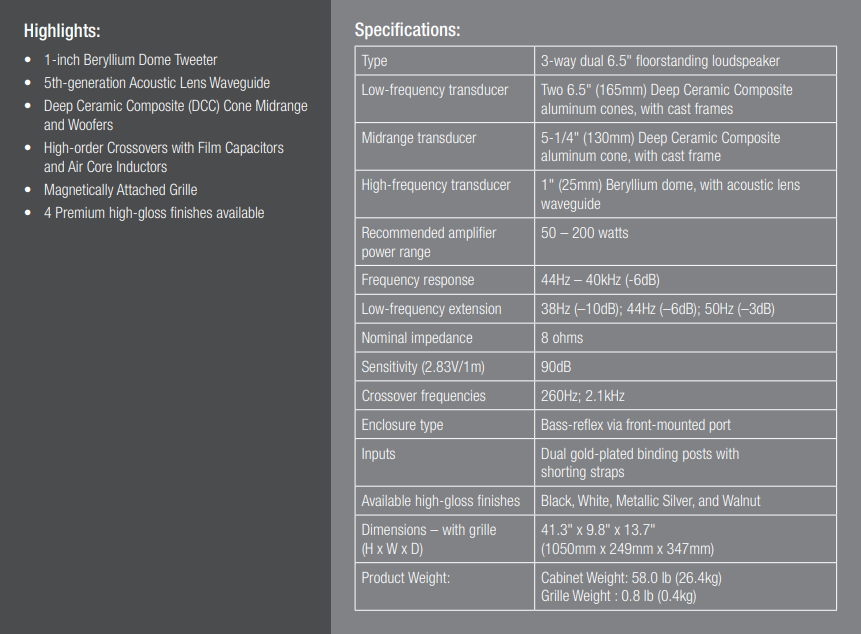
I have taken the liberty of copy/pasting specifications directly from Revel’s website below:
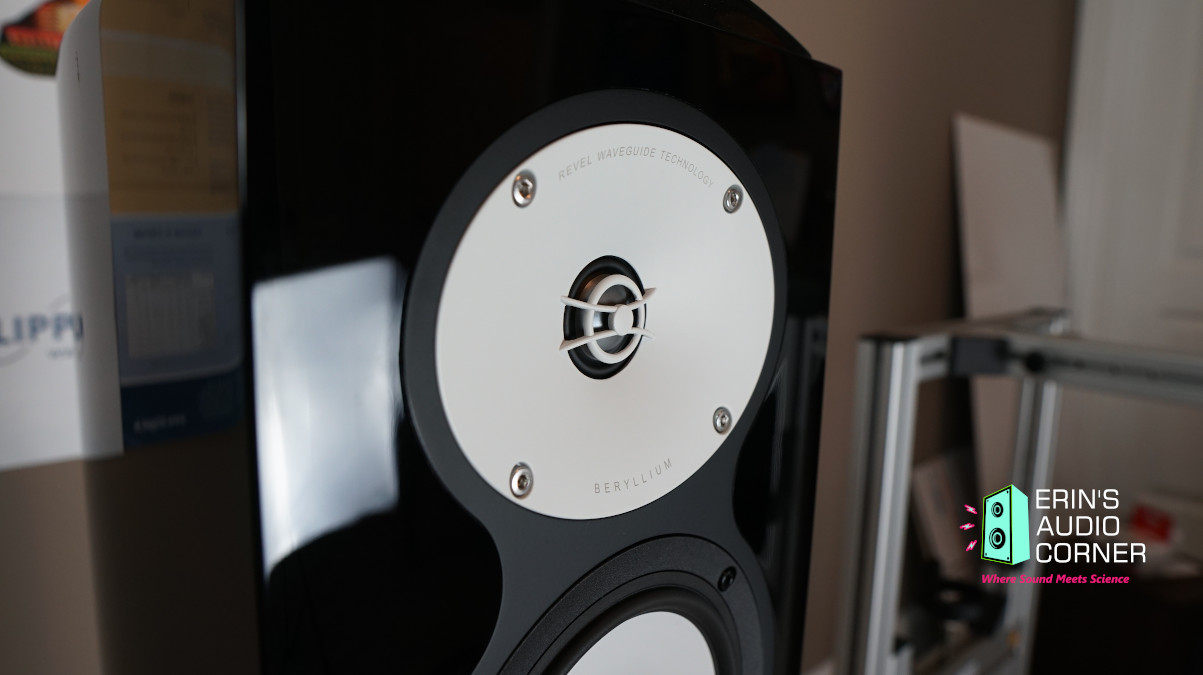
The 1-inch Beryllium dome tweeter features an acoustic lens to help control dispersion while also serving to protect the tweeter from damage (this tweeter being made of Beryllium, a needed feature). The relatively shallow waveguide provides directivity control designed to match the response of the midrange at the crossover to create a smooth “hand off” between drivers both horizontally and vertically.
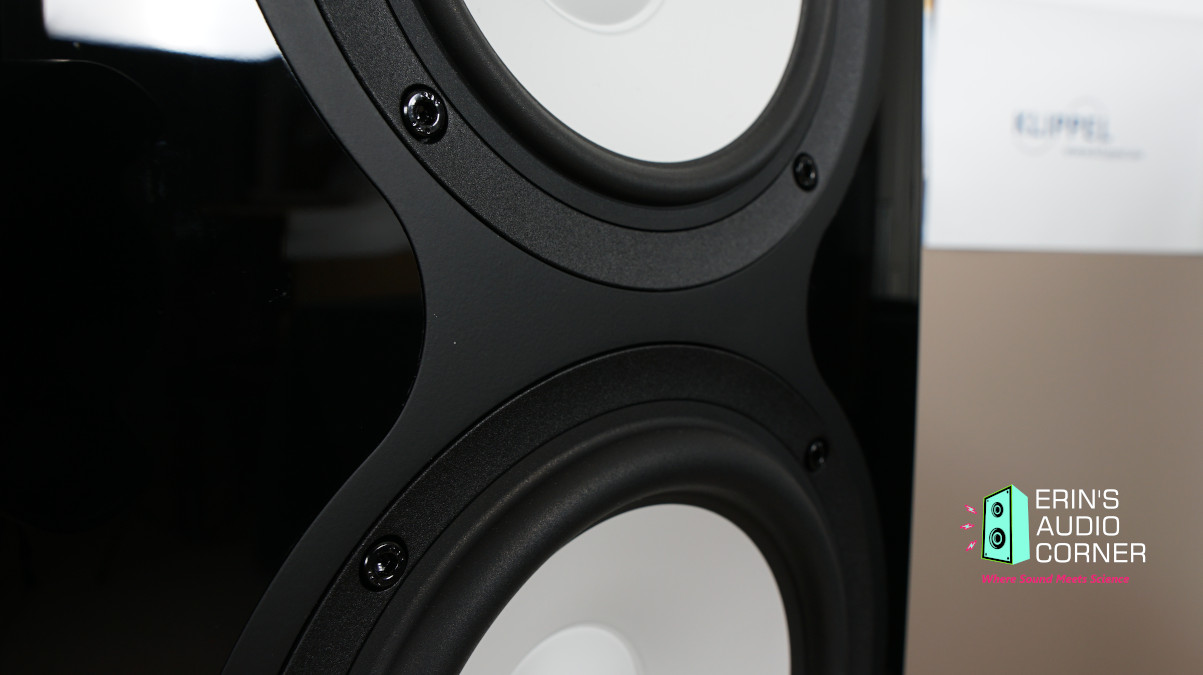
The 5.25-inch midrange features a different surround than that of the midwoofers. I find this interesting because many manufacturers make essentially the same drive units in various sizes for different implementations. While the T/S specs often reflect the intended use (such as a higher or lower Fs), the look of the drive units is often identical; just scaled in size. This midrange drive unit, however, features a distinctly different surround than that of the midwoofers. While I thought this was to reduce diffraction I hadn’t considered the obvious reason which HARMAN told me was the basis: The reason is not for directivity or diffraction. Rather, a smaller surround radius with a correspondingly larger diameter diaphragm reduces moving mass, plus larger cone area equals higher efficiency, which reduces compression. So, senstivity. Makes sense.
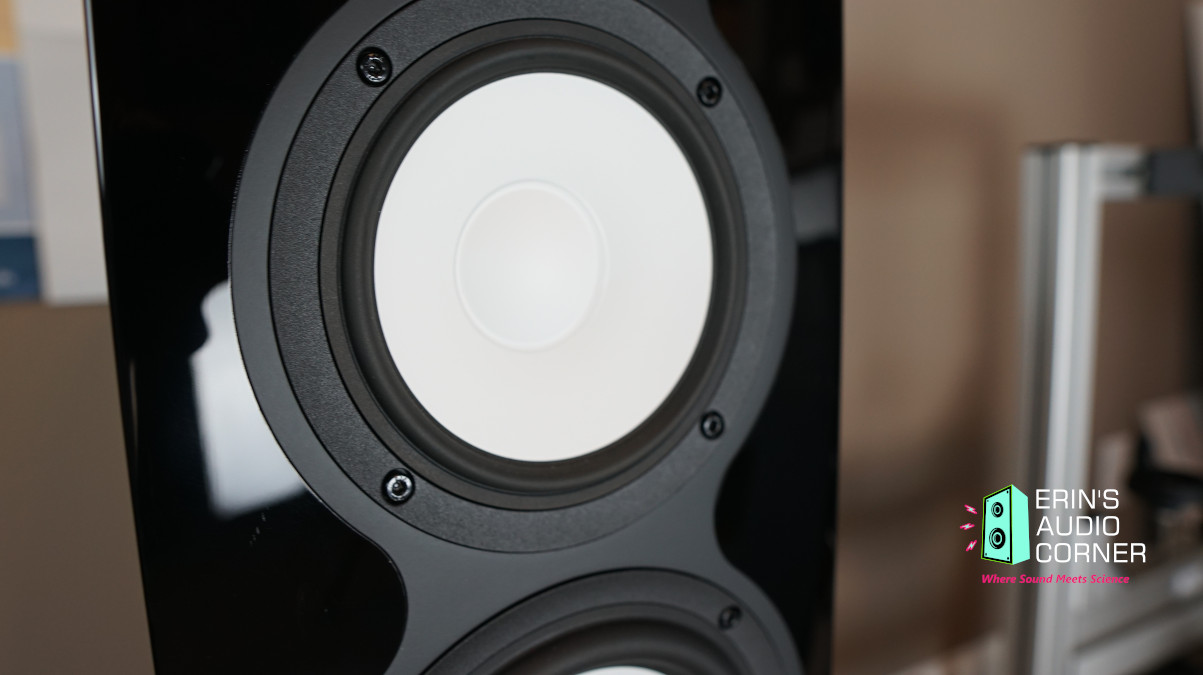
5.25-inch midrange on top. 6.5-inch midwoofer on bottom. Again, notice the different surrounds.
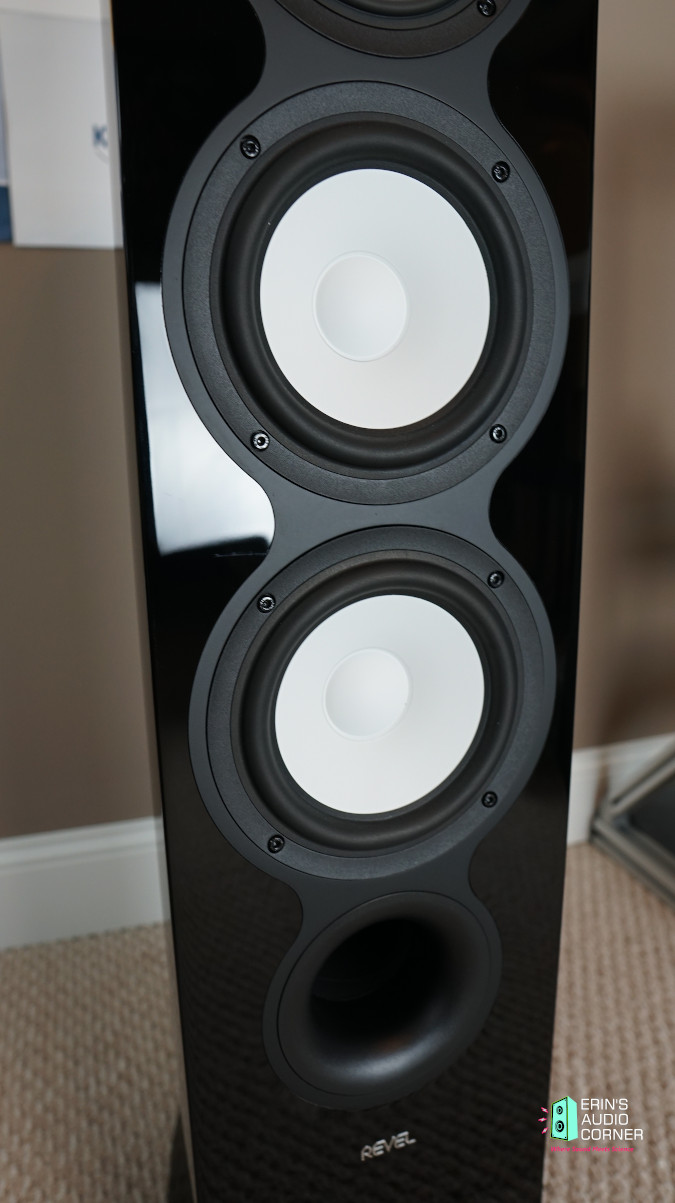
Dual 6.5-inch midwoofers and front-mounted port.
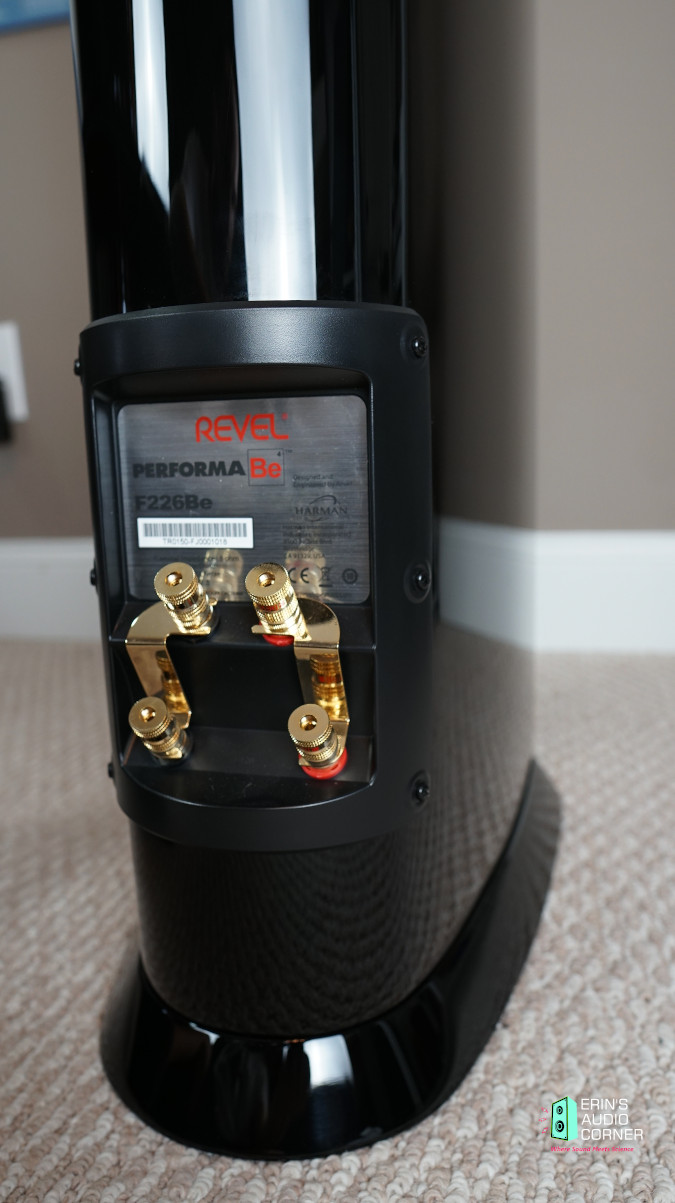
Rear speaker connections, implementing 5-way binding posts with the option to bi-amp or bi-wire the speakers if so desired.
Objective Data
Unless otherwise noted, all the data below was captured using Klippel Distortion Analyzer 2 and Klippel modules (TRF, DIS, LPM, ISC to name a few). Most of the data was exported to a text file and then graphed using my own MATLAB scripts in order to present the data in a specific way I prefer. However, some is given using Klippel’s graphing.
Foreword: Subjective Analysis vs Objective Data (click for more)
If you have seen my past reviews, you know that I am of the mindset that objective data is at least as important as someone's subjective evaluation of a speaker. If not more. Why? Because every room is different. Every listener is different. Some know what to listen for. Others know what they want to hear based on their own preference (i.e., some prefer extended bass, some prefer more midbass punch between 120-150Hz, some prefer a response with a dip around 4kHz, etc., etc.). What one person wants or expects may be opposite of another. Additionally, the room will impact the performance and therefore what the listener hears. This means when you read another's subjective-only review you are left to resolve those variables on your own. That's not likely to happen. Unless there is objective data you can use to get an idea of the performance. With objective data you can begin to understand why the subjective review turned out the way it did. Notably, objective data keeps reviewers honest. It's hard for a reviewer to legitimately bash one product but elevate another when the two measure practically the same in every regard. Not to say two similarly measuring speakers cannot subjectively sound different. Though, odds are if they do measure the same then a huge subjective difference is most likely attributed to other issues such as setup conditions, bias, etc. Objective data is the key to accountability. Simply put: if the measurements are taken with care and you understand them, you can rely on data to help paint a more accurate description of performance than a few adjectives from your favorite reviewer (myself included). As you will see, objective measurements can provide a lot of insight in to how the speaker will perform in your room.However, when possible, it is always best to demo speakers in your own room. Not simply because of subjective performance. But because of other factors such as aesthetics, pride of ownership, etc. In my experience, all these factors play in to how the listener “connects” with the system. A good shop or manufacturer understands this and allows buyers to try items out at home before purchasing or they offer a reasonable return policy. If you question the performance and can demo the speakers in your own home, I suggest you take advantage of the opportunity.
For all the reasons listed above: What I provide here is objective-heavy analysis. I still provide my own subjective experience but with in-room measurements at my listening position(s) so we can understand why I heard what I heard. Is it the room, the actual speaker itself, my brain, or a combination?
Now that you understand my motives, let’s get started with the review.
Impedance Phase and Magnitude:
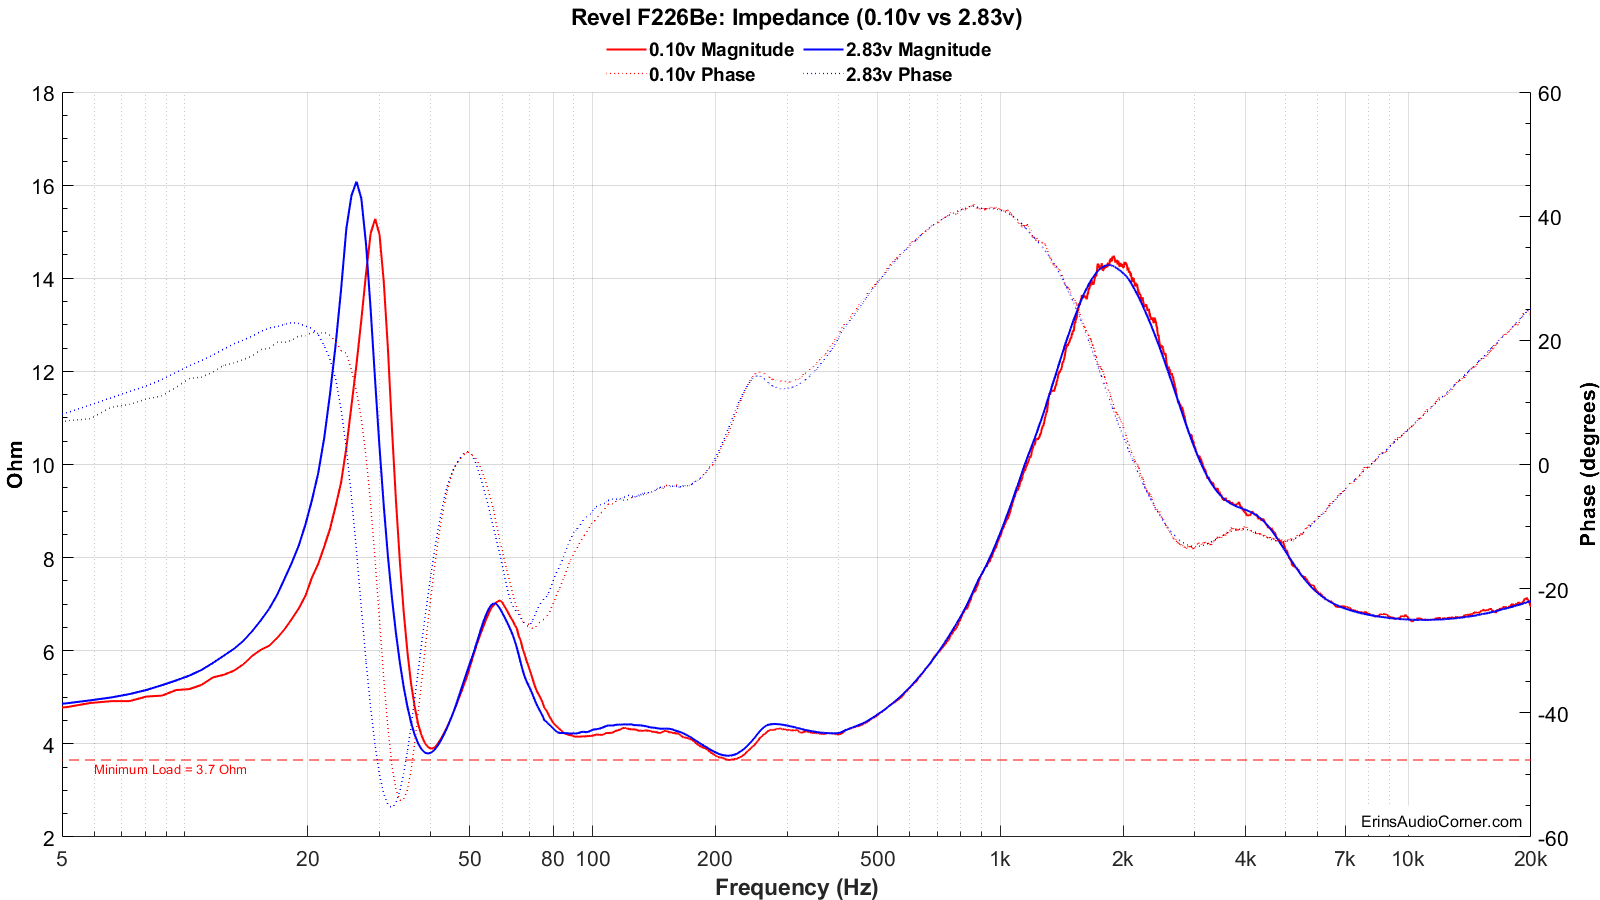
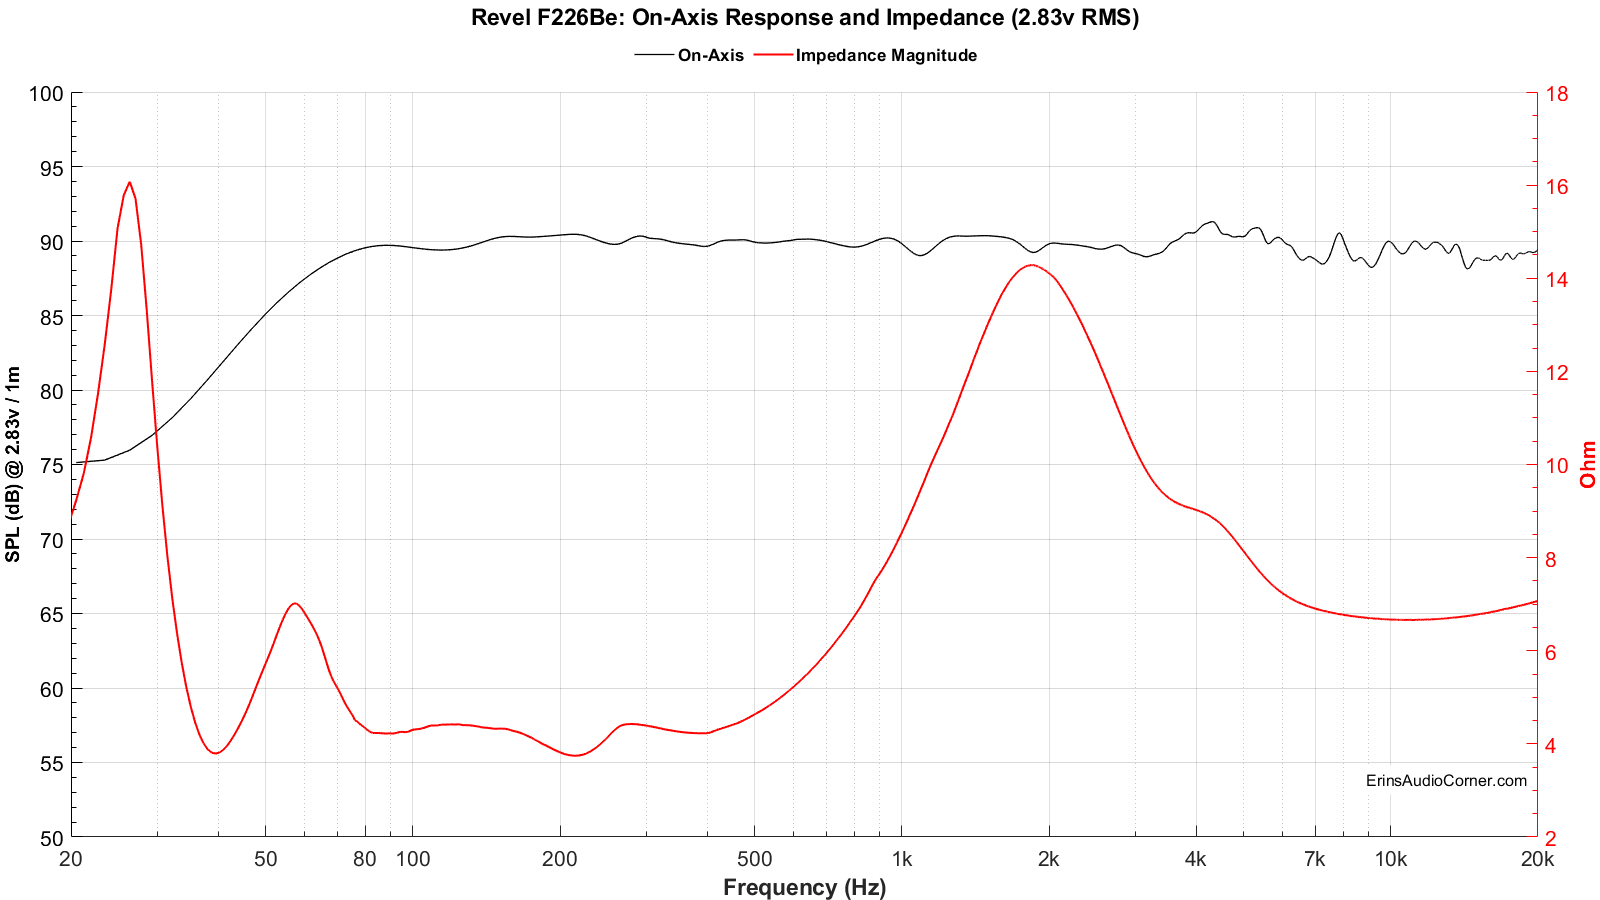
Impedance measurements are provided both at 0.10 volts RMS and 2.83 volts RMS. The low-level voltage version is standard because it ensures the speaker/driver is in linear operating range. The higher voltage is to see what happens when the output voltage is increased to the 2.83vRMS speaker sensitivity test.
Frequency Response:
Notes about measurements (click for info)
Frequency response data (horizontal, vertical, “Spinorama”, polar, spectrograms, etc.) are all based on a 2.83 volts RMS logarithmic sweep at 1 meter to meet the standard sensitivity measurement spec. These data are captured using Klippel’s TRF module and a mixture of ground-plane measurement and 4-pi free-field measurement. Klippel’s In-Situ Room Compensation (ISC) module is then used with the ground plane measurement to provide a ‘reference’ curve to the 4-pi measurement which then corrects for the room’s influence and allows me to generate a reflection-free far-field response from an indoors measurement. Note: This is not a standard merge of nearfield and farfield nor a merge of ground-plane and farfield. Typical merged responses still suffer low resolution in the midrange where the response is merged due to the necessity of windowing the impulse response to remove reflections. One major downside to “gating” or “windowing” the impulse response is this low-resolution does not show resonance in the midrange. For example, most free-field measurements are only reflection-free until approximately 3 milliseconds, or about 300Hz. That means a data point every 300Hz. If you have a high-Q resonance at 450Hz the 300Hz resolution data will not show this resonance because the frequency resolution only has a data point at 300Hz and 600Hz; skipping right over the 450Hz. You would need a resolution of at least a half the width of the Q-factor; generally, 20Hz is adequate. However, 20Hz resolution is roughly 50ms of window-free response. The only way to achieve this is in a large parking lot or open field. Ground plane measurements are perfect for this but are subject to aiming/ground absorption (grass) and related issues above 400Hz. The ISC module permits results with as-close-to-anechoic as one can achieve without being anechoic. Thanks to the ISC module, the data I am providing here is higher resolution (~30Hz resolution) than an average person can provide without access to an anechoic chamber or the like.
The measurement below provides the frequency response at the reference measurement axis - also known as the 0-degree axis or “on axis” plane - in this measurement condition was situated at the tweeter.
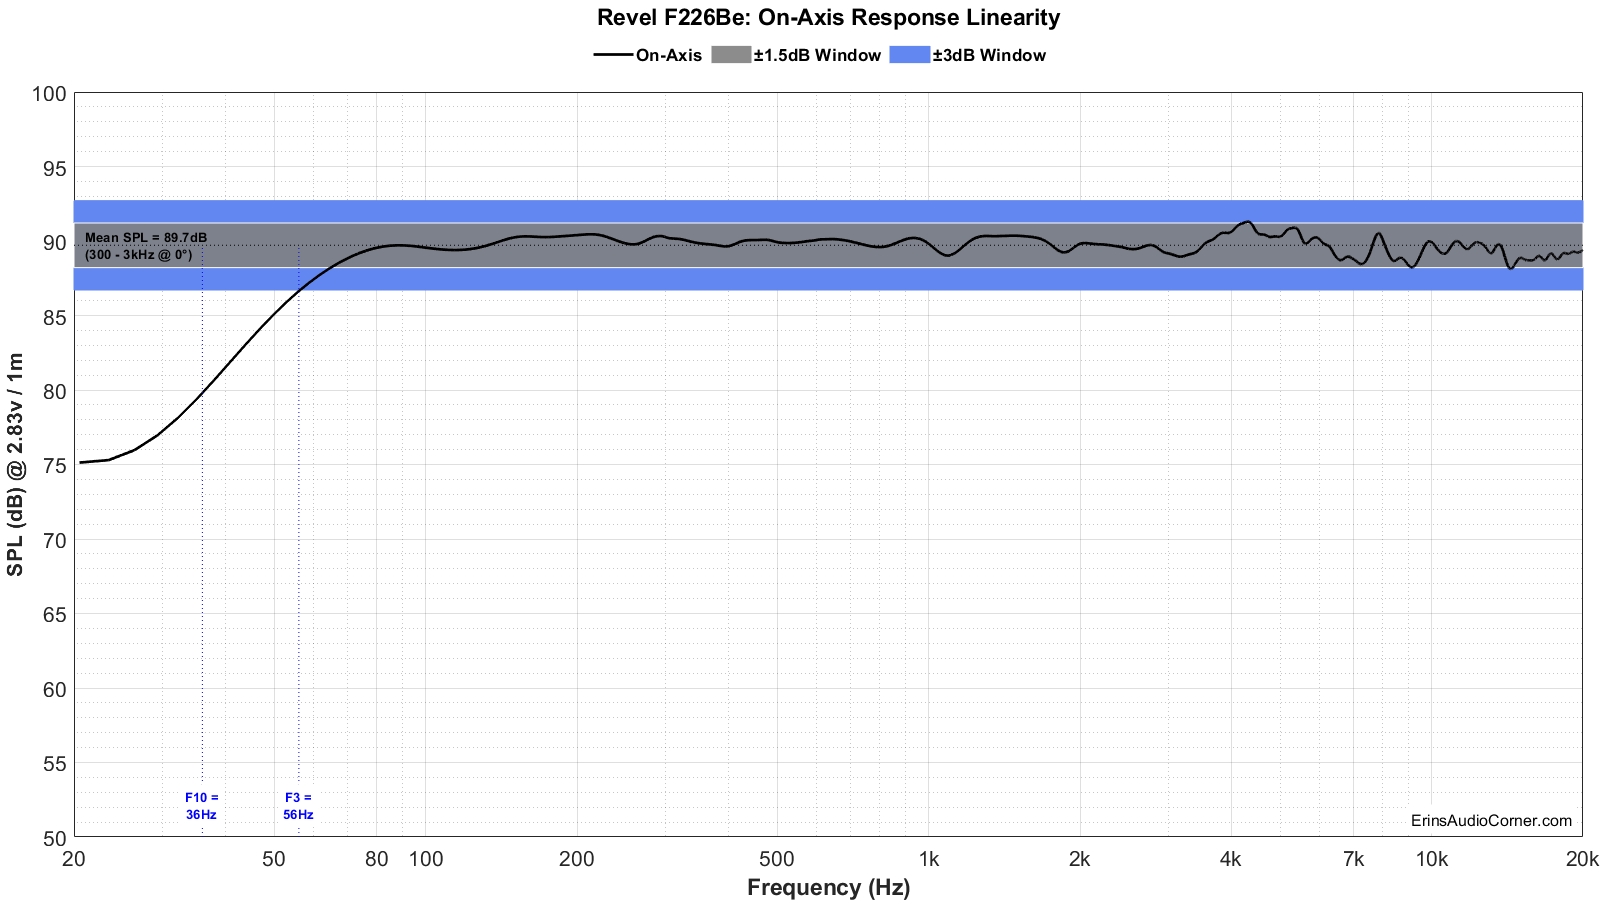
The mean SPL, approximately 89.7dB at 2.83v/1m, is calculated over the frequency range of 300Hz to 3,000Hz.
The blue shaded area represents the ±3dB response window from my calculated mean SPL value. As you can see in the blue window above, this speaker has a ±3dB response above 56Hz. Even better, a tighter window of linearity is provided in gray as ±1.5dB from the mean SPL and this speaker stays within this window above 65Hz. This is the most linear on-axis response I have measured from any speaker to date.
The speaker’s F3 point (the frequency at which the response has fallen 3dB relative to the mean SPL) is 56Hz and the F10 (the frequency at which the response has fallen by 10dB relative to the mean SPL) is 36Hz. This speaker has nice low frequency extension and may be adequate for many without a sub-woofer. However, I recommend the use of a subwoofer below 40-50Hz not only to provide additional low-frequency output for movies and music and additionally to both take the strain off this speaker (increasing dynamic range) as well as to spread some room modes (when using multiple subwoofers).
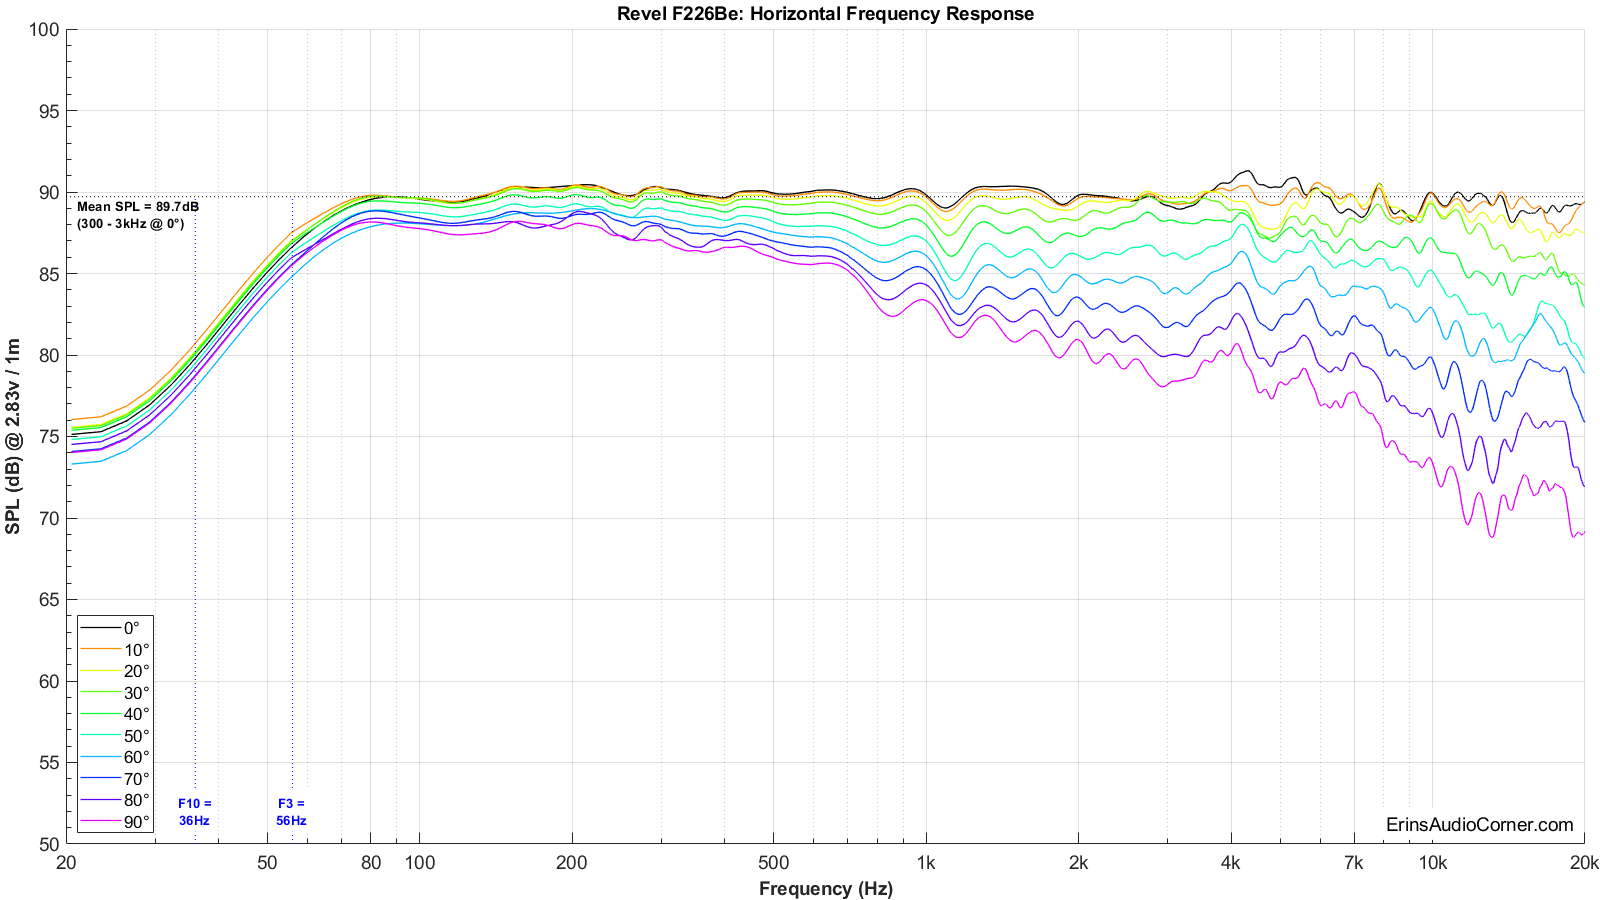
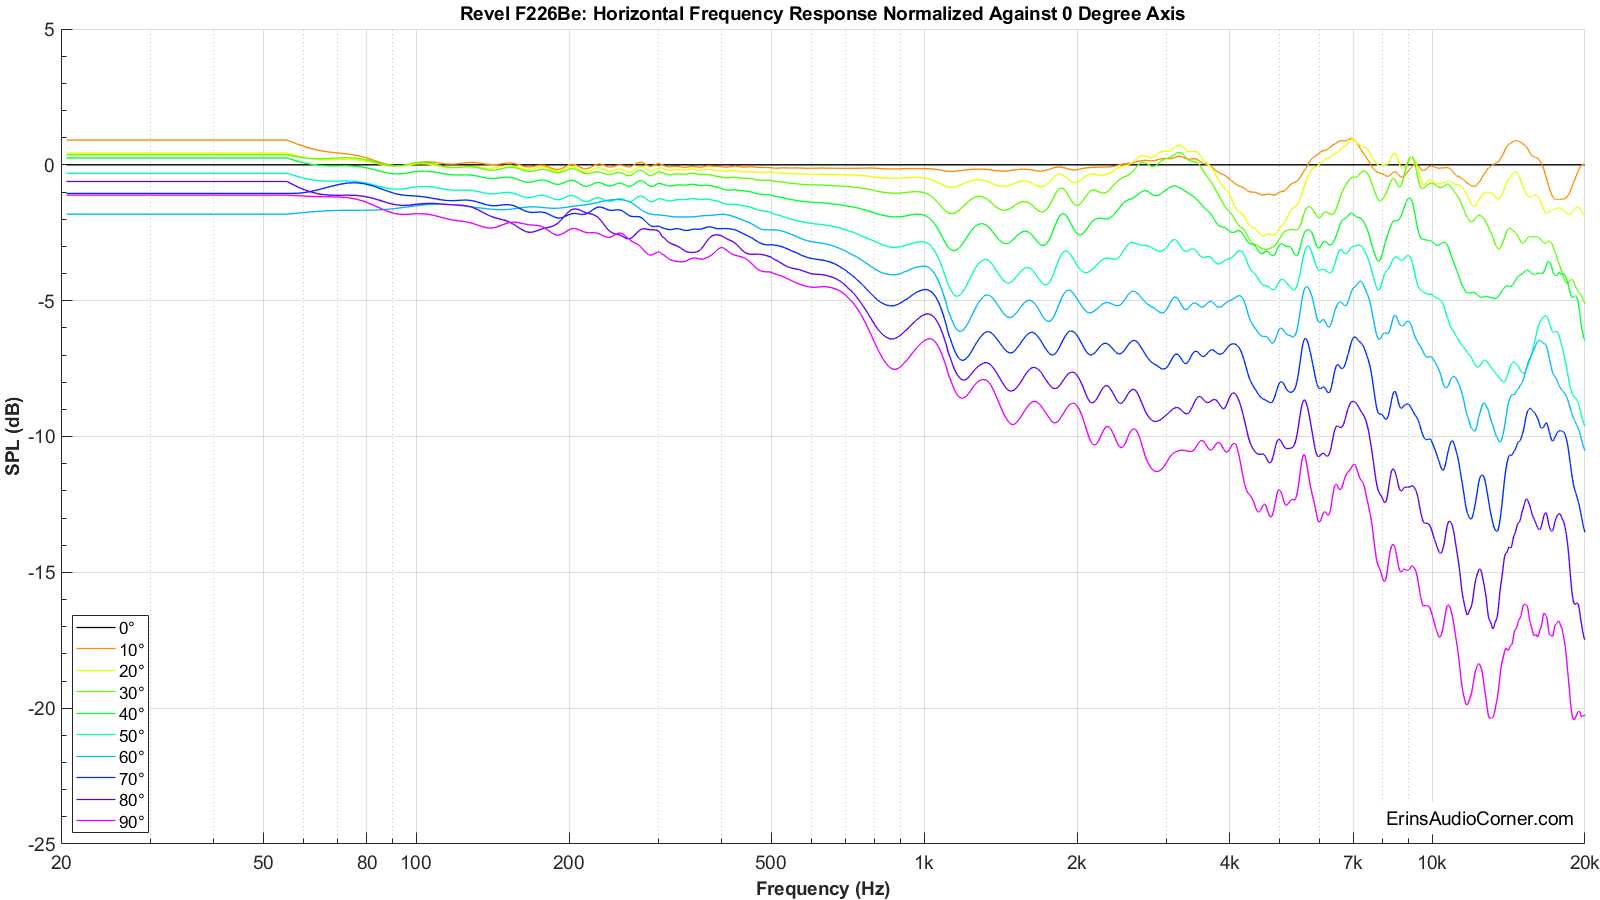
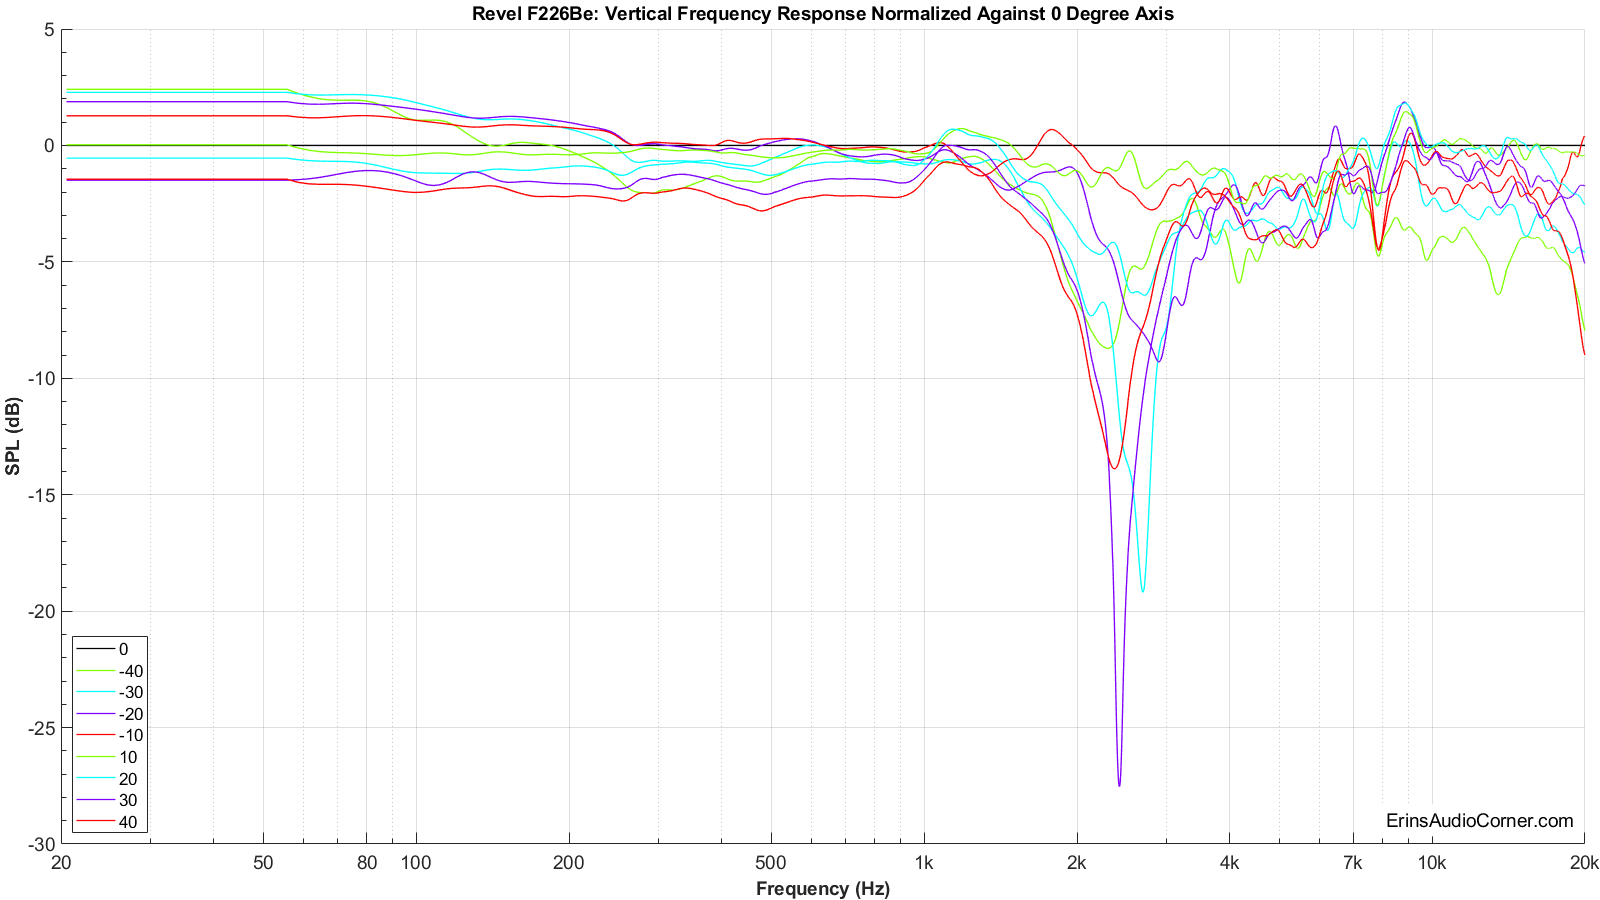
Below are both the horizontal and vertical response over a limited window (90° horizontal, ±40° vertical). I have provided a “normalized” set of data as well. The normalization simply means that I took the difference of the on-axis response and compared the other axes’ measurements to the on-axis response which gives the viewer a good idea of the speaker performance, relative to the on-axis response, as you move off-axis.
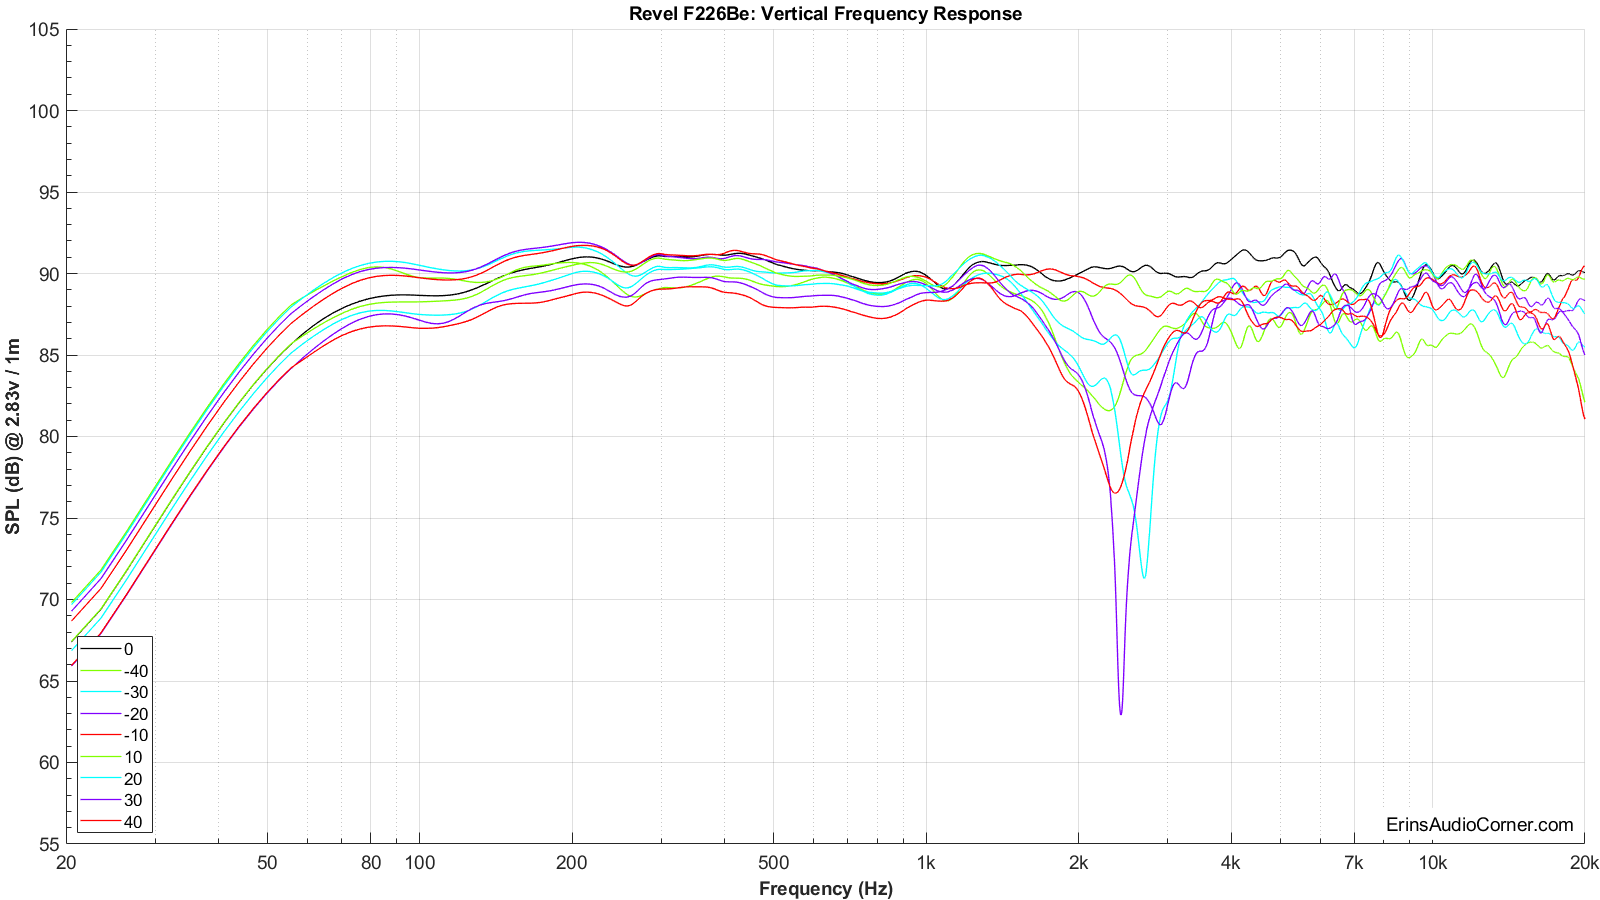
As I said above, the provided frequency response graphs were given with a limited set of data. I measured the response of the speaker’s vertical and horizontal axis in 10-degree steps over 360-degrees. Nearly 70 measurements in total are represented in my data. As you can imagine, providing all those data points in a single FR-type graphic below is a bit overwhelming and confusing for the viewer. A spectrogram is an alternate way to view this full set of data. This takes a 360-degree set of data and “collapses” it down to a rectangular representation of the various angles’ SPL. I have provided two sets of data: one set for horizontal and one for vertical. Each set consists of 2 graphics:
- Full response (20Hz - 20kHz with the angles from 0° to ±180°) with absolute SPL values
- Full, “normalized” response (20Hz - 20kHz with the angles from 0° to ±180°) with SPL values relative to the 0-degree axis
Normalized plots make it easier to compare how the speaker’s off-axis response behaves relative to the on-axis response curve.
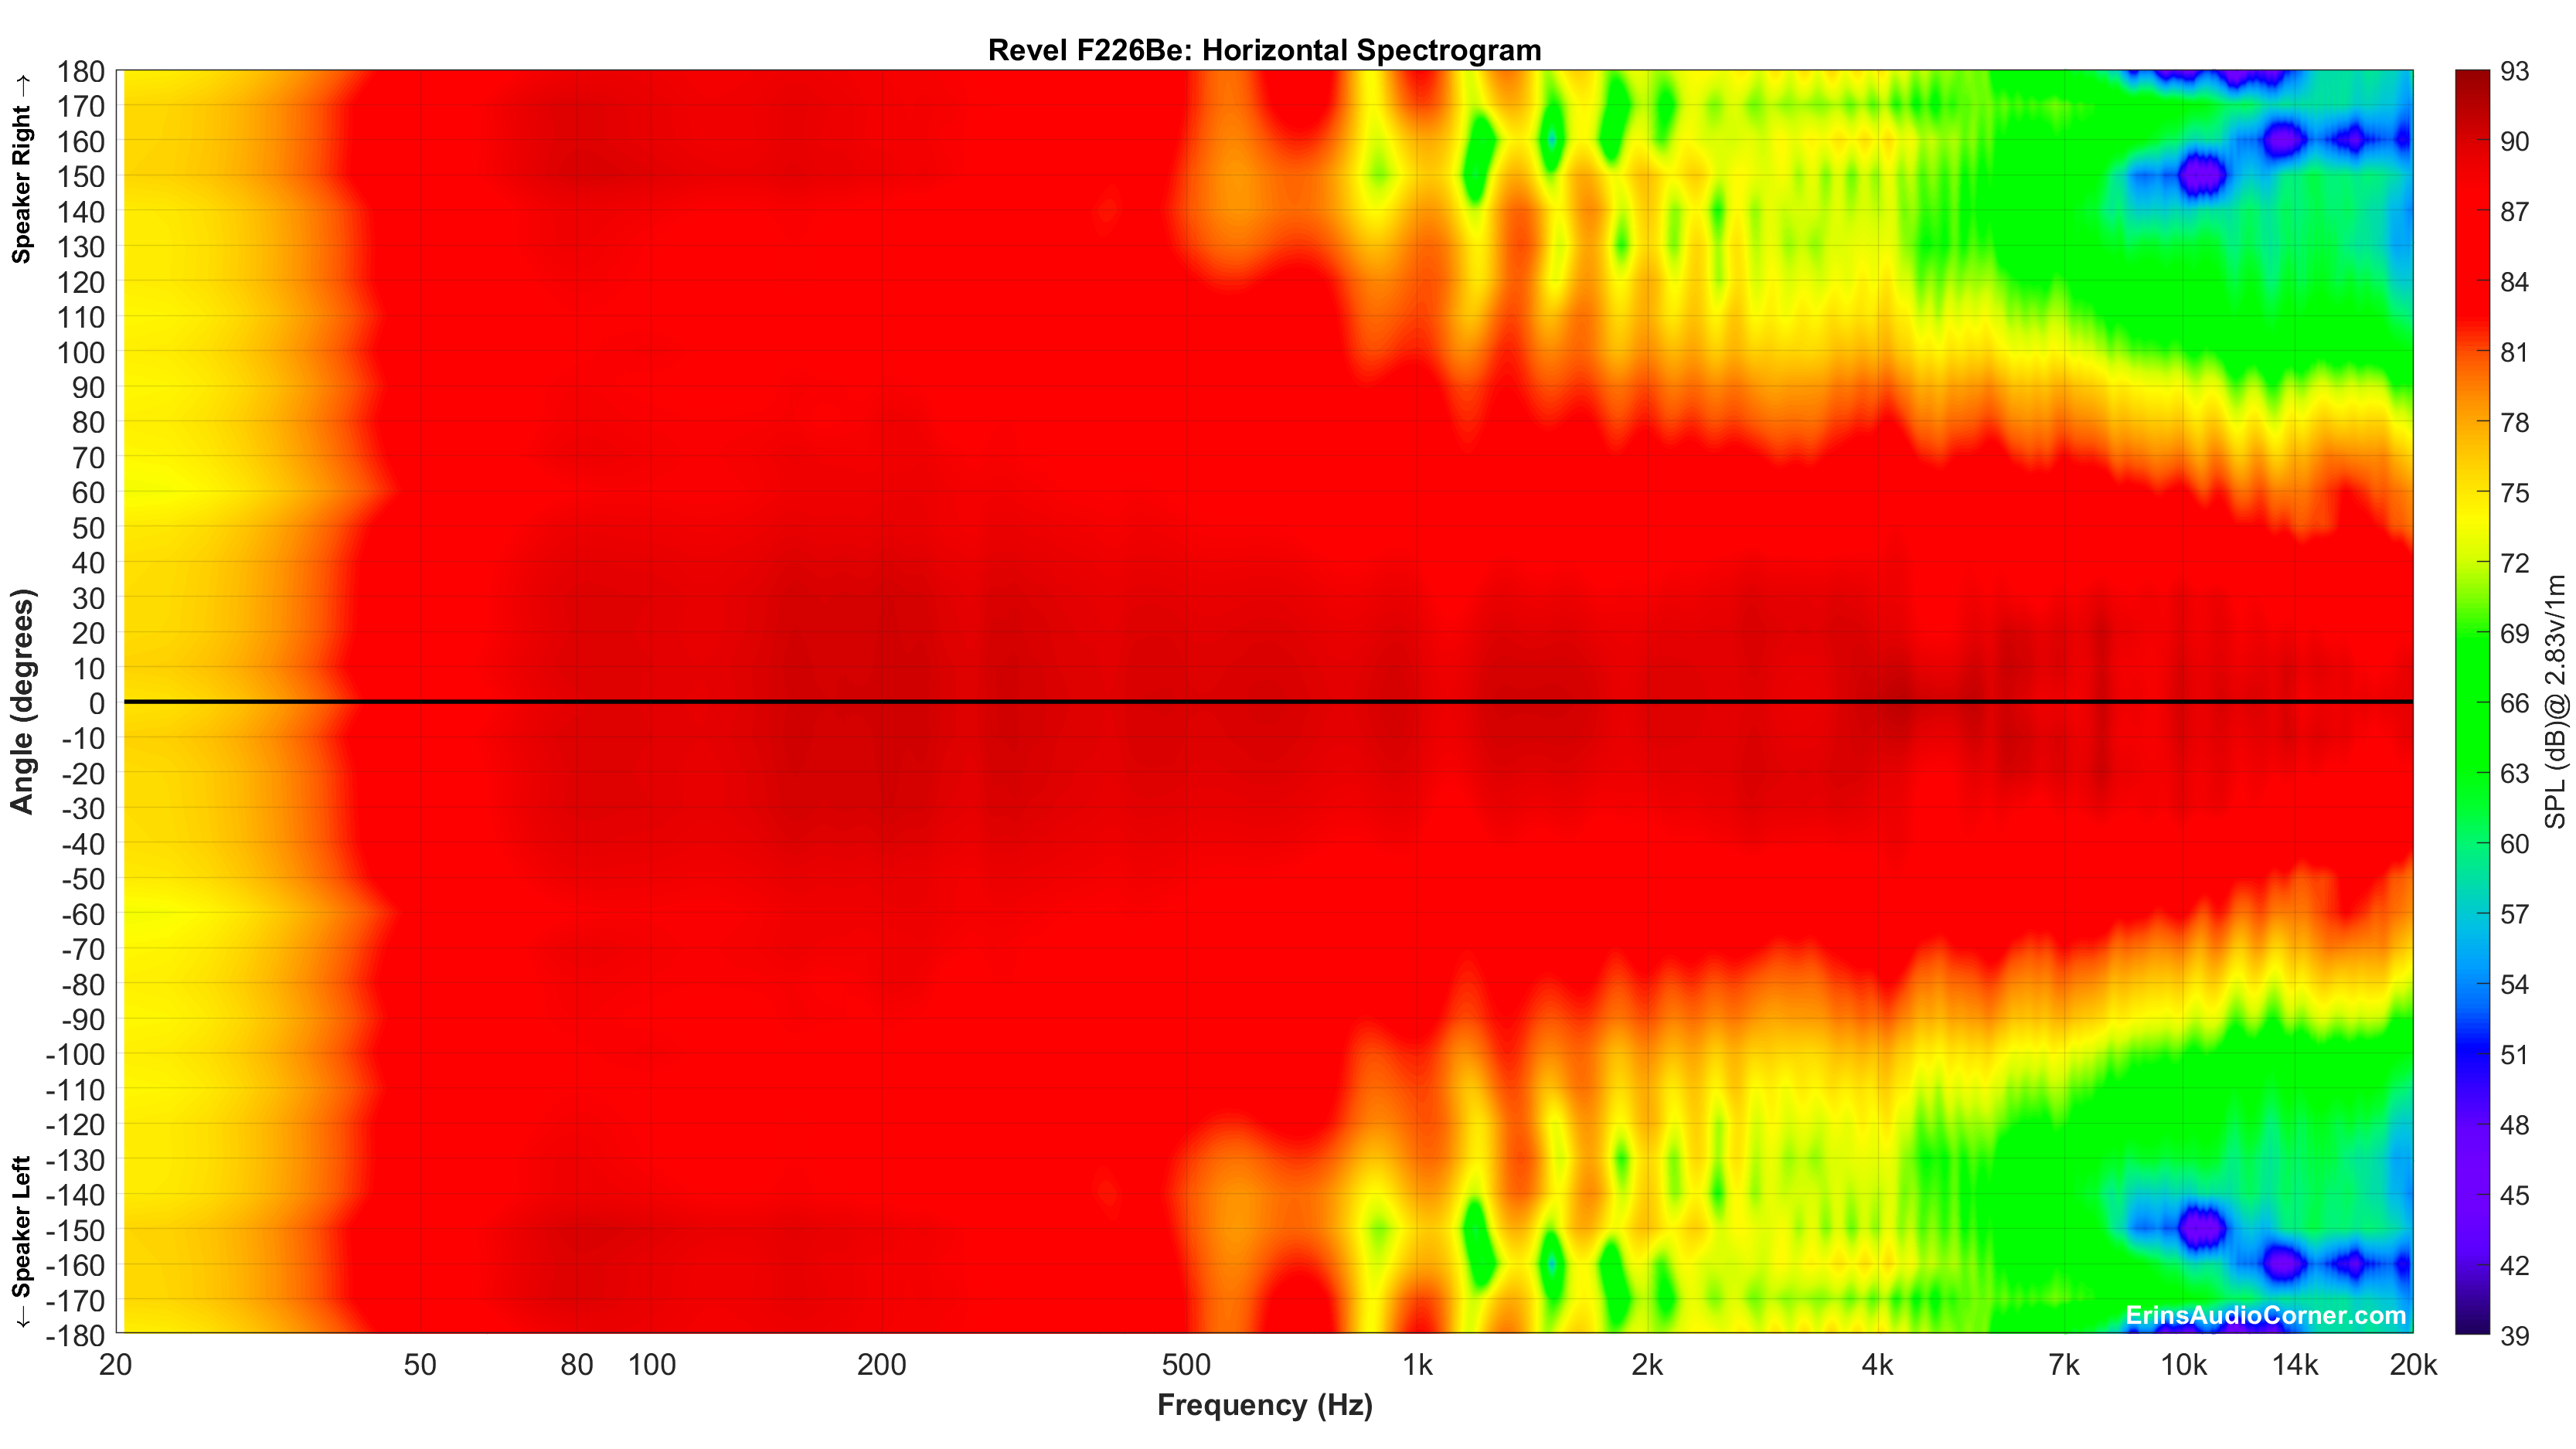
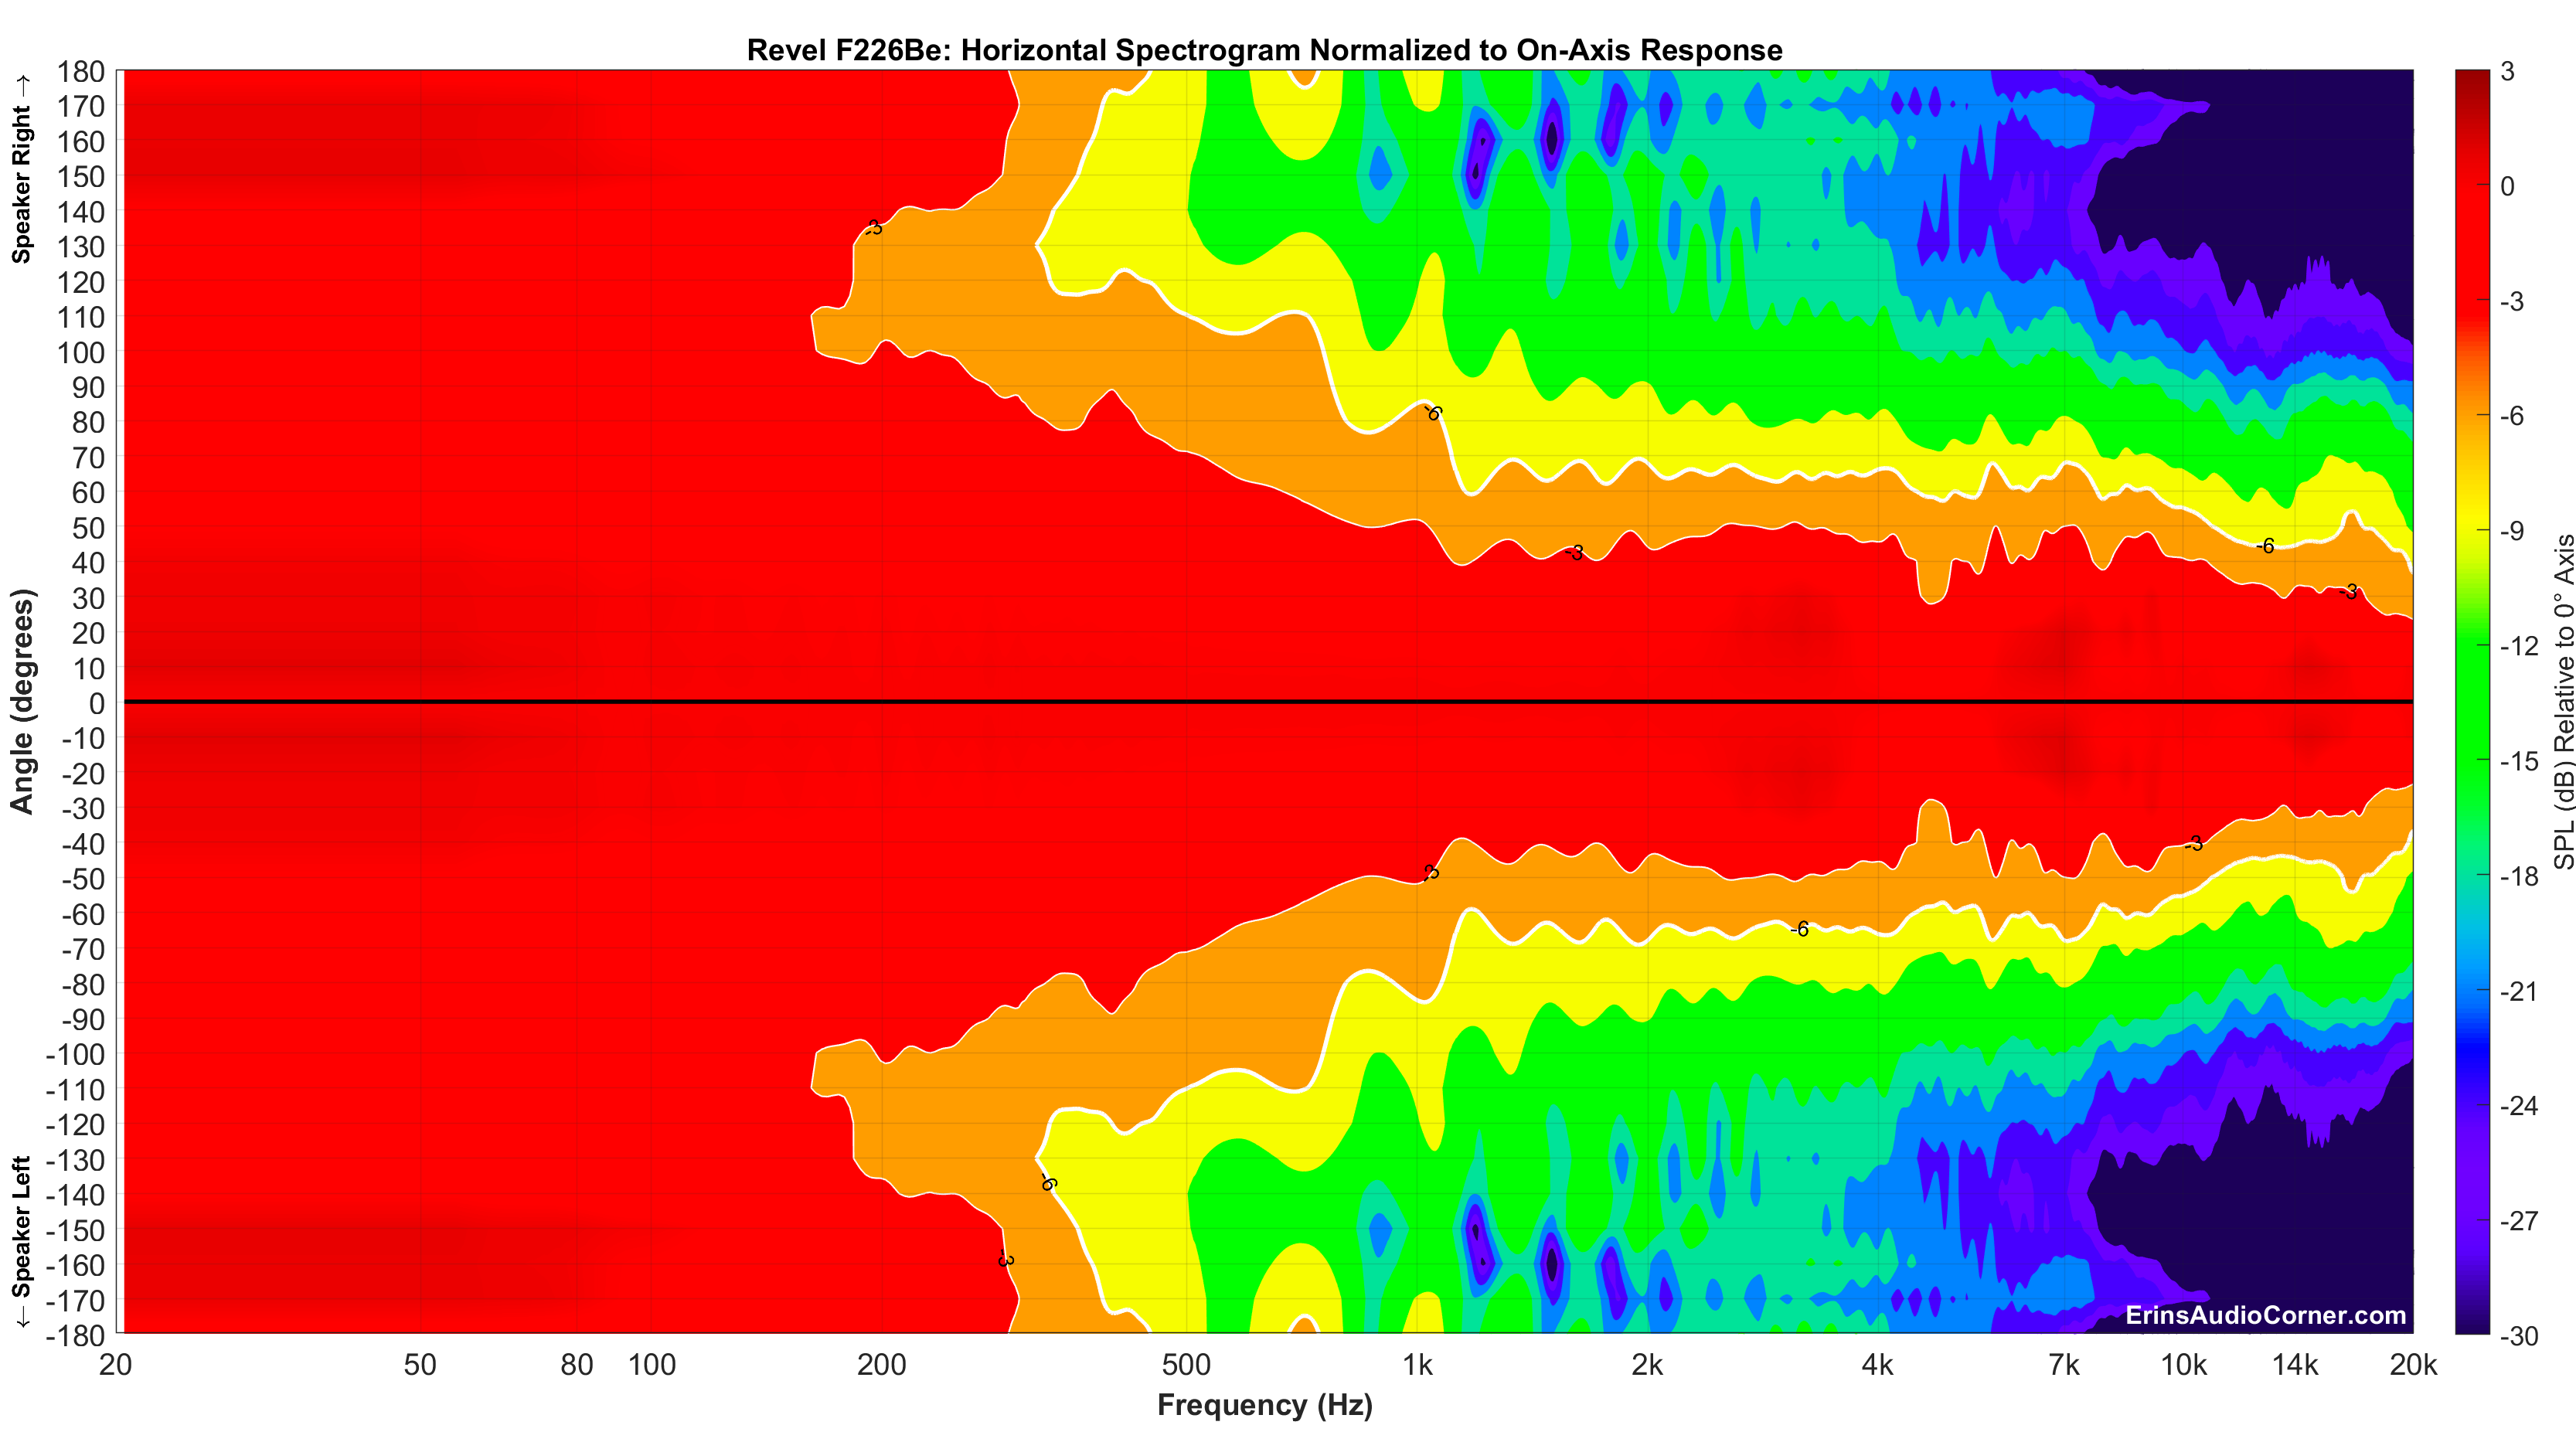
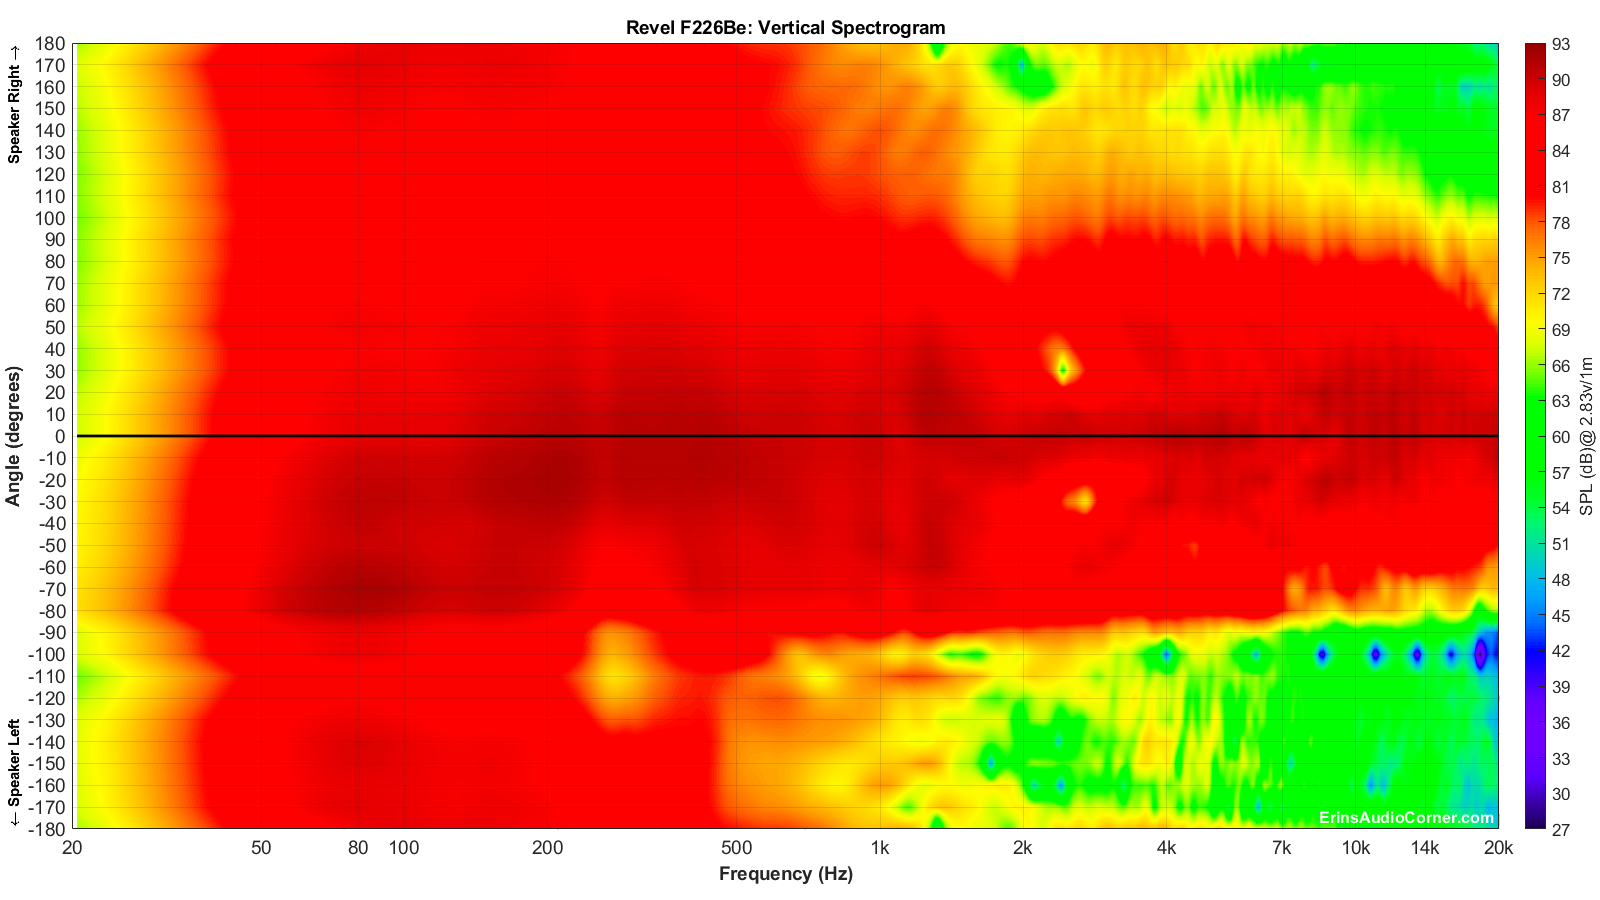
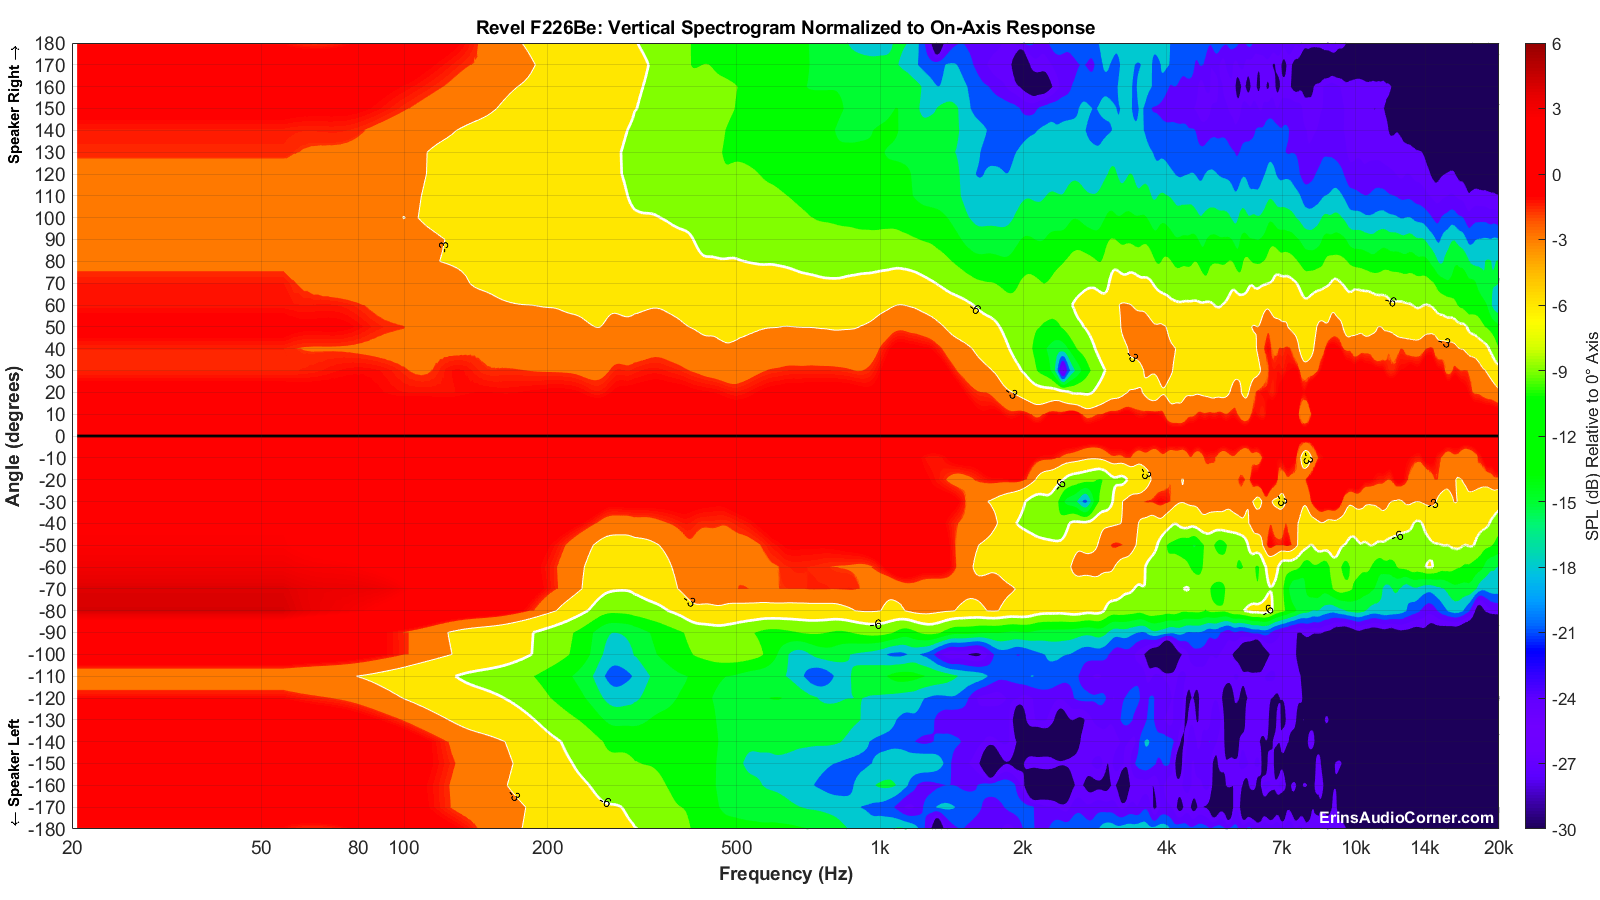
The above spectrograms are the standard way of providing directivity graphics by most reviewers. Some prefer not to normalize the data. Some prefer to normalize the data. Either way, it’s a useful visual to get an idea of the directivity characteristics of a speaker or driver.
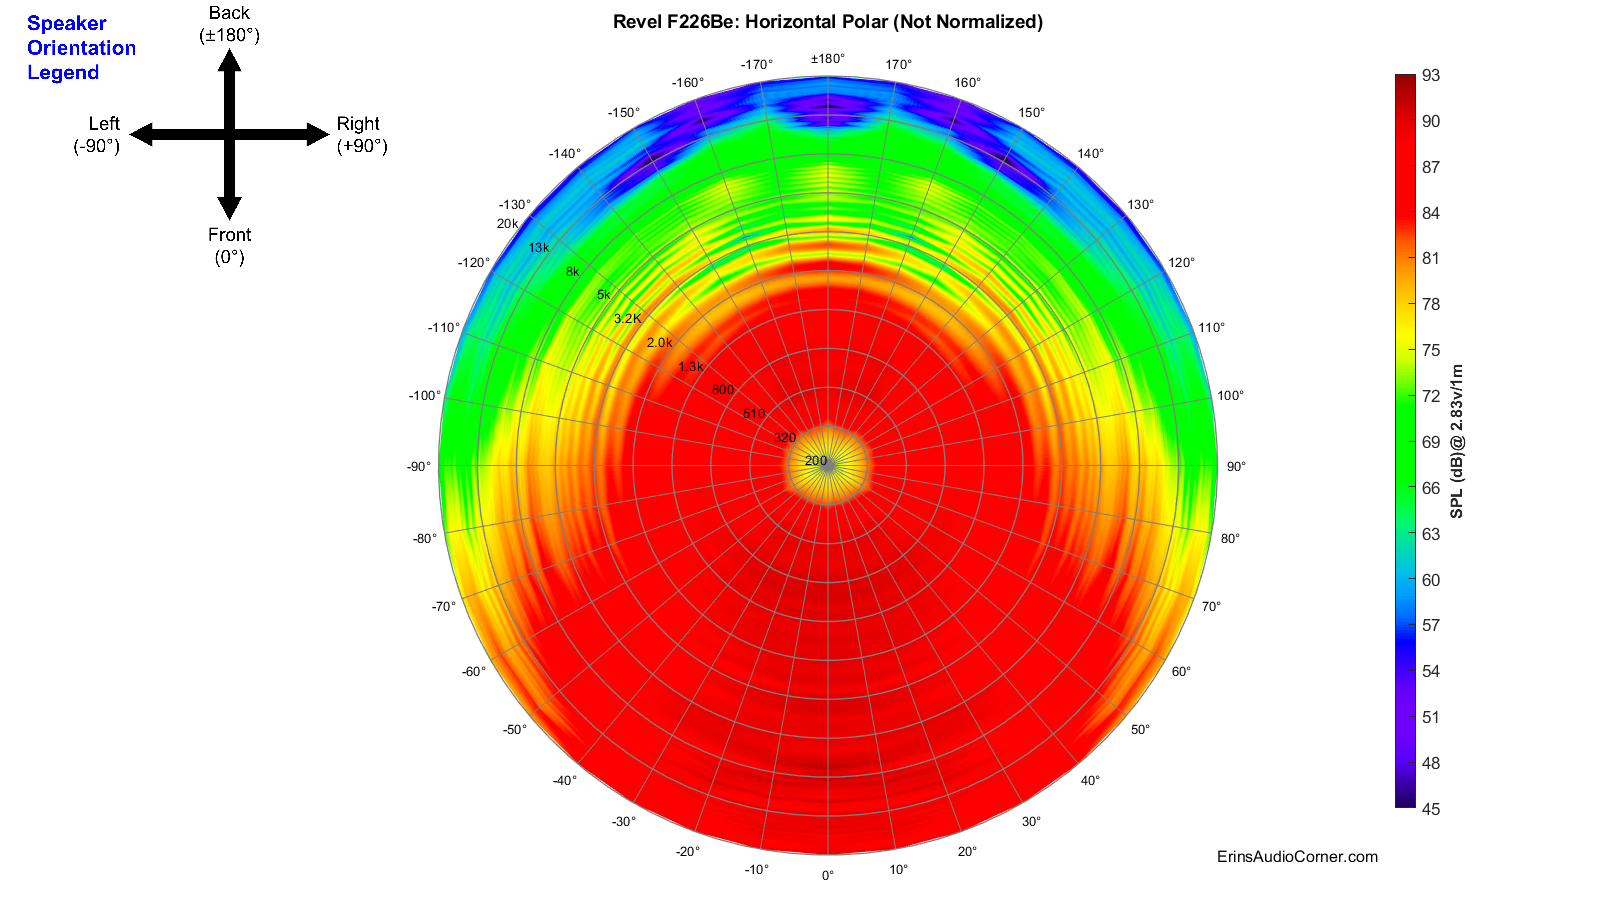
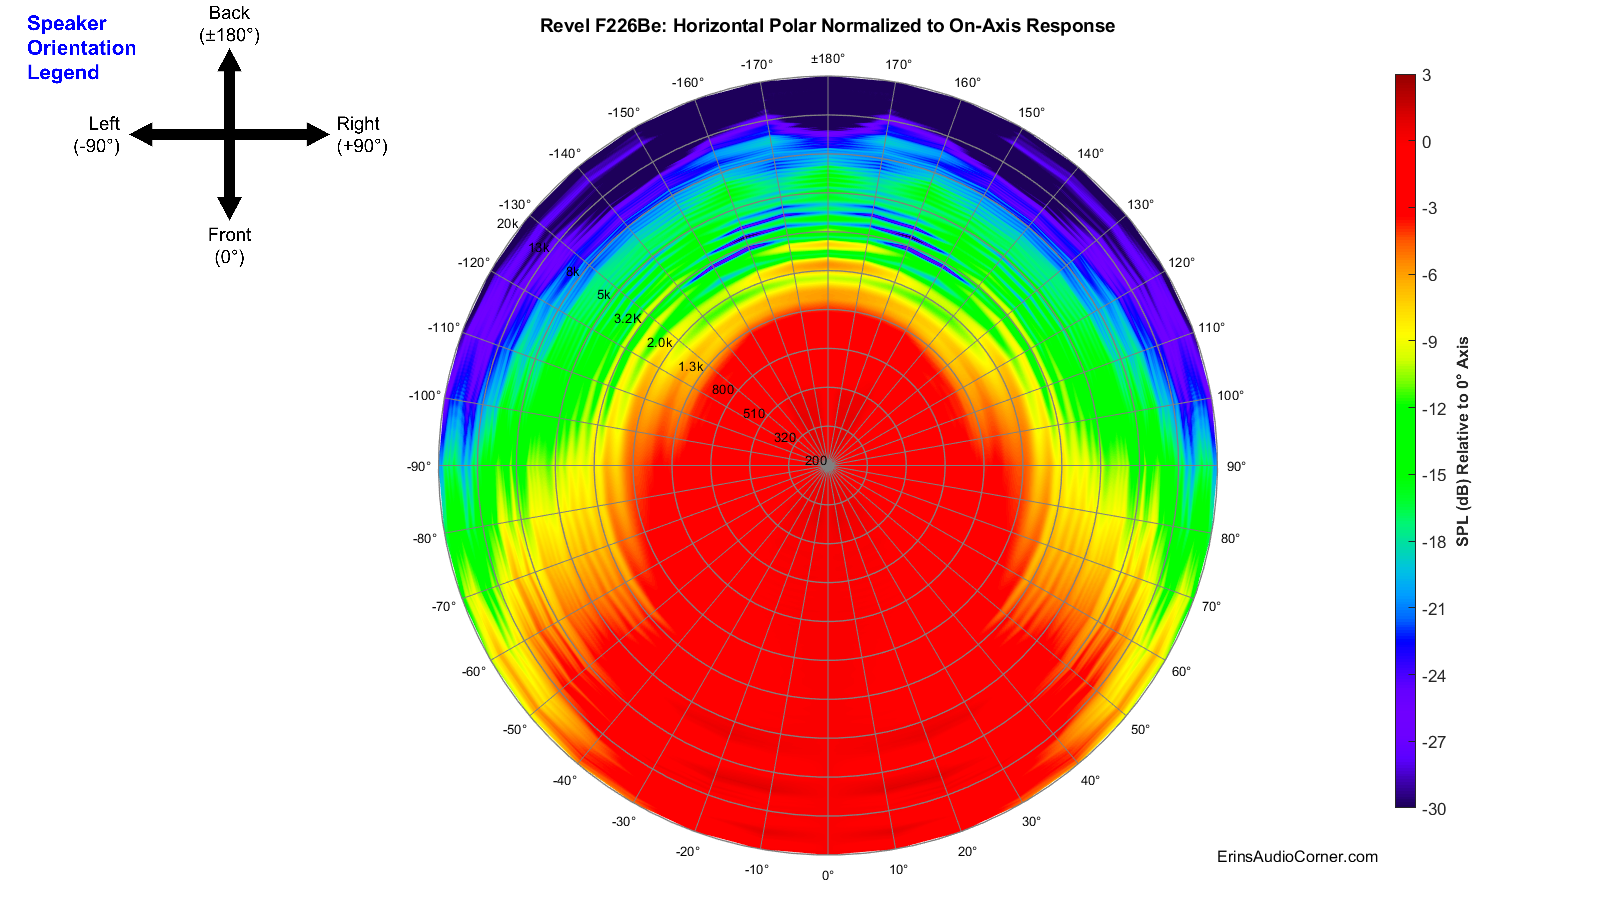
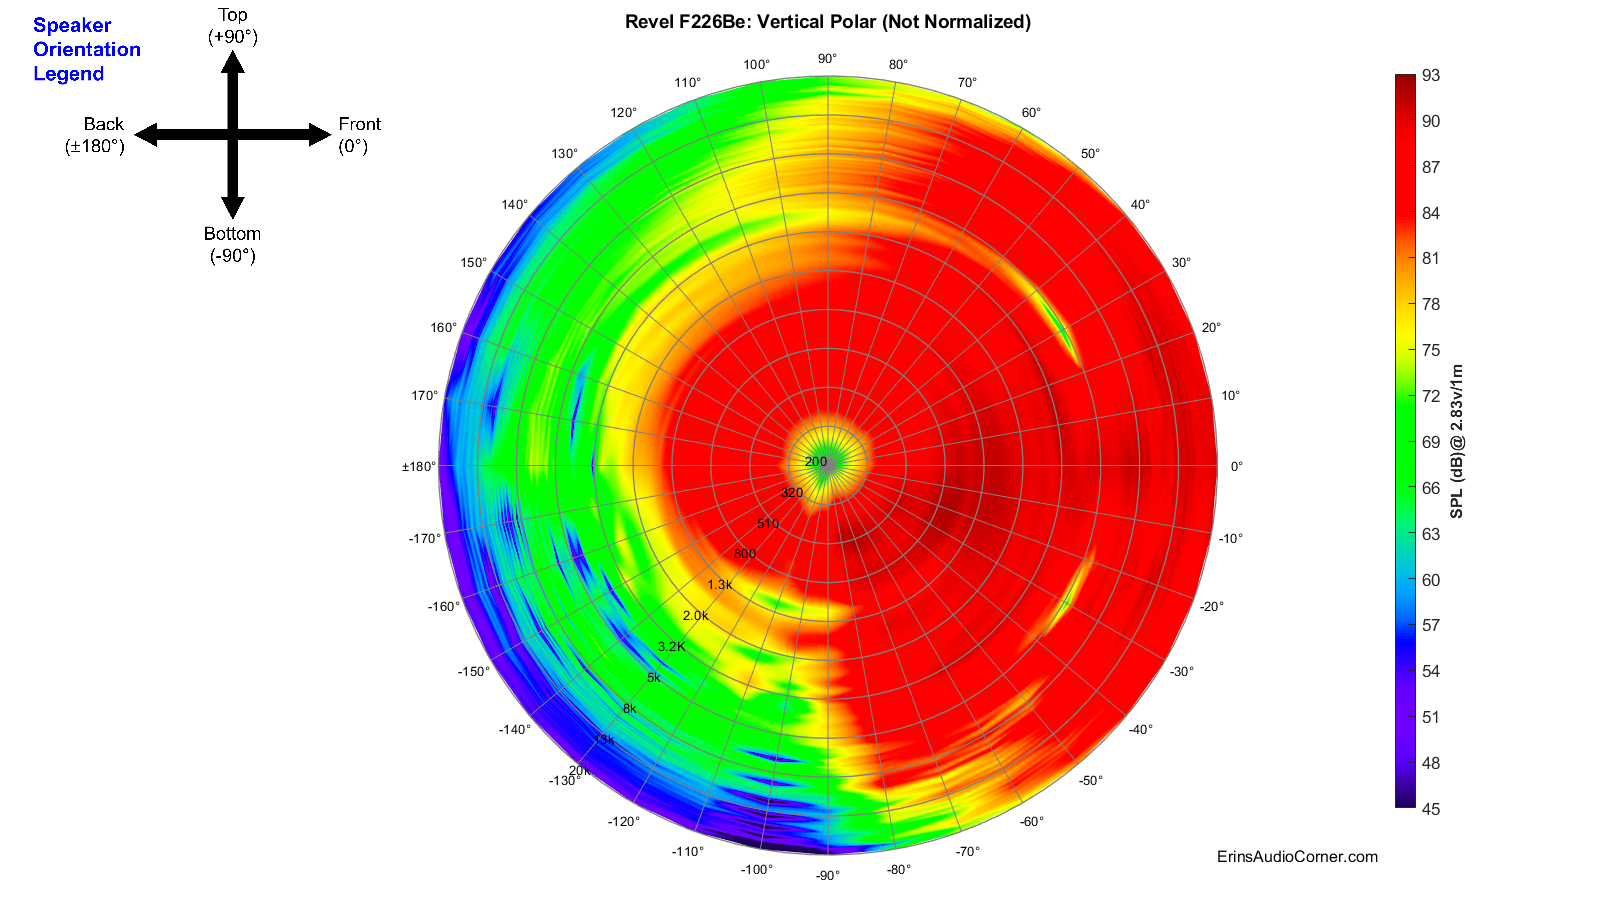
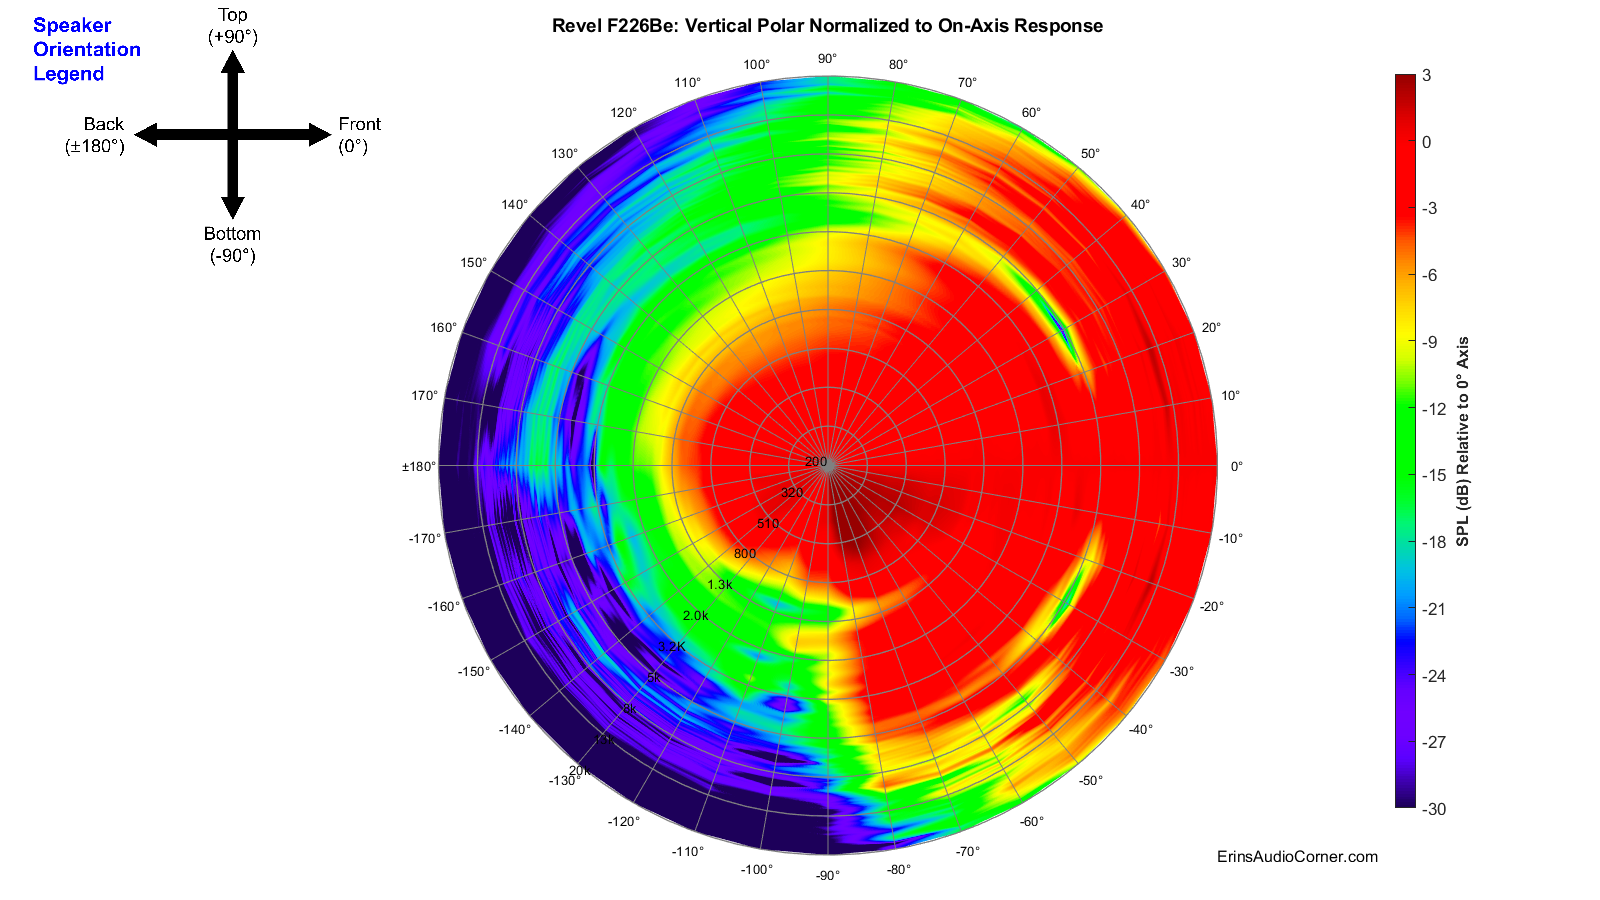
However, these “collapsed” representations of the sound field are not very intuitively viewed. At least not to me. So, I came up with a different way to view the speaker’s horizontal and vertical sound field by providing it across a 360° range in a globe plot below. I have provided both an absolute SPL version as well as a normalized version of both the horizontal and vertical sound fields.
Note the legend provided in the top left of each image which helps you understand speaker orientation provided in my global plots below.
CEA-2034 (aka: Spinorama):
The following set of data is populated via 360-degree, 10° stepped, “spins” from vertical and horizontal planes resulting in 70 unique measurements. Thus, this is sometimes referred to as “Spinorama” data. Audioholics has a great writeup on what these data mean (link here) and there is no sense in me trying to re-invent the wheel so I will reference you to them for further discussion. However, I will explain these curves lightly and provide my own spin on what they mean (pun totally intended). Sausalito Audio also has a good write-up on these curves here. Furthermore, you can find discussion in Dr. Floyd Toole’s book “Sound Reproduction”. Here’s my Amazon affiliate link if you want to purchase it and help me earn about 2% of the price. And, finally, here is a great video of Dr. Toole discussing the use of measurements to quantify in-room performance.
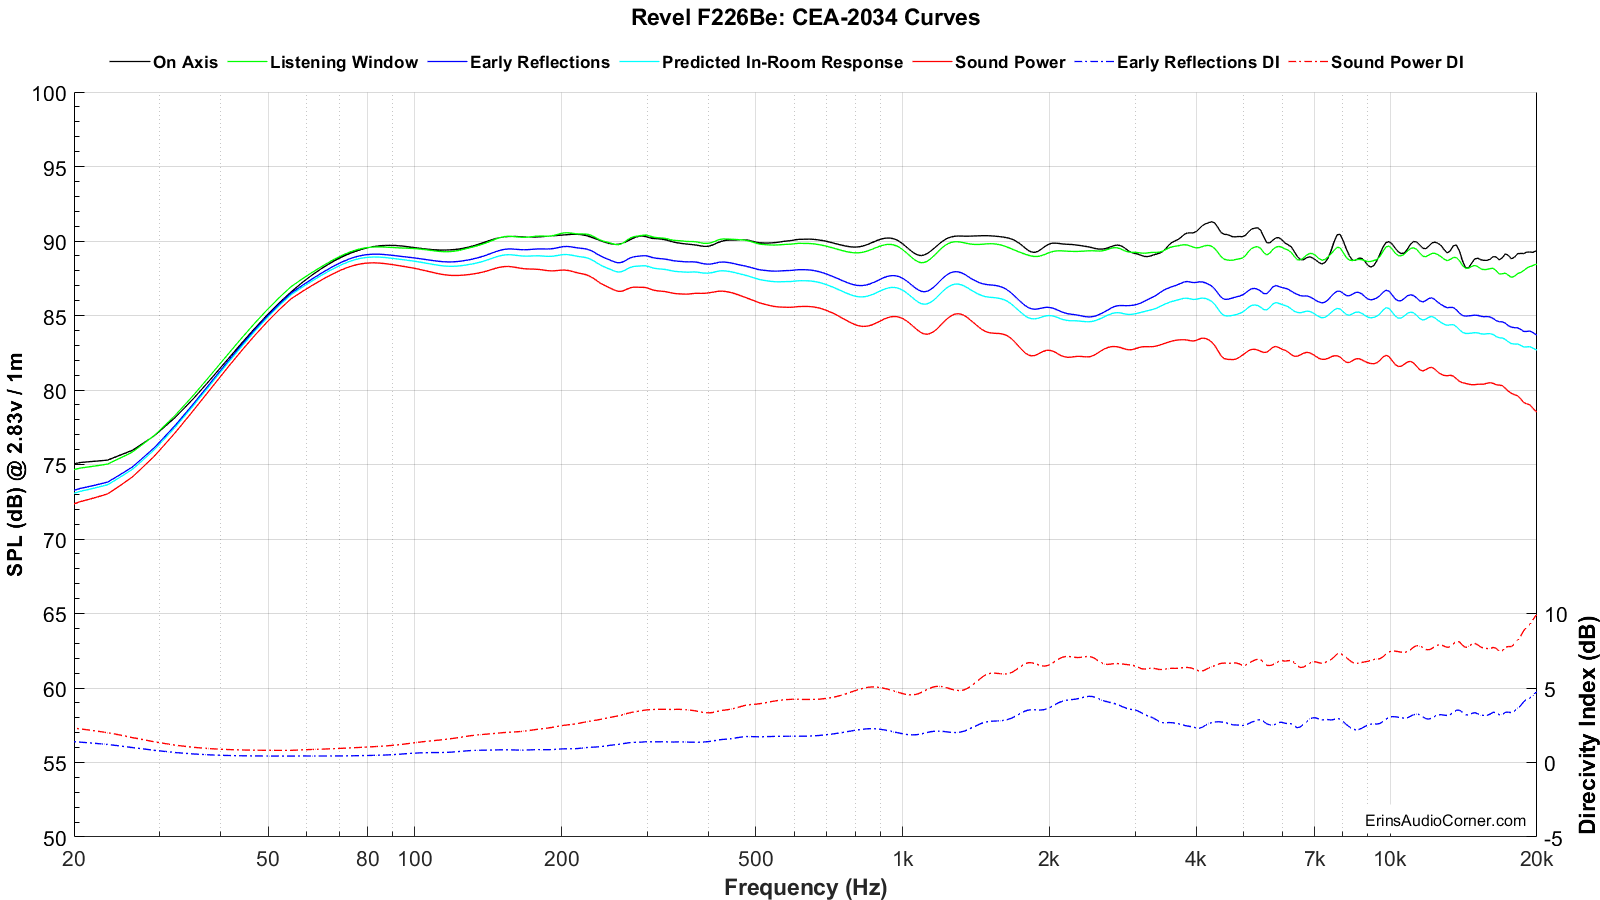
In short, the CEA-2034 graphic below takes all the response measurements (horizontal and vertical) and applies weighting and averaging to sub-sets and can help provide an (accurate) prediction of the response in a typical room. If there is a single set of data to use in your purchase decision, this is probably it.
Alternatively, click this arrow, if you want my quick take on what these curves mean without going to another site.
- On-Axis is simply the on-axis response. This is the 0-degree response curve.
- Listening Window is an average of the 0° to ±30° horizontal and 0° to ±10° vertical response curves and is used to understand what listeners typically hear in a home at the sweet spot, or Main Listening Position (MLP). The reason for this extended window of sound is simply because your room makeup might differ from another’s. This curve is an attempt to quantify a speaker’s performance over a smaller window that is often the norm for listening angle differences in various homes. It is important for this curve to very closely mimic the on-axis response. Deviations of the Listening Window curve relative to the on-axis response curve indicates a compromise in the speaker; often caused by directivity changes (as a speaker transitions from one drive-unit to another a la midwoofer to tweeter, or as a tweeter’s response becomes highly directional).
- Early Reflections is very useful because it helps us determine how the room’s influence will alter (corrupt, most of the time) the direct (on-axis) response. Ideally, the speaker radiates sound uniformly with no aberrations; no resonance, no directivity changes as the speaker transitions from the mid to the tweeter and so on. Because speakers often have these issues, however, what is reflected to us from the walls, ceiling and floor is not the same as what we hear from the on-axis, direct sound. And that’s a problem. Why is that a problem? As stated in Dr. Toole’s book “these are very influential in establishing timbral and spatial qualities”. Large deviations in this relative to the on-axis response also indicate areas where the room is of consequence. Also, it is important to understand the Early Reflections response is made up of rear-firing sounds. A speaker drive-unit is omnidirectional (radiating in all angles evenly) until the half-wavelength equals that of the drive-unit diameter. When the diameter is larger than the wavelength being played, the sound transitions from omnidirectional to directional; also known as “beaming”. Even tweeters beam. For example, a 1-inch dome tweeter will beam at approximately 6750Hz (speed of sound ÷ 2 ÷ diameter). In most speakers you have a single tweeter, firing forward. You can imagine that the high-frequency response in the front of the speaker would therefore be quite different than what is measured behind the speaker. So, being that the Early Reflections curve includes rear-hemisphere measurements you can understand that the high-frequency response would slope downward vs the on-axis response. This is understood and accepted.
- Predicted In-Room Response curve has the benefit of showing directivity mismatches at the crossover as well as resonances easily by comparing them to the overlaid Target curve (further down).
- Directivity Index (DI) curves are the difference in the Listening Window and the respective Early Reflections or Sound Power curves. My understanding, currently, is the Sound Power and Sound Power DI aren’t quite as useful for typical homes. However, there is emphasis placed on the Early Reflections DI curve. The right Y-Axis provides a value associated with the DI curves. The higher the number, the more directional the speaker. For example: a “0” DI curve - a curve which is completely flat - would be a speaker that is purely omnidirectional; radiating uniformly in all angles vertically and horizontally. A speaker that increases over frequency means that it is radiating in a tighter window as you increase in frequency. This is typical because, as I discussed above, even tweeters beam… and most speakers have a single tweeter facing the front and therefore, the speaker becomes directional at whatever the tweeter’s beaming frequency is. There isn’t necessarily a one-size-fits-all DI curve value. Though, it seems people (myself included) prefer a speaker with a wider soundstage which is found in lower directivity speakers (because more sound is bouncing off the side walls; which confuses the use of side-wall absorption but that’s for a later debate). However, what is important is that the curve, however tall you may prefer it to be, is smooth; almost linear. Dips and peaks mean that something, not good, is going on. But a linear curve indicates excellent transition through crossover regions, no resonance, etc. Since speakers are not perfect, though, linear DI curves are not the norm. Speakers become directional as they increase in frequency, around strong resonances, and as the sound transitions at the crossover from one drive-unit to another and you wind up with areas with peaks and/or dips whether they’re spread through a wide frequency range (low-Q) or very sharp/drastic (high-Q). But when you’re looking at the Early Reflections DI curve, look for this: smooth.
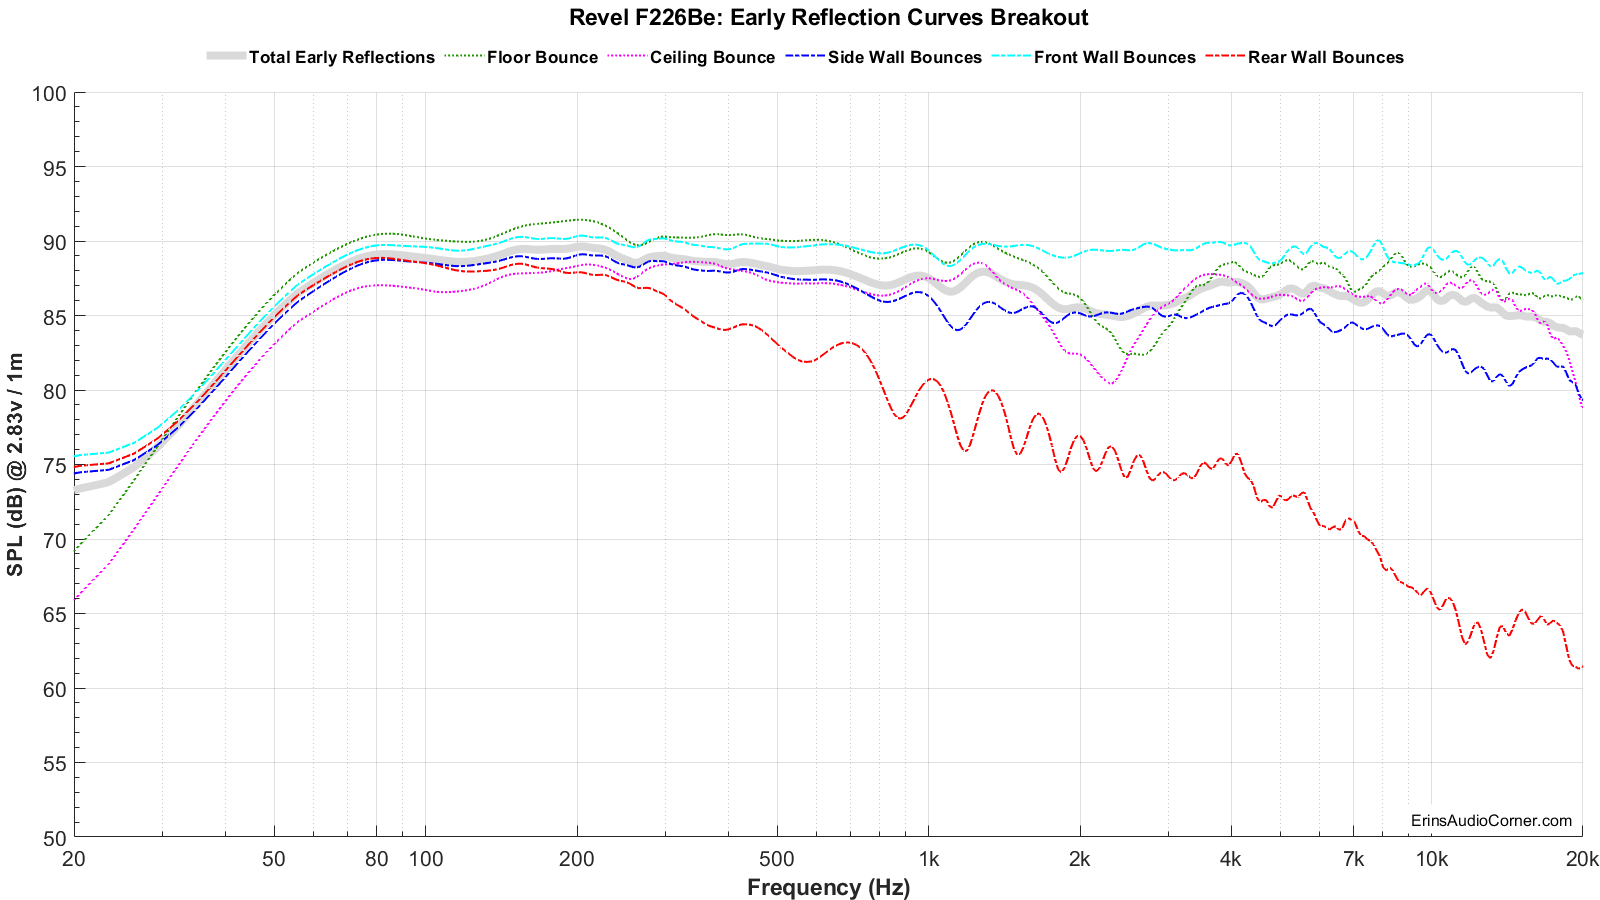
Below is a breakout of the typical room’s Early Reflections contributors (floor bounce, ceiling, rear wall, front wall and side wall reflections). From this you can determine how much absorption you need and where to place it to help remedy strong dips from the reflection(s). In this case, the listening room would benefit from having at least a carpeted floor and, if willing to do so, acoustic absorption on the ceiling between the listener and the speakers.
And below is the Predicted In-Room response compared to a general target curve equaling -1dB/octave.
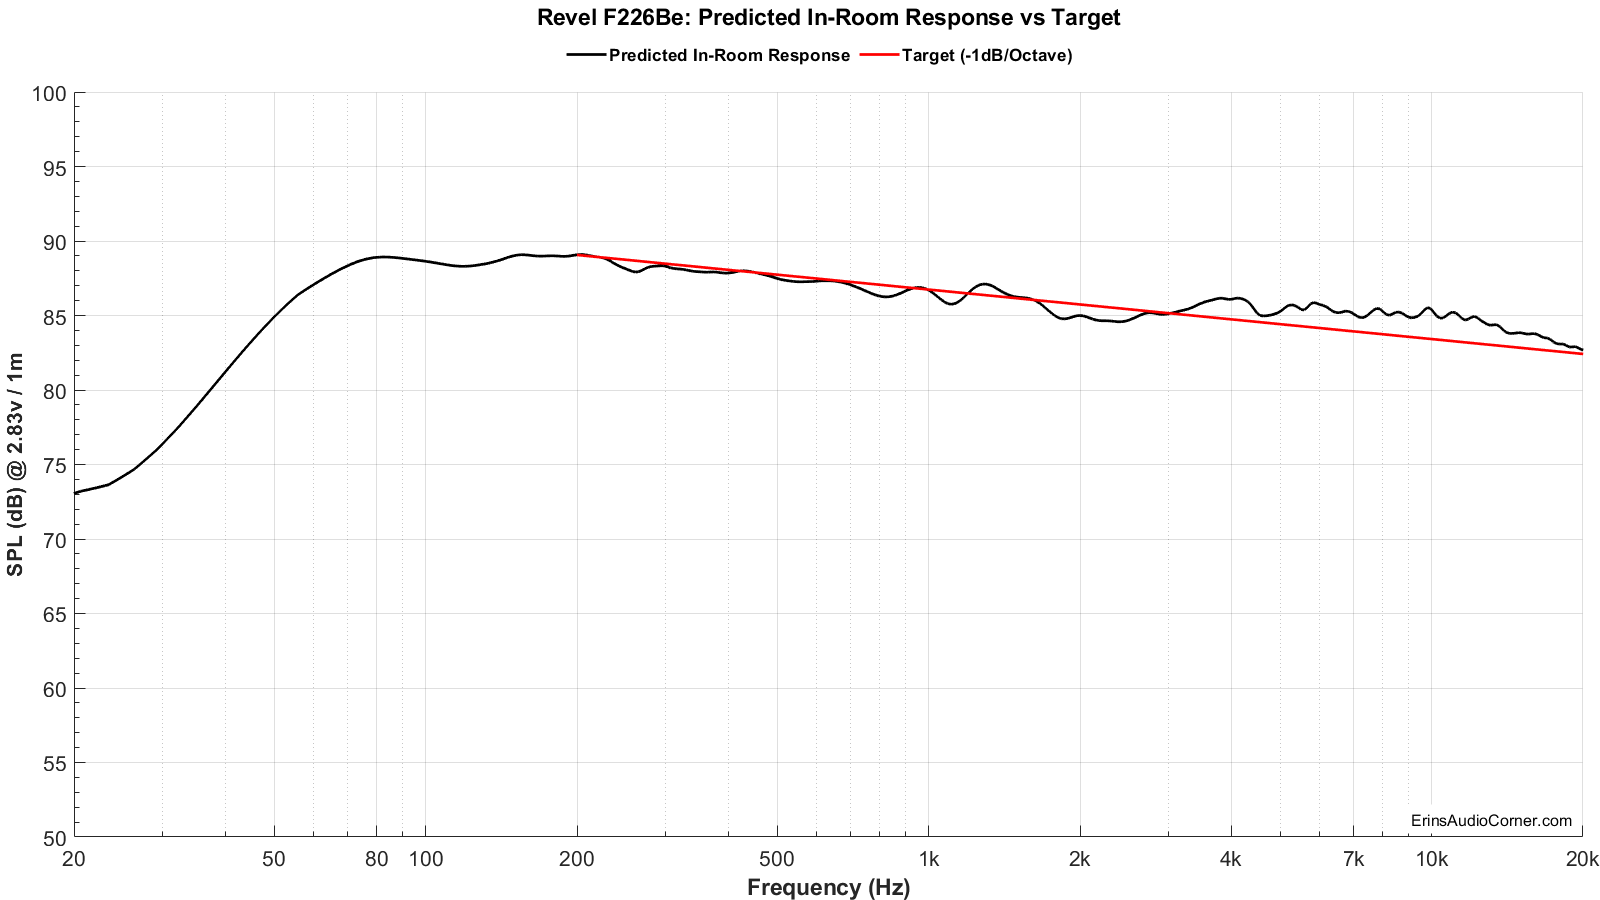
You may ask just how useful the above prediction is. Well, I’d be remiss for not delving in to that a little bit here. Please see my Analysis section below for discussion on this.
Harmonic Distortion:
Measurements were conducted at 2 meters ground plane using Klippel’s TRF module. Multiple output levels were tested to provide the trend of distortion component profiles and to provide a comparison against other drive units I have tested. The SPL provided is relative to 1 meter distance, averaged in the noted bandpass region.
Maximum Long Term SPL:
The below data provides the metrics for how Maximum Long Term SPL is determined. This measurement follows the IEC 60268-21 Long Term SPL protocol, per Klippel’s template, as such:
- Rated maximum sound pressure according IEC 60268-21 §18.4
- Using broadband multi-tone stimulus according §8.4
- Stimulus time = 60 s Excitation time + Preloops according §18.4.1
Each voltage test is 1 minute long (hence, the “Long Term” nomenclature).
The thresholds to determine the maximum SPL are:
- -20dB Distortion relative to the fundamental
- -3dB compression relative to the reference (1V) measurement
When the speaker has reached either or both of the above thresholds, the test is terminated and the SPL of the last test is the maximum SPL. In the below results I provide the summarized table as well as the data showing how/why this SPL was deemed to be the maximum.
This measurement is conducted once with a 20Hz to 20kHz multitone stimulus.
You can watch a demonstration of this testing via my YouTube channel: https://youtu.be/iCjJufvW0IA
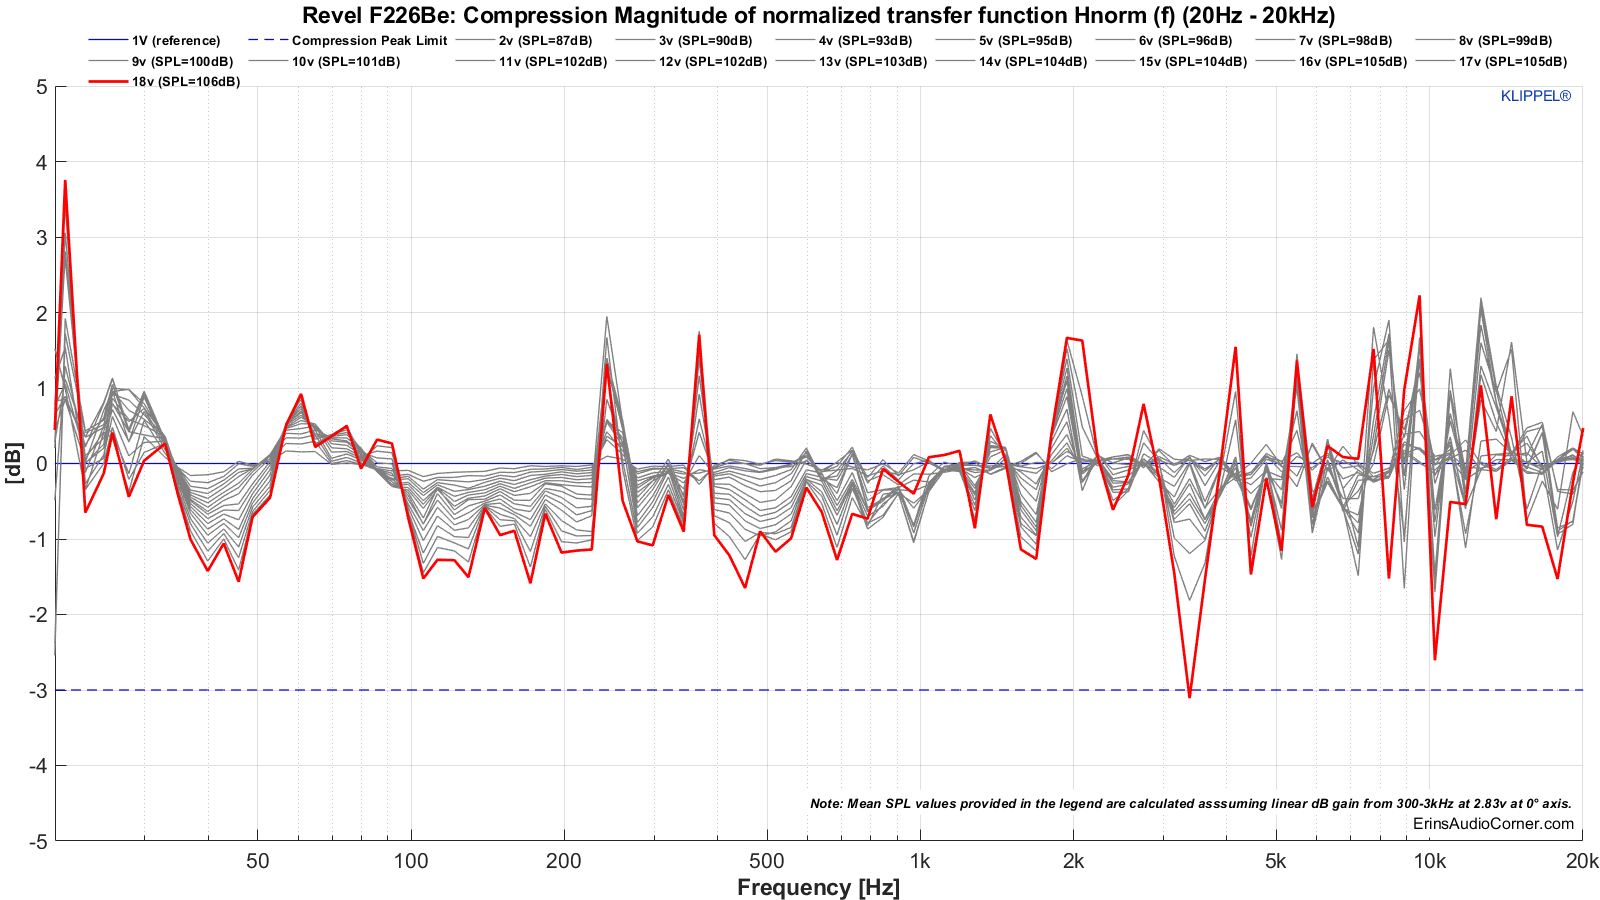
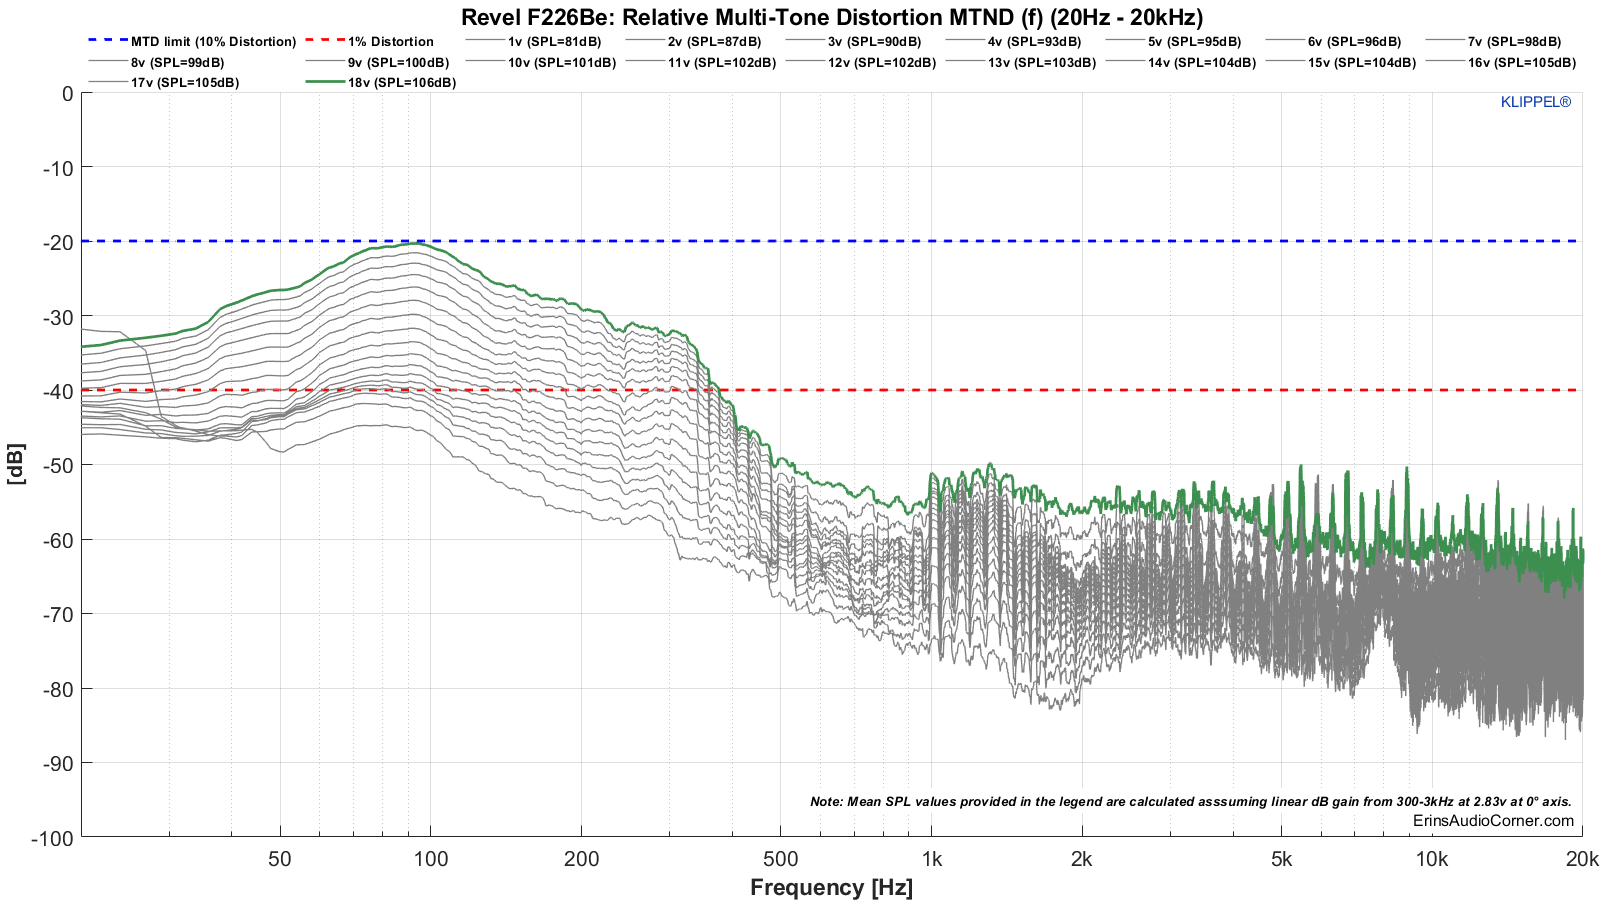
Test 1: 20Hz to 20kHz
Multitone compression testing. The red line shows the final measurement where either distortion and/or compression failed. The voltage just before this is used to help determine the maximum SPL.
Multitone distortion testing. The dashed blue line represents the -20dB (10% distortion) threshold for failure. The dashed red line is for reference and shows the 1% distortion mark (but has no bearing on pass/fail). The green line shows the final measurement where either distortion and/or compression failed. The voltage just before this is used to help determine the maximum SPL.
The above data can be summed up by looking at the tables above but is provided here again:
- Max SPL for 20Hz to 20kHz is approximately 106dB @ 1 meter. The compression threshold was exceeded above this SPL.
Extra Measurements:
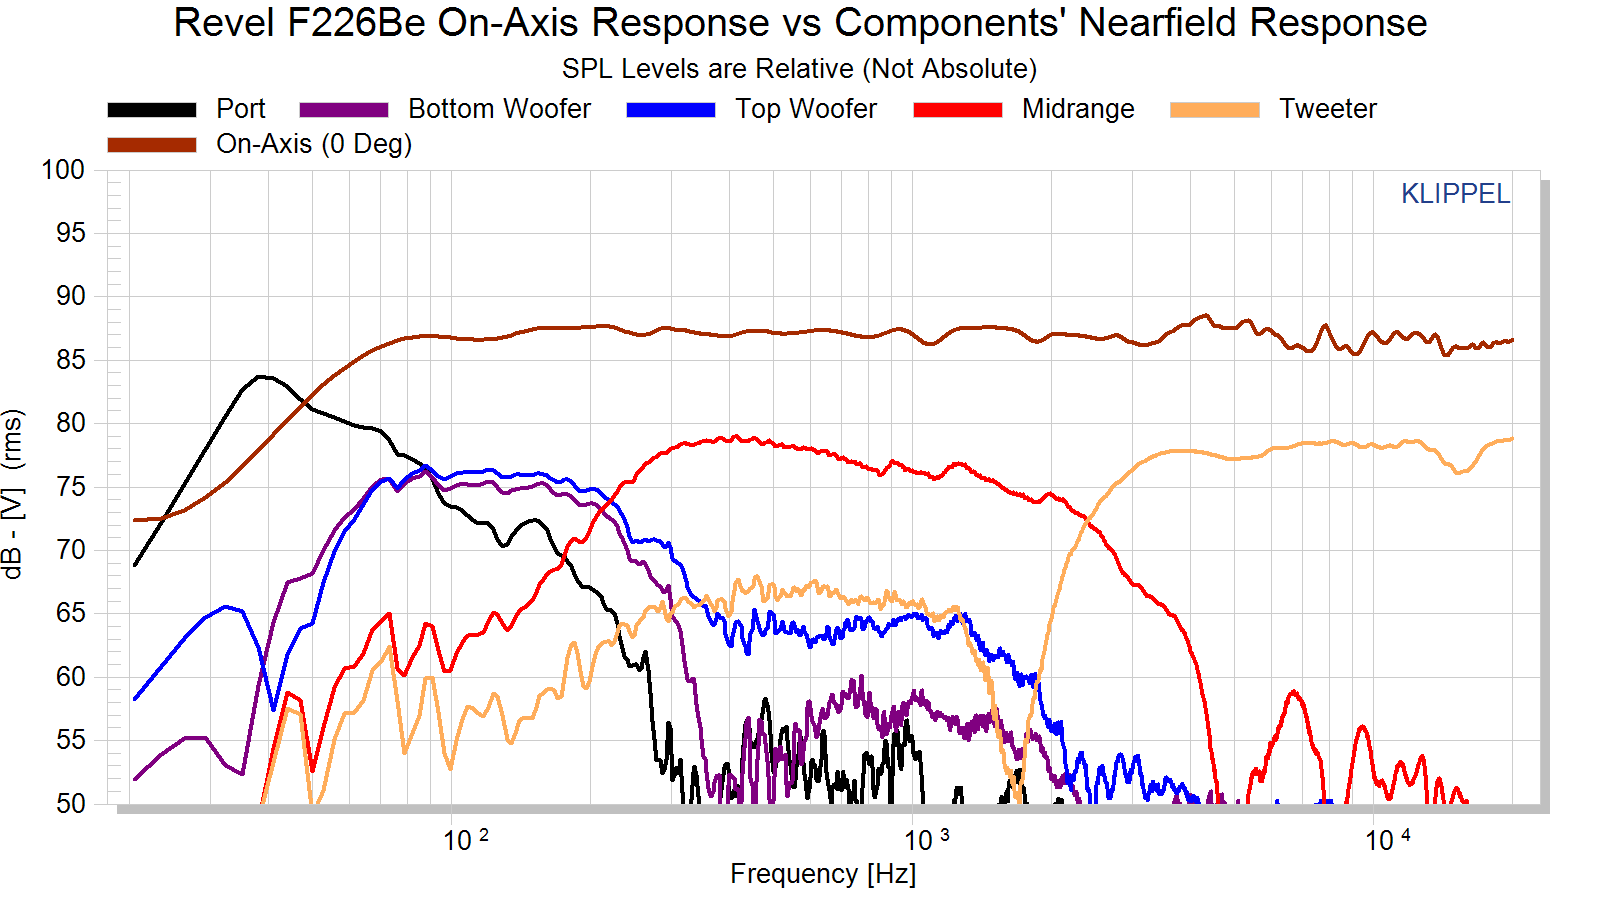
Nearfield measurements.
Mic placed about 0.50 inches - relative to the baffle - from each drive unit and port. While I tried to make these as accurate in SPL as I could, I cannot guarantee the relative levels are absolutely correct so I caution you to use this data as a guide but not representative of actual levels (measuring in the nearfield makes this hard as a couple millimeters’ difference between measurements can alter the SPL level).
The singular nearfield woofers’ results measure lower in level but remember, they will sum acoustically to be about 3dB higher which would match their combined SPL with that of the midrange. Therefore, the crossover would match the specified crossover region of about 260Hz.
The midrange to tweeter crossover is specified at 2.1kHz which is in-line with what the nearfield measurements would otherwise suggest.
Notice how there is no resonance in the nearfield measurements. Not from the drive units nor the port. It is not at all unusual to see port resonance or woofer resonance outside the crossover on lesser speakers; these issues tend to creep up as distortion (linear and non-linear) in the speaker evaluation. However, there is none of that observed in this speaker via the nearfield measurements. Revel states their use of Deep Ceramic Composite (DCC) Cone Midrange and Woofers “provide constrained layer damping that push cone breakup modes outside of the passband allowing the driver to maintain ideal pistonic motion throughout its range”. The below data backs that up.
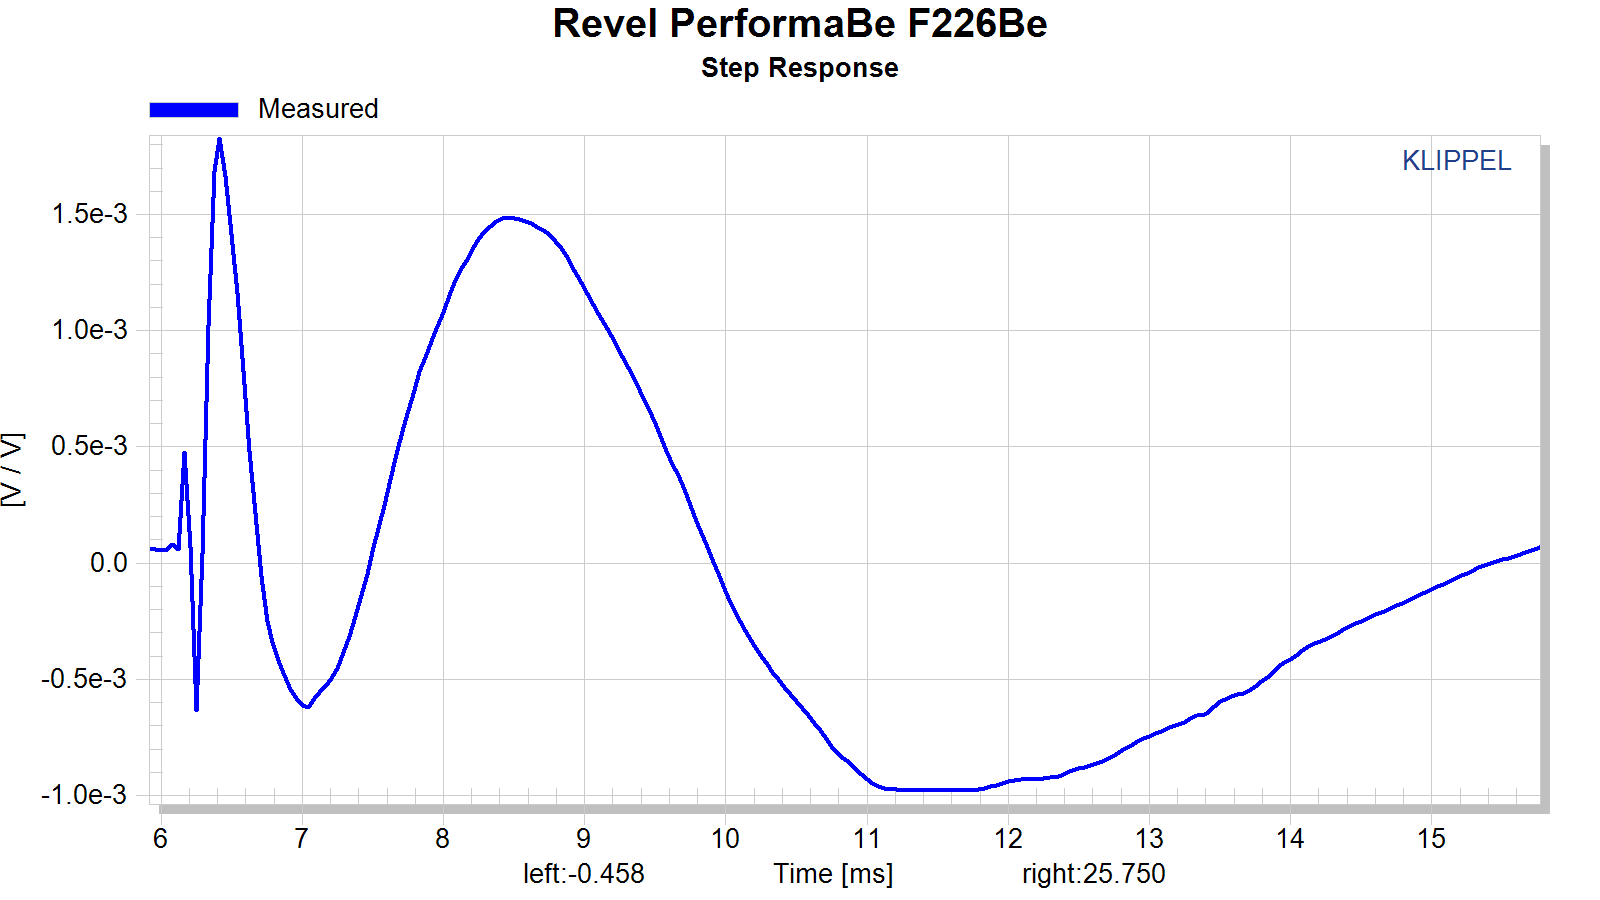
Step-Response.
Objective Data Analysis/Evaluation:
Frequency Response:
- The mean SPL, approximately 90dB at 2.83v/1m, is calculated over the frequency range of 300Hz to 3,000Hz.
- The on-axis frequency response is extremely linear, measuring within ±1.5dB above 65Hz.
- The speaker’s F3 point (the frequency at which the response has fallen 3dB relative to the calculated mean SPL) is 56Hz.
- The F10 (the frequency at which the response has fallen by 10dB relative to the mean SPL) is 36Hz.
- The nearfield responses show no out-of-band breakup modes that would cause issues in directivity matching or distortion artifacts.
Impedance/Amplifier Requirements:
- There are no signs of cabinet or drive-unit resonance (typically visible as bumps/wiggles in the impedance that deviate from the curve). The cabinet and drive units all seem to be problem-free in this regard.
- The tuning frequency of the enclosure is approximately 48Hz.
- The minimum impedance dips to about 3.7 Ohms around 200Hz and again at approximately 50Hz. While the specification states the nominal impedance is 8 Ohm, the data shows the midbass-to-low-midrange impedance is closer to an overall nominal impedance at about 4 Ohms. A standard AVR would not be recommend for powering these speakers. A separate amplifier is recommended to drive this speaker to typical playback volumes.
Distortion/Max SPL:
- At 90dB at 1 meter (which is equivalent to 78dB at 4 meters) the F226Be distortion levels are below 1% above 50Hz.
- At 104dB at 1 meter (which is equivalent to 92dB at 4 meters), the low frequency distortion increases but is still respectably low between 1-3% THD from 50Hz to 200Hz. Note: The F226Be is also the only speaker I have tested at this output level so far.
- The midrange distortion is remarkably low at approximately 0.30% THD at 104dB at 1 meter. The lowest I have tested so far.
- The max SPL measured is 106dB (mean) at 1 meter. So far, this is the highest max SPL achieved by any of my test subjects, besting the previous winner by about 2dB. Keep in mind that these speakers play louder than 106dB. The test setup and conditions are described in the appropriate section above. This simply gives me a way to provide an apples-to-apples comparison against other test subjects.
Dispersion and Off-Axis Response:
- Horizontal dispersion is approximately ±65° out to 10kHz and about ±50° out to 20kHz.
- Vertical dispersion is approximately ±80° out to 10kHz and about ±60 out to 20kHz°. This is the widest vertical dispersion I have measured to date.
- The wide horizontal and vertical dispersion help give this speaker a wider sweet spot, a larger soundstage and a more balanced tonality as there is no large shift in directivity through the crossover region thanks to the relatively steep crossover slopes implemented between drive units.
Spinorama and Predicted In-Room Response:
- The spinorama data indicates the listening window is quite linear and, in fact, smoother in the 4-6kHz region than the on-axis response. I’m not quite sure what causes the (mild) bump in response on-axis in this region. Possibly some mild horn loading of the tweeter from the waveguide? The other possibility is diffraction but the nearfield data still shows the mild bump which indicates it is based on the drive unit itself, rather than an effect of the cabinet. However, the spinorama data shows no signs of resonance here so I would not concern myself too much with this.
- There appears to be a resonance around 250Hz as evidenced by the dip in all the spinorama data. I intentionally listened for this later but didn’t find any apparent audible issues.
- The directivity index graphs (dashed lines) also show a very wide directivity speaker. Since we know the horizontal and vertical dispersion is wide, we can deduce that this will help create a larger sense of space in the soundstage (height, width, and depth).
- The early reflection data and directivity index shows a mild directivity mismatch right around 2.5kHz. Judging by the “Vertical Spectrogram Normalized to On-Axis Response” plot, this shift in directivity appears to be due to the off-axis vertical response with respect to the on-axis vertical response.
Subjective Evaluation:
Now that we have gotten through all the data, let’s talk about what I heard!
I listen to speakers in two different rooms: my home theater room and my living room. I have provided a layout of the home theater below. And below that is a picture of the speakers set up in my living room. This gives you an idea of the actual environments these were auditioned in.
Home Theater layout:
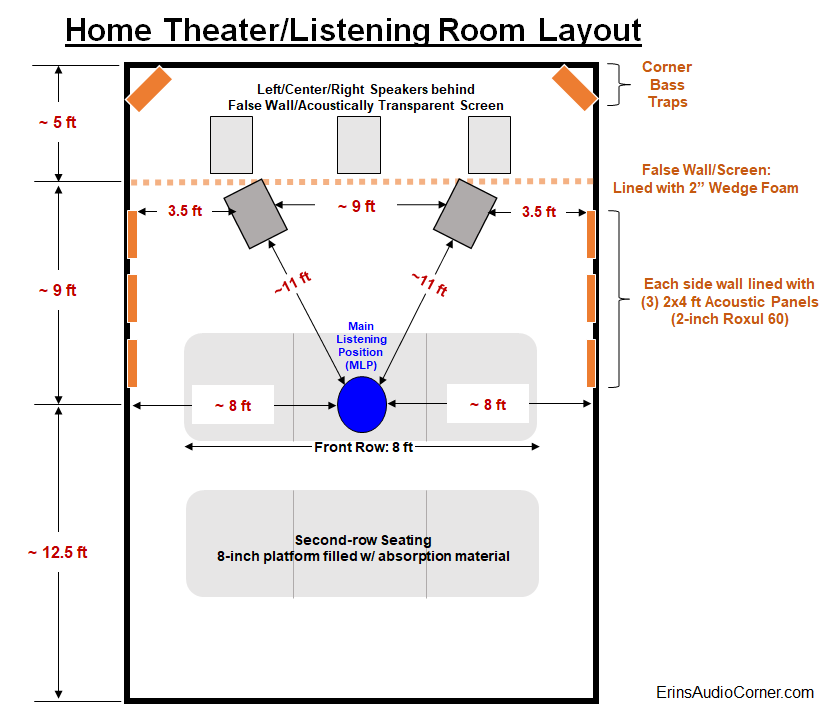
Per the illustration, I built a false wall and used an acoustically transparent screen with speakers behind it. The wall is only 2x4's; no panels of wood or anything. Just a skeleton of a wall to give me something to attach the screen and acoustic treatment to. There is 2-inch wedge foam affixed to the 2x4 studs and between the false wall and back of the room are the front speakers (L/C/R & 18-inch subwoofers).
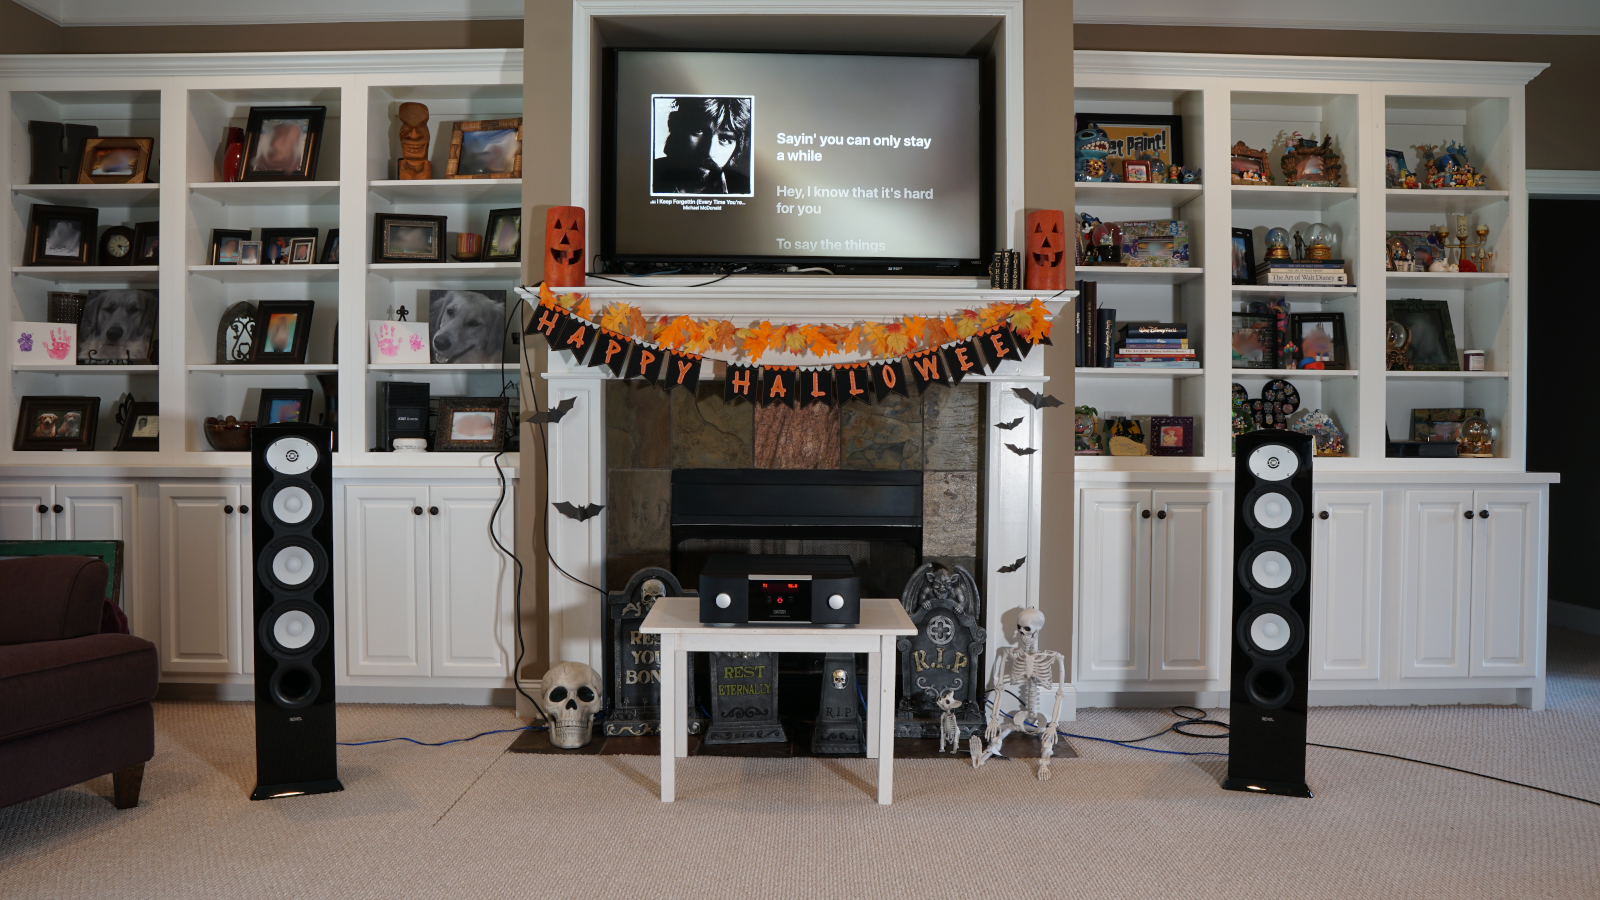
Living Room setup:
Happy Halloween!!!!
Subjective Analysis Setup:
- The speaker was aimed on-axis with the vertical listening axis on the tweeter axis.
- I used Room EQ Wizard (REW) and my calibrated MiniDSP UMIK-1 to get the volume at the seated position between 85-90dB on average. In a poll I found most listen to music in this range. Though, I often listened at higher and lower volumes.
- All speakers are provided a relatively high level of Pseudo Pink-Noise for a day or two - with breaks in between - in order to calm any “break-in” concerns.
- I demoed these speakers without a crossover. I did try using Dirac Live at one point, which I will discuss.
- Components: Oppo BDP-103, AppleTV 4k, and Levinson № 5805 integrated amplifier.
I initially listened to these speakers and made my subjective notes before I started measuring objectively. I did not want my knowledge of the measurements to influence my subjective opinion. This is important because I want to try to correlate the objective data with what I hear in my listening space in order to determine the validity of the measurement process. I try to do a few listening sessions over a couple days so I can give my ears a break and come back “fresh”.
My demo music:
I auditioned these speakers numerous times over the span of a few weeks. While the list below is my primary auditioning music, I ultimately listened to many, many more tracks spanning various genres.
| Title | Artist | Album |
|---|---|---|
| Enjoy The Silence | Depeche Mode | Best Of Depeche Mode, Vol. 1 |
| Higher Love | Steve Winwood | Back In The High Life (MFSL UDCD-611) |
| 24K Magic | Bruno Mars | 24K Magic |
| Magic | The Cars | Heartbeat City (MFSL) |
| Everlasting Love | Howard Jones | The Best of Howard Jones |
| Kodachrome | Paul Simon | There Goes Rhymin’ Simon |
| Everybody Wants To Rule The World | Tears for Fears | Songs from the Big Chair (2014 Deluxe Edition - Disc 1) |
| Know Your Enemy | Rage Against The Machine | Rage Against The Machine (Hybrid SACD) |
| Doo Wop (That Thing) | Lauryn Hill | The Miseducation of Lauryn Hill |
| Tell Yer Mama | Norah Jones | The Fall |
| Don’t Save Me | HAIM | Days Are Gone |
| He Mele No Lilo | Mark Keali’i Ho’omalu and Kamehameha Schools Children’s Chorus | Lilo And Stitch |
| Wrapped Around Your Finger | The Police | Synchronicity |
| Sledgehammer | Peter Gabriel | So |
| Feel It Still | Portugal. The Man | Woodstock |
| Free Fallin | John Mayer | Where The Light Is |
| Whiplash | The Swampers | Muscle Shoals Has Got The Swampers |
Note: I don’t generally audition speakers with the typical “audiophile” music. I have a copious amount of high-quality albums ranging from pop to metal to jazz and all around. I don’t typically listen to “audiophile” music because I just don’t enjoy it, personally. It is far more important that your evaluation music be something you are familiar with than it is to be esoteric for the sake of being esoteric. You also want to listen to music you enjoy because auditioning a stereo system shouldn’t feel like a chore. Besides, my subjective evaluation is purely to help tie to the objective data and make sense of what I am hearing to help you all get an understanding of how relevant the data is.
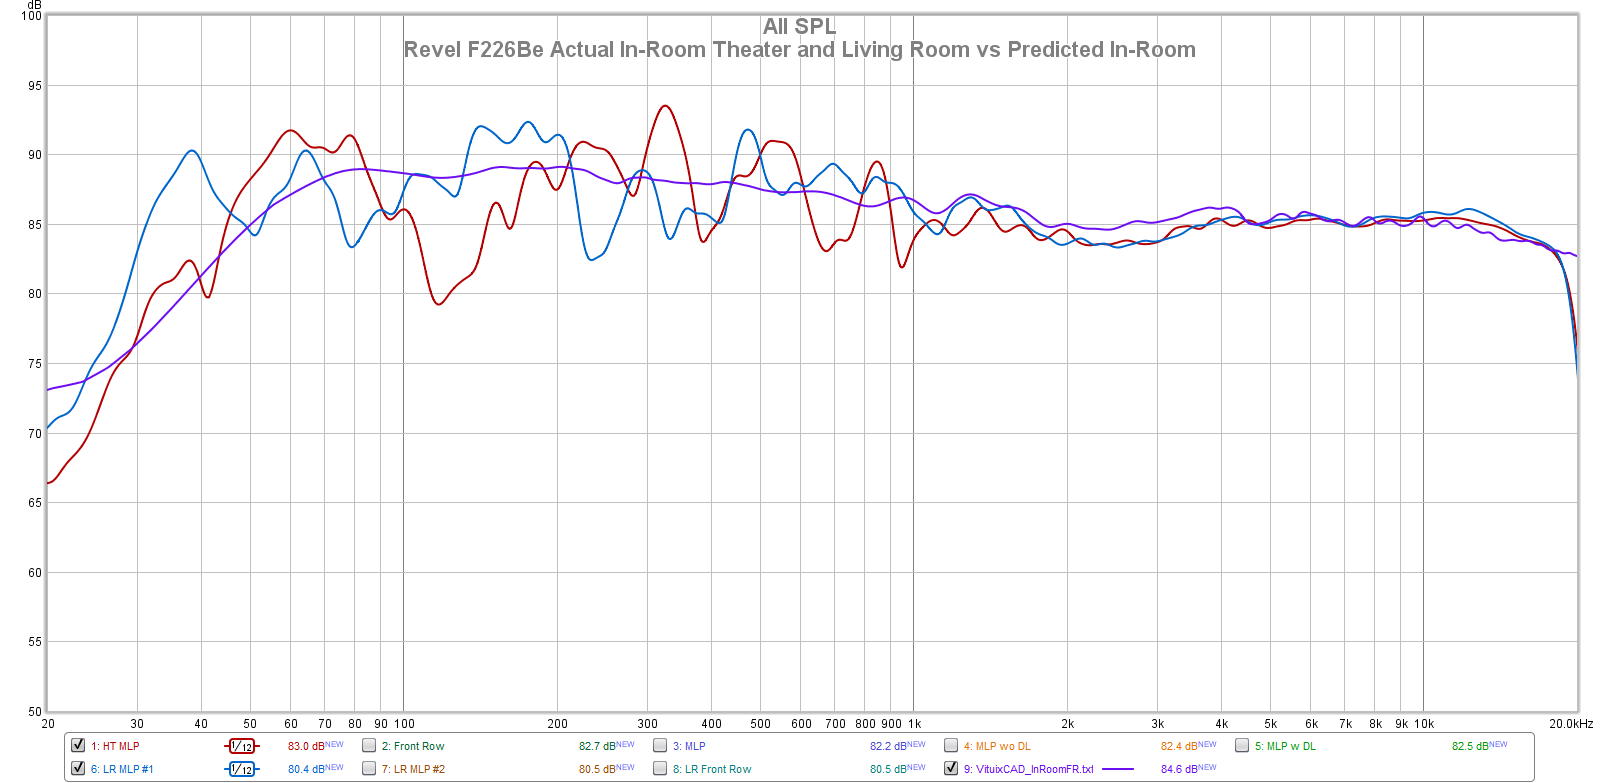
Below is the measured in-room response at the main listening position (MLP) of my Home Theater (HT) in red and my Living Room (LR) in blue both compared against the predicted in-room response (purple). These were taken via the moving microphone average, covering the space of about 1 cubic foot in the MLP. The measurements/prediction below do not have EQ applied.
You can see the prediction follows pretty reasonably to what is measured in the seated position in both rooms, aside from the typical lower frequency modal issues caused by the rooms themselves. Two completely different listening setups yielded a similar response that both match the predicted in-room response borne from the spinorama data. This proves that the anechoic data and means to provide a predicted room response result in a very accurate prediction.
Here are my key notes and takeaways from my audition:
- The F226Be is the epitome of “neutral”. There are no areas that stand out in the response spectrum as “bright”, “dull”, or those other audiophile terms that are often used to describe critiques or negative characteristics of a loudspeaker. The F226Be is extremely linear in response both on and off-axis per the data and what you hear is exactly that; a very neutral speaker that provides a very good rendition of what is on the media itself. Neither adding to or taking away from what was intended for the listener to hear in any appreciable manner.
- The F226Be sounds better in my living room where there is no acoustic absorption than it does in my home theater. Two possible reasons are: 1) My home theater is “too dead” for these speakers (remember, I have a false wall and sidewalls lined with absorption panels) or 2) The physical distance of the side wall to the speakers being much wider helps. If I were to own the F226Be I would have to put them in my home theater but I would absolutely try them without my broadband absorption panels first. I recommend you take the time to experiment with this in your own listening room to find the balance between absorption vs the sound you are trying to achieve.
- Using Dirac Live in my home theater resulted in poorer performance. I ran DL full range which corrected response from 20Hz to 20kHz. I believe, in the case of these speakers, it is best if DL is kept to a minimal passband (below Schroeder frequency).
- 10° off-axis seems to be a good compromise between enhanced soundstage while not corrupting imaging accuracy.
- While the stereo image shifts as you move out of the “sweet spot”, the tonality is largely unaffected. You are simply left with time delay differences from moving out of the sweet spot.
- Along those lines, sitting on the side of my couch in my living room - putting me directly in front of the right speaker - while watching TV resulted in the ‘appearance’ of a center channel (but the stereo effect would not be there without the visual cue; so not recommended for listening to music like this, obviously).
- These speakers are completely resonant free (at least, audibly). The enclosures do not resonate. The woofers and port do not call attention to themselves at high output. Even at 105dB at 14 feet listening to “24K Magic” by Bruno Mars there was no mechanical buzzing, pops, etc that I have experienced with other speakers at lower output levels.
- Low frequency distortion does measure higher than midrange distortion but is not audible to my ears even at extreme output levels.
- This speaker excels in low level dynamics; perfect for “conversation level” listening (65-75dB) but can easily reach 100dB at 12 feet without compression effects or audible distortion. Many audiophiles equate “loud” with dynamic. This is incorrect. A true hi-fi speaker should be able to produce attack/dynamics even at low volumes and the F226Be does that exceptionally well.
- Upper-midrange and low-treble detail is incredible. In Blind Melon’s “No Rain”, the finger snaps have texture to them; you can hear the resistance of skin in the finger snaps.
- I was listening to Robyn’s “Always Be Around” and I was hearing a low-frequency tone. I am used to hearing loud 4x4 trucks driving up the road from me and I thought maybe that was it. But it persisted for a bit too long. So, I paused the music and the noise went away. Turned the music back on and it was there. Apparently, this song has a very low level, low-to-mid frequency tone that sits in the pocket of the groove that I had never heard before. I attribute that to the low level dynamics of this speaker.
- Upper treble has a very nice appeal. Many tweeters tend to ride the line of “too bright” which gives them the appearance of upper frequency detail. Sometimes that results in slight sibilance and, frankly, can be tricky to discern if you’re hearing detail or brightness. The F226Be tweeters are a pleasant departure from that typical dome tweeter characteristic. The Beryllium dome tweeters do an incredible job of presenting sounds that are “sharp” (when the music calls for it) but not bright at all. There is micro-detail (fun buzz word) in the upper frequency that I really appreciated hearing.
- Steve Winwood’s “Higher Love” - The rolling drum (programmed drum?) that starts the track on the left is well controlled; not boomy as I sometimes hear from other speakers. Nile Rodgers’ rhythm guitar is centered as it should be and well controlled while most speakers I have demoed tend to accentuate this a bit too much and result in a blossoming/resonant body to the sound. The snare has an excellent ‘paper sound’ timbre to it. Cymbal crash has an air that I can almost visualize the sound scattering. This is a very 3-dimensional song that is quite hard for many speakers to convey proportionately while maintaining the correct timbre throughout due to the complexity of the drum tracks (live and synthesized) and the combination of both Steve Winwood and Chaka Khan’s vocals layered toward the end of the track. The F226Be nails this track as perfectly as I could hope a speaker would.
- Madonna’s “Borderline” opens with a xylophone and instantly takes me back to the days of riding around with my mom in her car listening to 80’s pop radio. While this is not an ‘audiophile’ song to some, this is a classic song for me to fire up and go down memory lane (like so many of my other favorites). I have heard this song countless times over my … ahem… 38 … years on this Earth. When I listened to this song on the Revel F226Be I had to rewind it and listen to the intro a few more times. Even though the xylophone is in the percussion family, the term “percussion” - to me - is analogous to frequencies below 300Hz. That’s not the definition, of course. I’m just relaying my thoughts when I hear or see that word. Along those lines, the xylophone in this track has never had any sort of ‘bass’ sound. No pressure; either in the sense of bass or just the sound of a slight force. But, with these speakers, I could hear the actual percussive nature of the xylophone. Imagine someone saying the word “pressure”. The “p” have that forceful sound to it. It’s hard to put in to words but that’s how the xylophone in this track sounded to me. And it was an awesome experience. I’ll always be listening for other speakers to do that same thing.
- The width of the soundstage of the F226Be is practically as wide as the room. With the understanding that the room’s sidewalls always act as additional point sources (sources of sound) themselves and can either help or hurt the sound, these speakers had no problem creating a soundstage as wide as 5 feet beyond their physical location while not marring the image/focus. Pay attention to the italicized. I notice many get so caught up in the width of soundstage they often forget to understand the tradeoffs of lesser speakers; speakers with poor directivity control where the reflections from the sidewalls are nowhere near the same sound that hits the sidewalls and reflected back to the listener, resulting in a hodgepodge of interfering sounds arriving at the listener’s ears. This results in a loss of focus of instruments placed on the soundstage, diffusion of a vocalist and ambiguity to the overall sound of the music you are listening. A well designed speaker with directivity control far off-axis helps not only provide a large sense of space in the soundstage but does so without detriment to the focus and imaging. The F226Be is that kind of speaker.
Bottom Line
In my experience, the Revel PerformaBe F226Be is a “jack of all trades” speaker. It can fill the role of background music when you are having a conversation or when you’ve got Motley Crue cranked up while you rush to clean the house before your significant other gets home from work. It wears the glass slipper of upper echelon audiophile-enjoyment with ease. It plays at low volume levels and high volume levels while providing the same sense of enjoyment and involvement thanks to its ability to provide low level dynamics. It was a true treat to be able to listen to my music collection at a more reasonable volume, resulting in no ear fatigue over the span of hours. As opposed to feeling the need to turn up the volume to get some of those “dynamics” (i.e., bass impact) thus causing ear fatigue 20 to 30 minutes in to my listening session. I … revel’ed … in this luxury. (I wouldn’t resist the pun)
Oh, and if you are wondering if this plays (insert your favorite genre of music here) well, the answer is: yes. It’s not a one-trick pony. No speaker should be. Unfortunately, some speakers are.
While I certainly enjoyed this speaker in my home theater for tunes and movie watching, the F226Be is, in my opinion, the perfect size for a floorstanding speaker in a living room as well. It isn’t so large as to consume the living space like a larger speaker (for example, the bigger brother F328Be), even once you have set it out from the walls. It also isn’t so skinny to not look like a worthy adversary in the bass department. And, let’s face it, there is a lot of psychoacoustics-related expectation versus actual performance when you are sitting and looking at a speaker. This speaker does a great job of checking the aesthetics, form and function boxes.
To be honest, I have tried quite hard to find faults in this speaker. It is much easier for me to do that and correlate the subjective “bad” with objectively bad data. That is why most of my reviews have been quite easy to write; because I could find at least a few negatives about some otherwise great speakers. But for all my efforts, I couldn’t find a single complaint with the F226Be. Sure, it would be great if it extended down to 20Hz with authority. But realistically, a speaker capable of that would be much larger than this one and I’d still likely use separate subwoofers just to help spread the load not only mechanically speaking but acoustically as well. A room benefits from multiple subwoofers acoustically. On the topic of bass, while I did not hear any strain from this speaker when pushing it to high output levels without a crossover, the fact is it does roll off below 50Hz and a subwoofer is recommended. My in-room response showed further lower frequency extension than this. I used a 12-inch subwoofer to help fill in below 50Hz and was incredibly happy with the results. Therefore, if I were to own this speaker, I would purchase a subwoofer to complement the low end for the above mentioned reasons.
Bottom line: If you have the means, I cannot recommend this speaker enough. I can’t find any faults in my listening evaluations. It is a perfect size. It looks incredible. It sounds awesome. I would love to own it myself.
Support the Cause
If you like what you see here and want to help support the cause you might be interested in joining my Patreon, here. You can also contribute via PayPal (the big yellow button below).
Your support helps me pay for new items to test, hardware, miscellaneous items and costs of the site’s server space and bandwidth. All of which I otherwise pay out of pocket. So, if you can help chip in a few bucks, know that it is very much appreciated.
You can also join my Facebook and YouTube pages if you’d like to follow along with updates.