Foreword / YouTube Video Review
I was loaned these from the manufacturer. I was not paid nor did I receive any other form of compensation for this review.
All my reviews are done on my own time with great care to give you all the best set of data and information I can provide in order to help you make a well-informed purchase decision. I offer this for free to all who are interested. In return, if you want to support this site please see the bottom of this review for ways you can help. It is greatly appreciated.
The review on this website is a brief overview and summary of the objective performance of this speaker. It is not intended to be a deep dive. Moreso, this is information for those who prefer “just the facts” and prefer to have the data without the filler. The video below has more discussion with respect to the technical merits and subjective notes I had during my listening sessions.
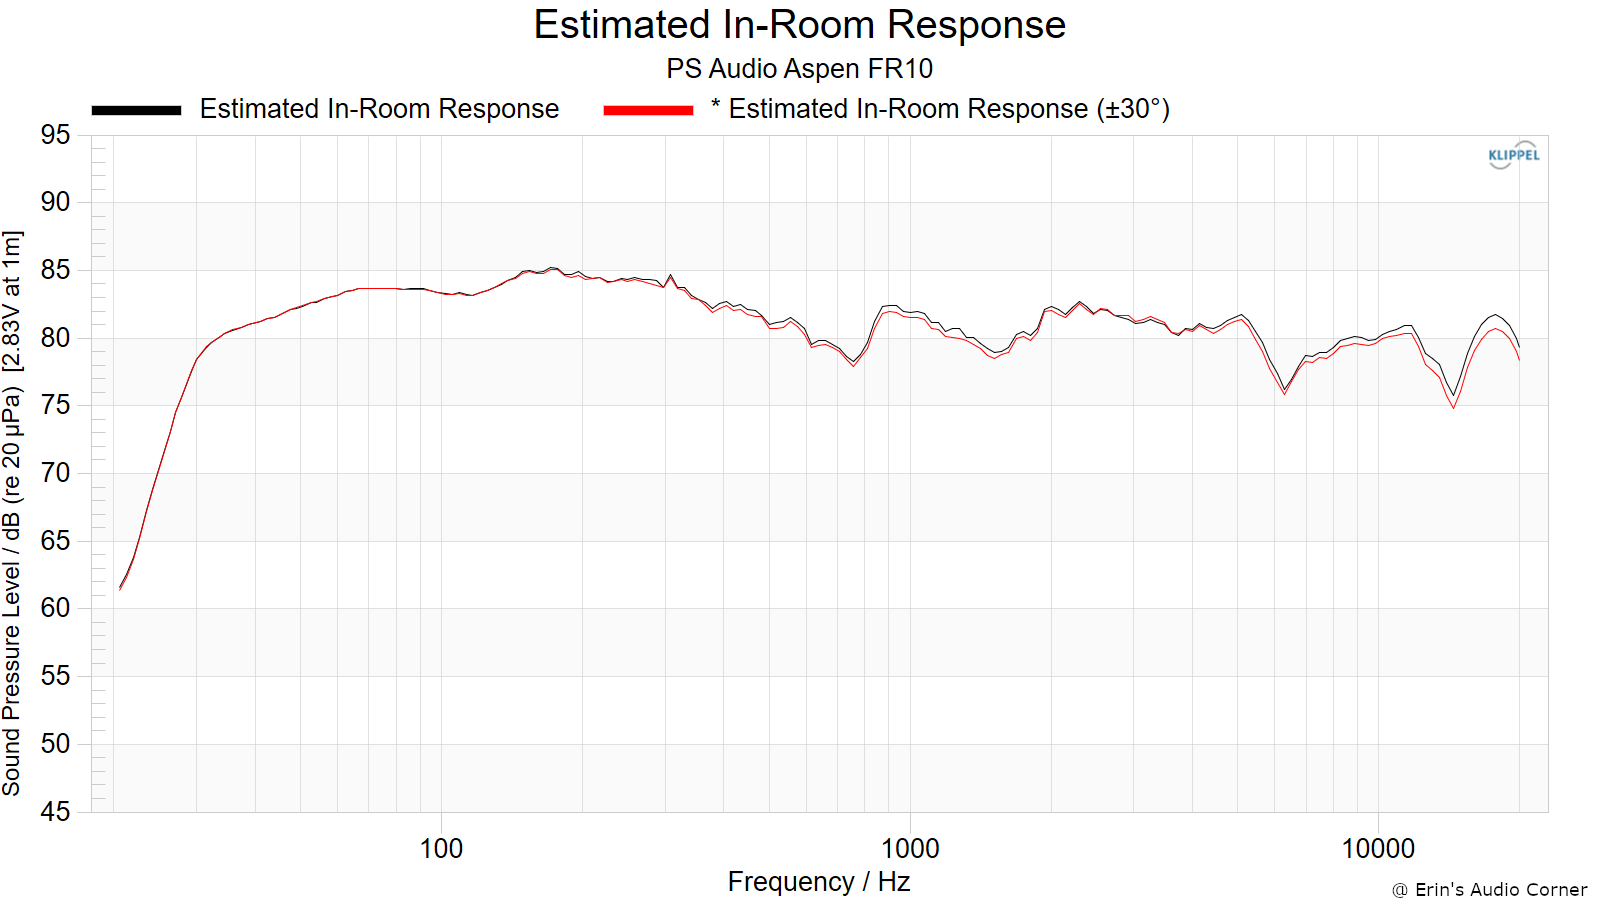
- Color Options Satin White, Satin Black
- Enclosure Type Passive radiator (three 6x9” oval rear-firing)
- High Frequency Transducer 2.5” planar magnetic with Teonex diaphragm
- Mid Frequency Transducer 8” planar magnetic with Teonex diaphragm
- Low Frequency Transducer 2 x 6.5” woofers, cast frame, non-woven carbon fiber PMI foam sandwich cone, advanced magnet structure
- Crossover Frequency 550 Hz, 1750 Hz - Linkwitz-Riley 4th order acoustic
- Sensitivity (2.83V @ 1M) 86.5 dB
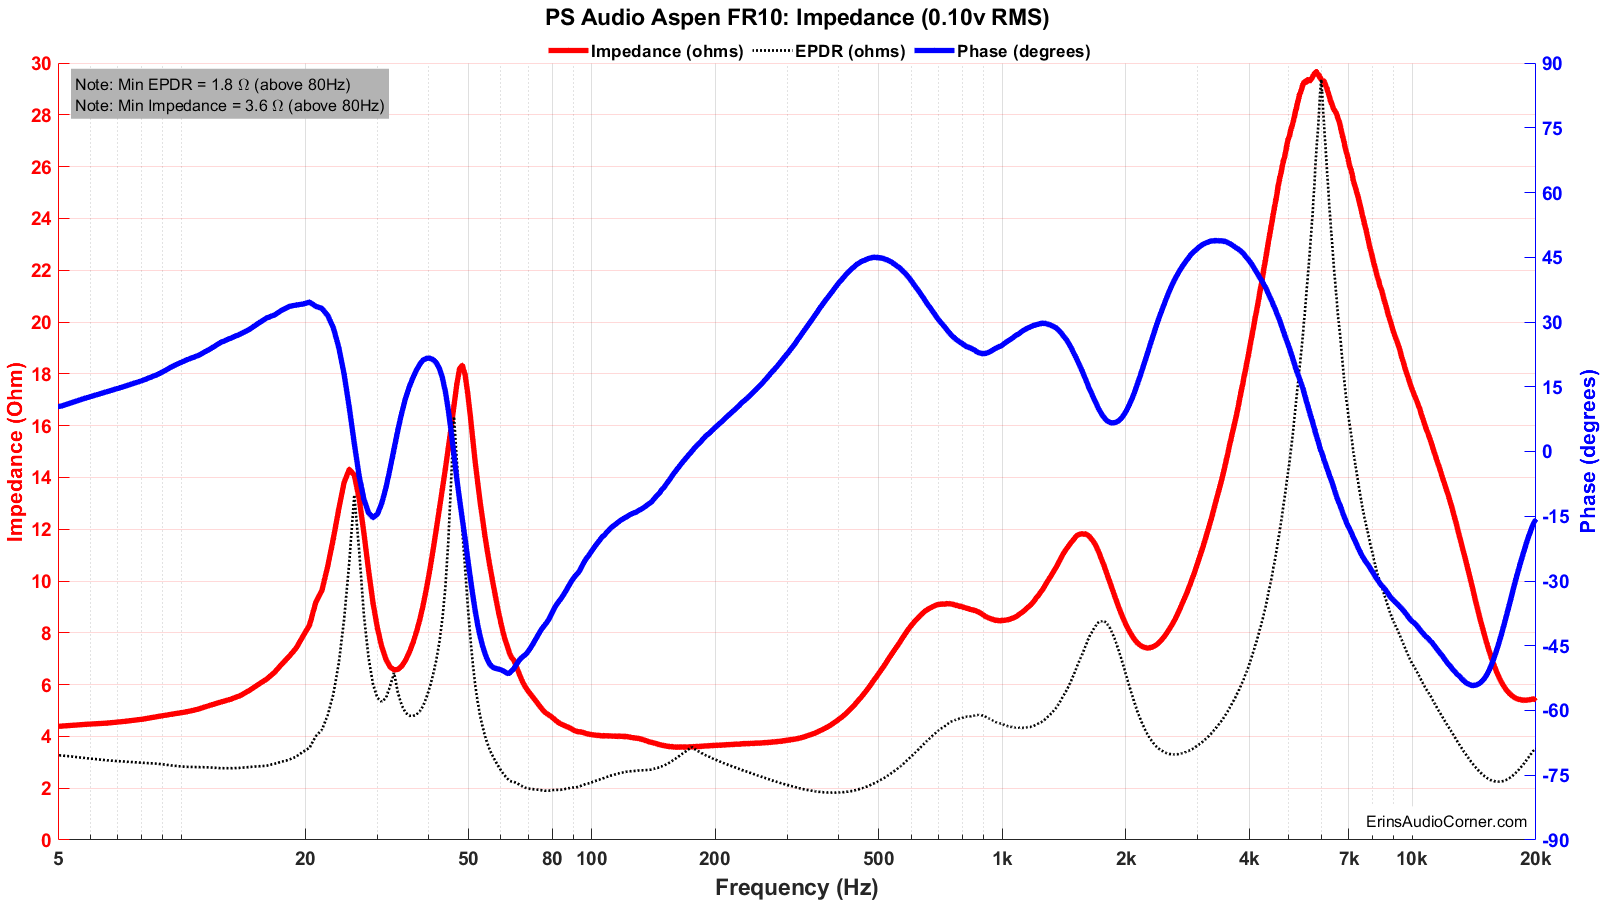
- Nominal Impedance 4 ohm (3.3 ohm minimum impedance)
- Recommended Amplifier Power 50-200W
- Frequency Response 32 Hz-20 kHz (-6dB) half space, 25 Hz (-6 dB) in-room
- Dimensions (HxWxD)
- 41.5” x 11.75” x 16.25” with base (8” width not including base)
- Net Weight 75 lbs (34.1 kg)
As of this writeup MSRP is approximately $10,000/pair.
CTA-2034 (SPINORAMA) and Accompanying Data
All data collected using Klippel’s Near-Field Scanner. The Near-Field-Scanner 3D (NFS) offers a fully automated acoustic measurement of direct sound radiated from the source under test. The radiated sound is determined in any desired distance and angle in the 3D space outside the scanning surface. Directivity, sound power, SPL response and many more key figures are obtained for any kind of loudspeaker and audio system in near field applications (e.g. studio monitors, mobile devices) as well as far field applications (e.g. professional audio systems). Utilizing a minimum of measurement points, a comprehensive data set is generated containing the loudspeaker’s high resolution, free field sound radiation in the near and far field. For a detailed explanation of how the NFS works and the science behind it, please watch the below discussion with designer Christian Bellmann:
IMPORTANT SETUP INFO:
This speaker was measured with the reference point at the tweeeter. Speaker was broken in. No grilles were used in this testing.
Measurements are provided in a format in accordance with the Standard Method of Measurement for In-Home Loudspeakers (ANSI/CTA-2034-A R-2020). For more information, please see this link.
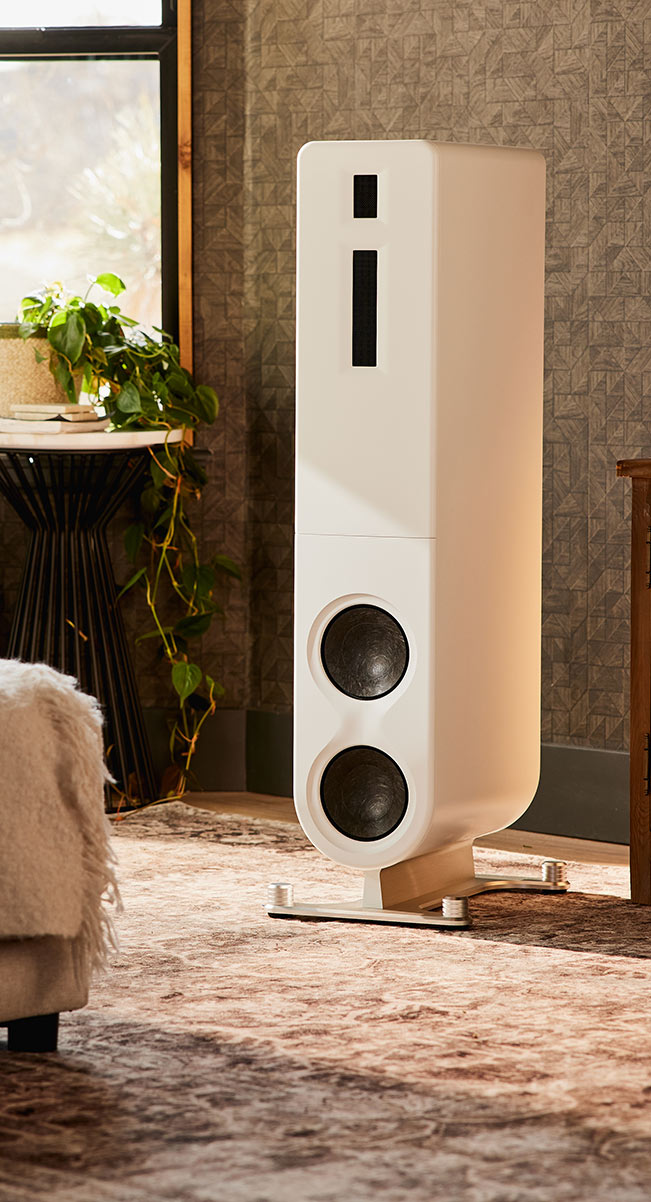
CTA-2034 / SPINORAMA:
The On-axis Frequency Response (0°) is the universal starting point and in many situations it is a fair representation of the first sound to arrive at a listener’s ears.
The Listening Window is a spatial average of the nine amplitude responses in the ±10º vertical and ±30º horizontal angular range. This encompasses those listeners who sit within a typical home theater audience, as well as those who disregard the normal rules when listening alone.
The Early Reflections curve is an estimate of all single-bounce, first-reflections, in a typical listening room.
Sound Power represents all of the sounds arriving at the listening position after any number of reflections from any direction. It is the weighted rms average of all 70 measurements, with individual measurements weighted according to the portion of the spherical surface that they represent.
Sound Power Directivity Index (SPDI): In this standard the SPDI is defined as the difference between the listening window curve and the sound power curve.
Early Reflections Directivity Index (EPDI): is defined as the difference between the listening window curve and the early reflections curve. In small rooms, early reflections figure prominently in what is measured and heard in the room so this curve may provide insights into potential sound quality.
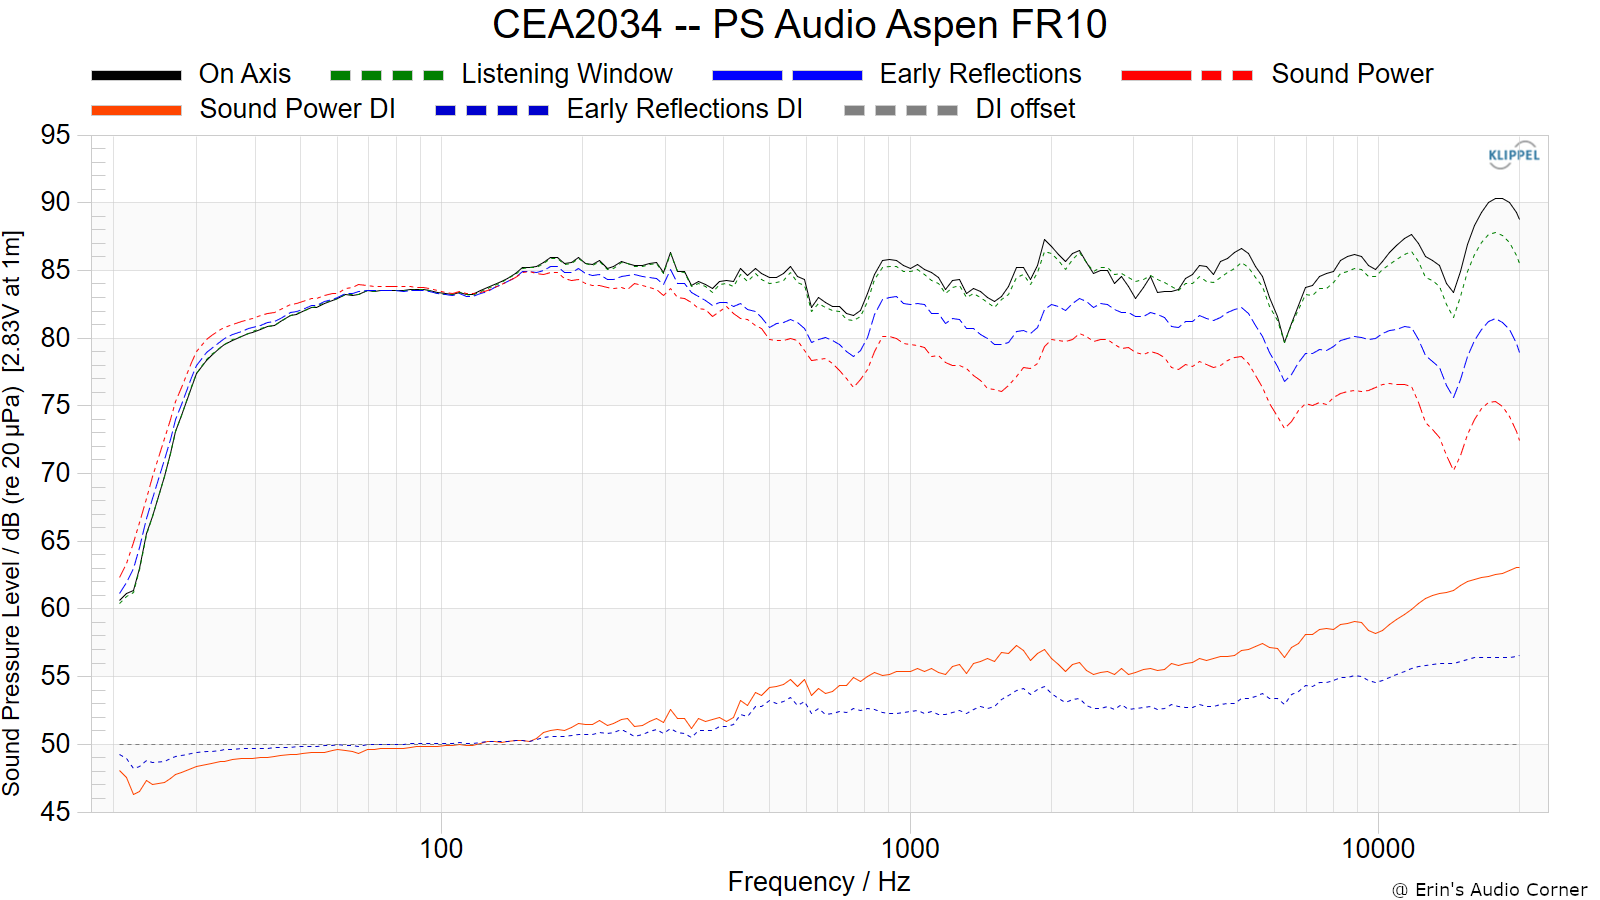
Early Reflections Breakout:
Floor bounce: average of 20º, 30º, 40º down
Ceiling bounce: average of 40º, 50º, 60º up
Front wall bounce: average of 0º, ± 10º, ± 20º, ± 30º horizontal
Side wall bounces: average of ± 40º, ± 50º, ± 60º, ± 70º, ± 80º horizontal
Rear wall bounces: average of 180º, ± 90º horizontal
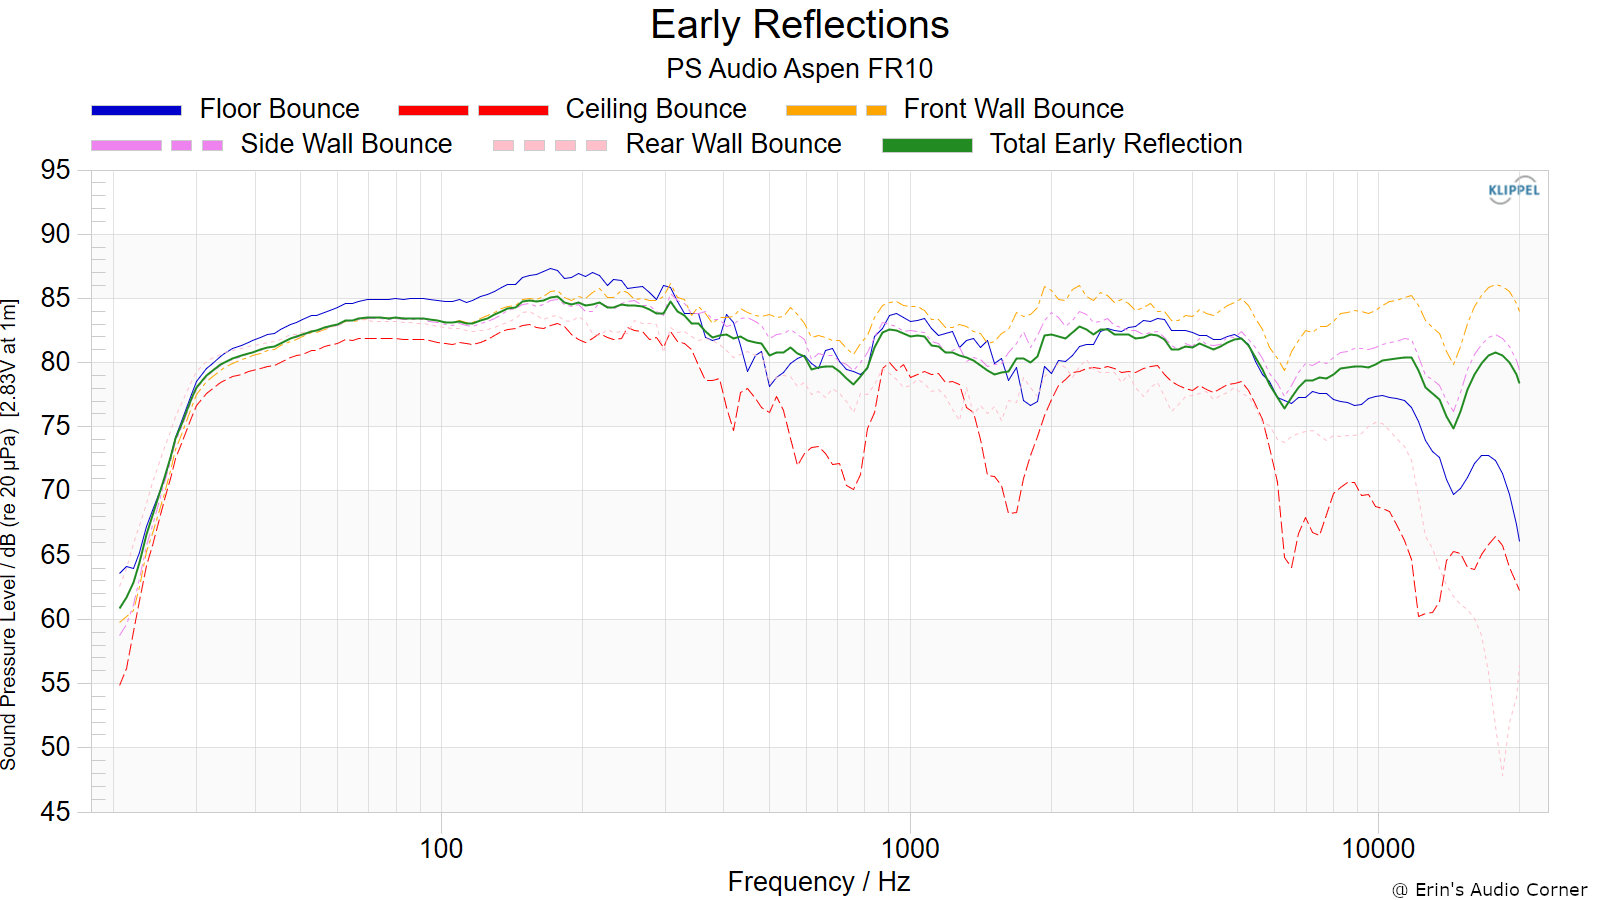
Estimated In-Room Response:
In theory, with complete 360-degree anechoic data on a loudspeaker and sufficient acoustical and geometrical data on the listening room and its layout it would be possible to estimate with good precision what would be measured by an omnidirectional microphone located in the listening area of that room. By making some simplifying assumptions about the listening space, the data set described above permits a usefully accurate preview of how a given loudspeaker might perform in a typical domestic listening room. Obviously, there are no guarantees, because individual rooms can be acoustically aberrant. Sometimes rooms are excessively reflective (“live”) as happens in certain hot, humid climates, with certain styles of interior décor and in under-furnished rooms. Sometimes rooms are excessively “dead” as in other styles of décor and in some custom home theaters where acoustical treatment has been used excessively. This form of post processing is offered only as an estimate of what might happen in a domestic living space with carpet on the floor and a “normal” amount of seating, drapes and cabinetry.
For these limited circumstances it has been found that a usefully accurate Predicted In-Room (PIR) amplitude response, also known as a “room curve” is obtained by a weighted average consisting of 12 % listening window, 44 % early reflections and 44 % sound power. At very high frequencies errors can creep in because of excessive absorption, microphone directivity, and room geometry. These discrepancies are not considered to be of great importance.
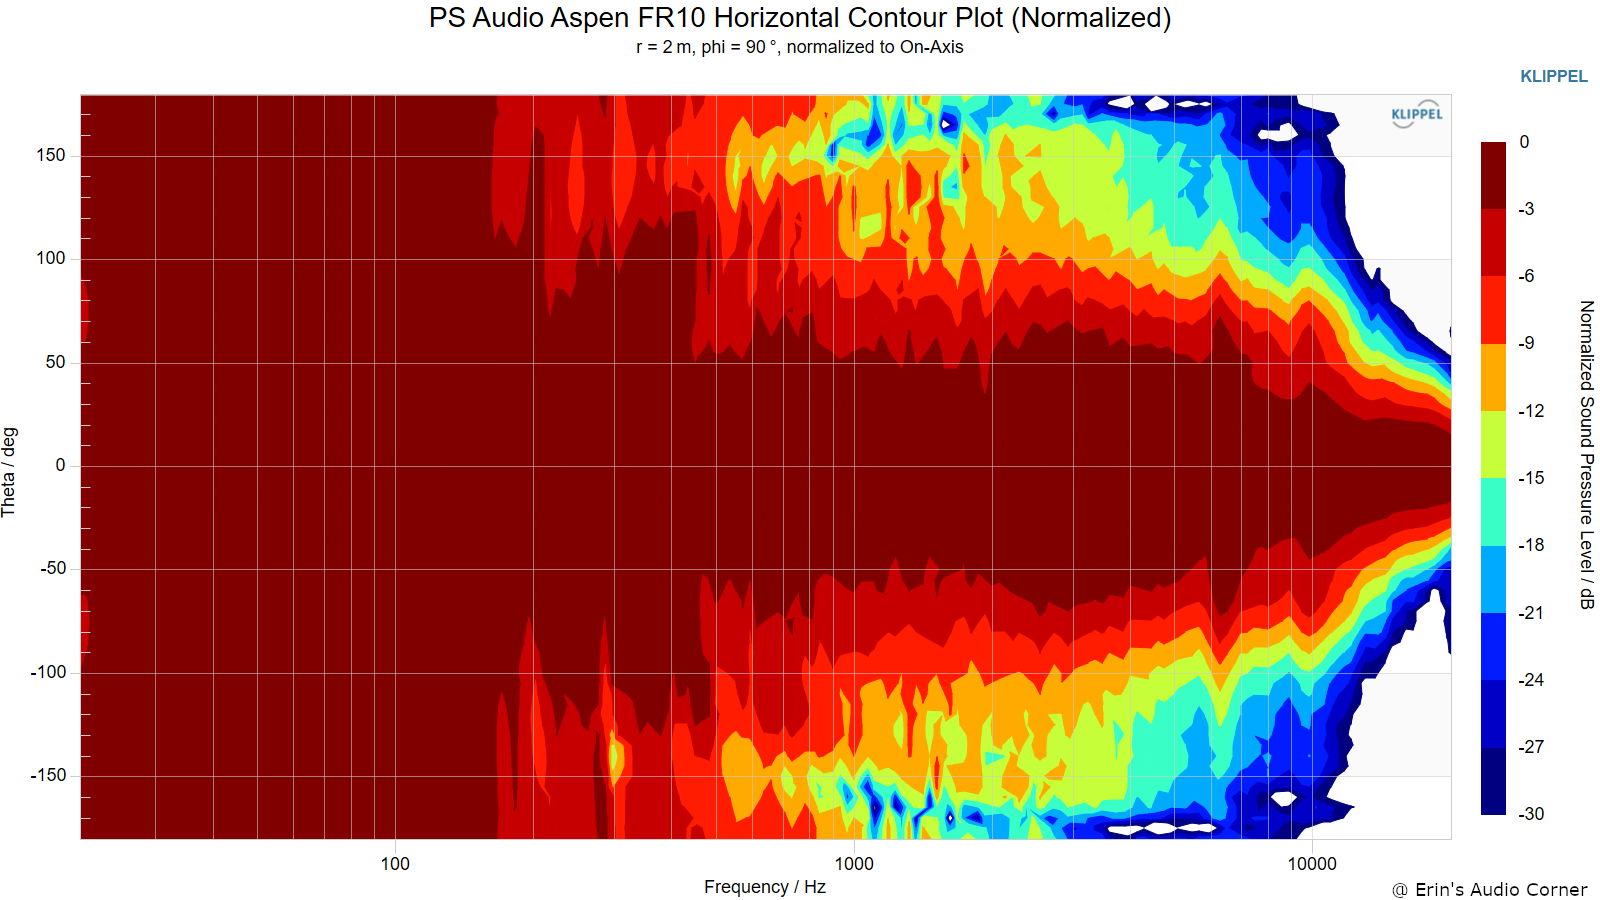
Horizontal Contour Plot (normalized):
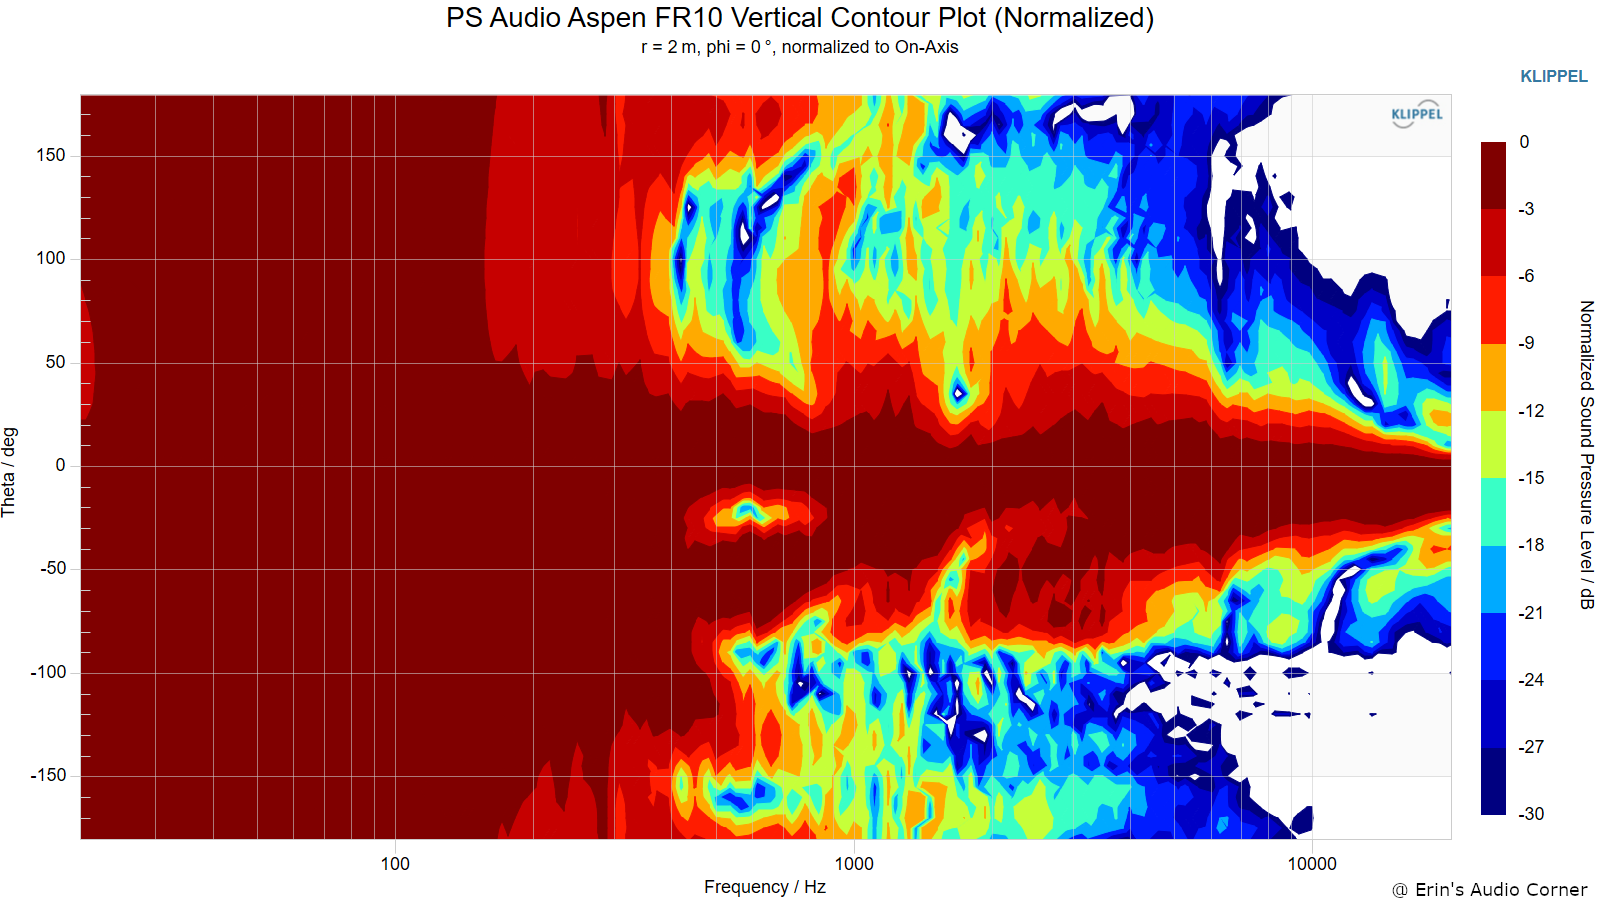
Vertical Contour Plot (normalized):
“Globe” Plots
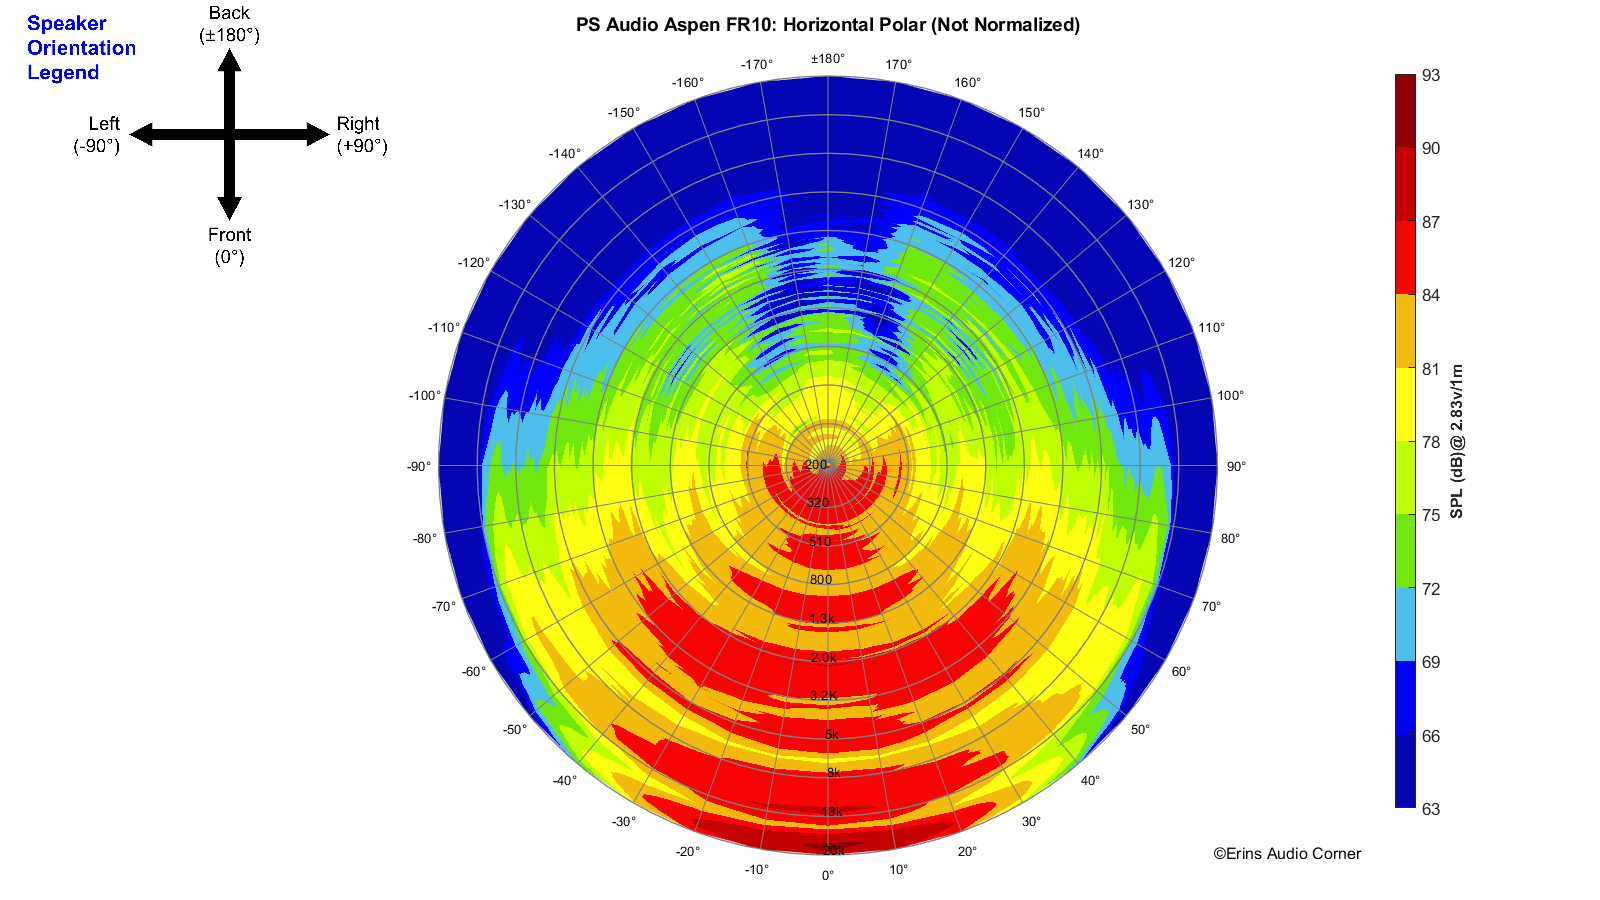
Horizontal Polar (Globe) Plot:
This represents the sound field at 2 meters - above 200Hz - per the legend in the upper left.
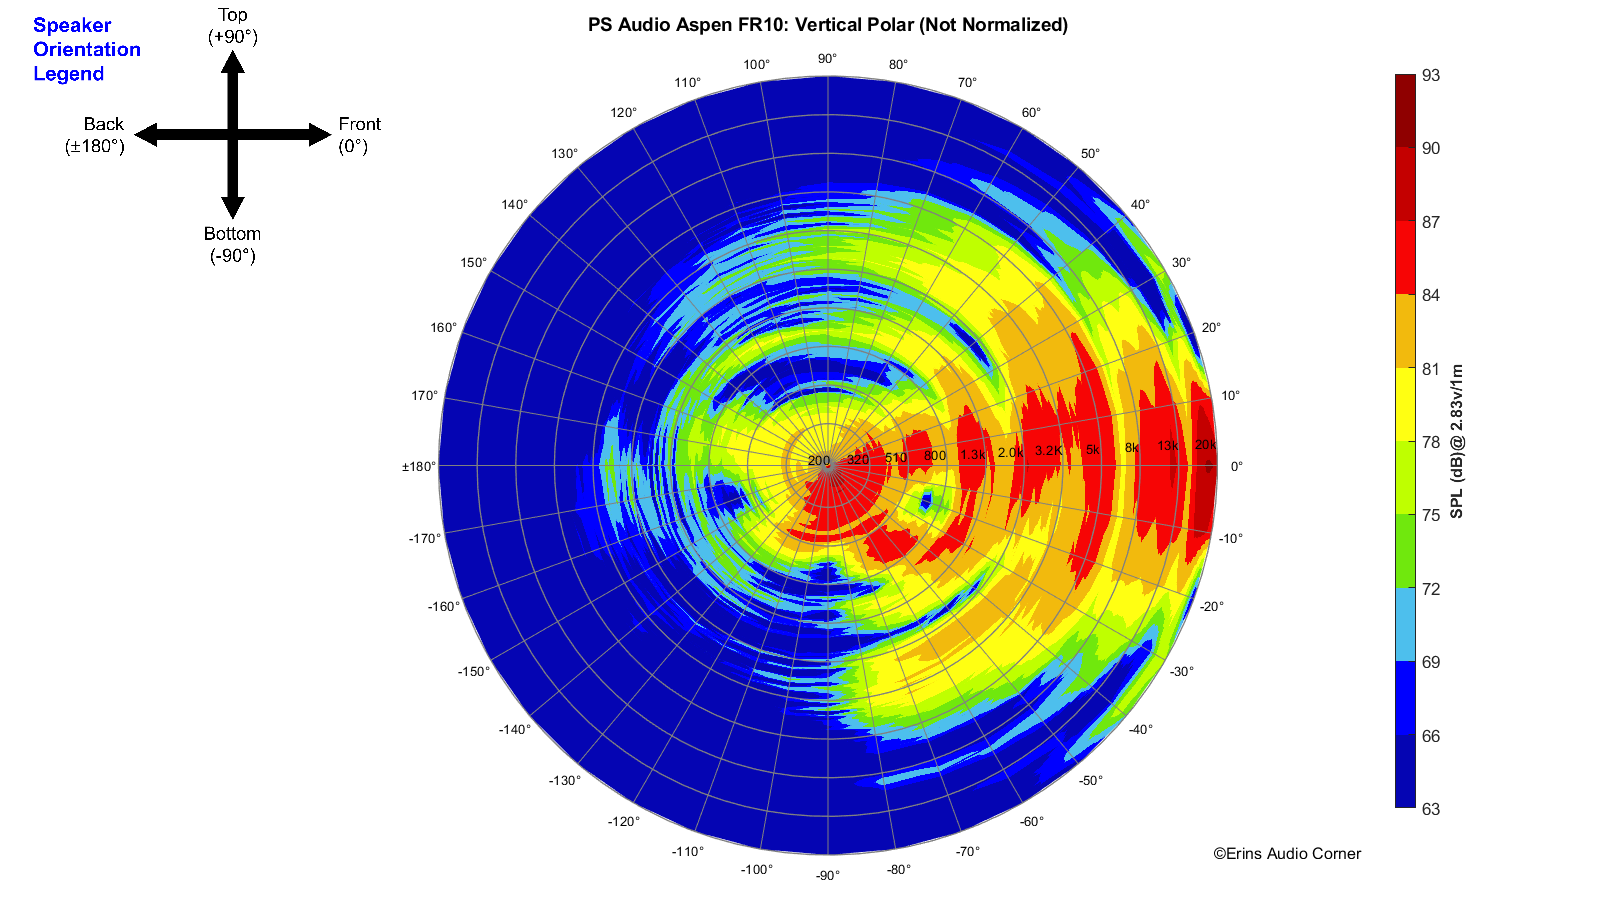
Vertical Polar (Globe) Plot:
This represents the sound field at 2 meters - above 200Hz - per the legend in the upper left.
Additional Measurements
Impedance
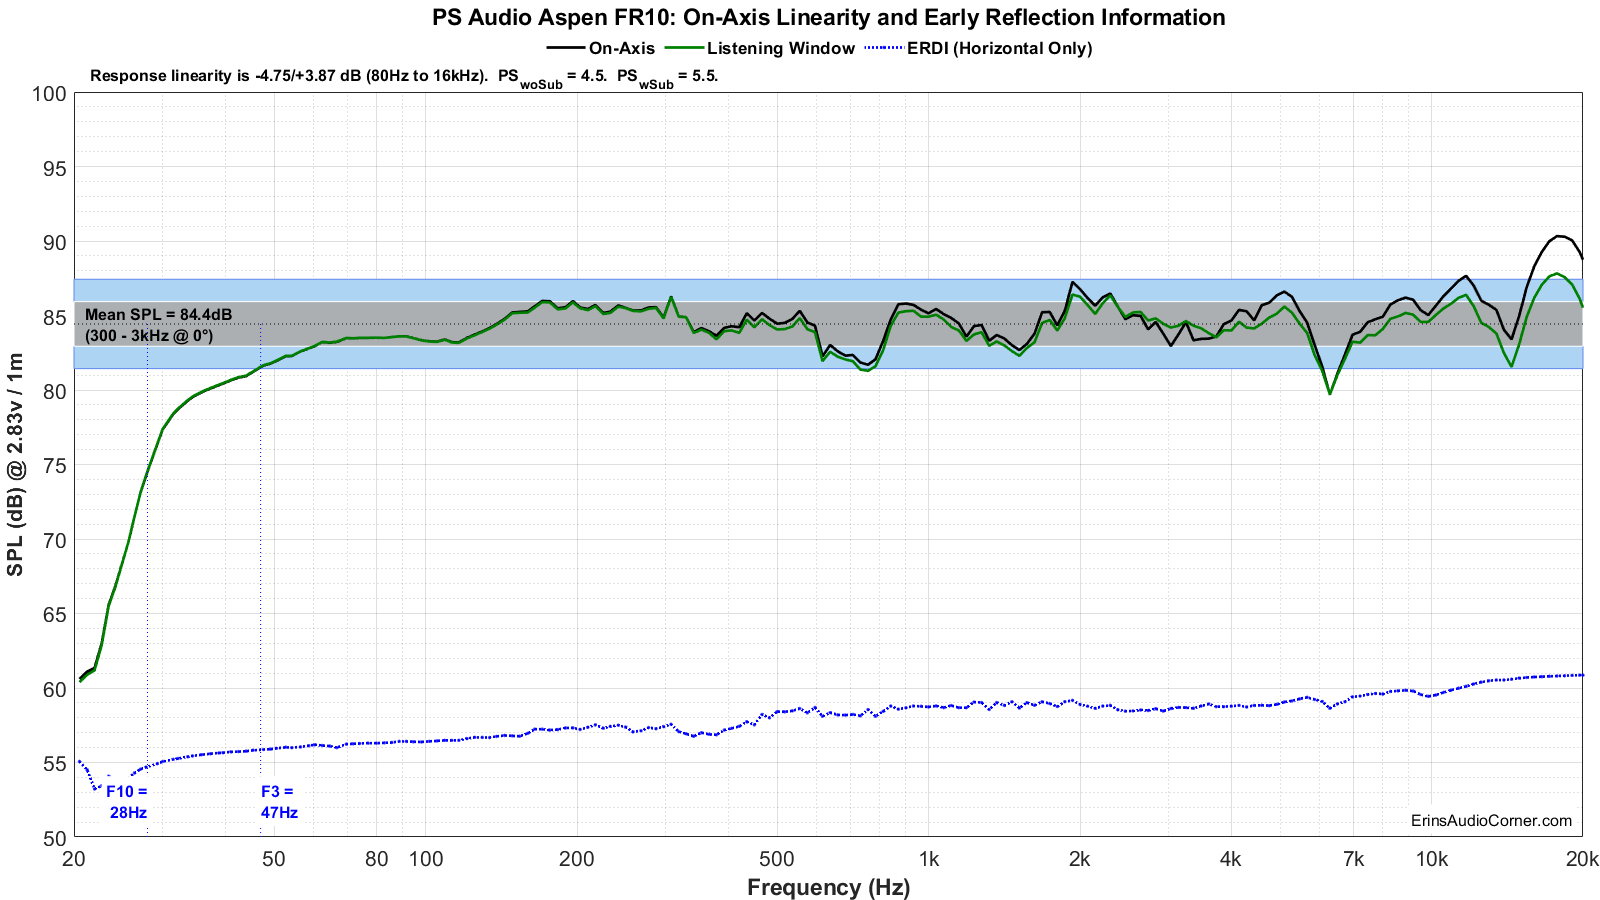
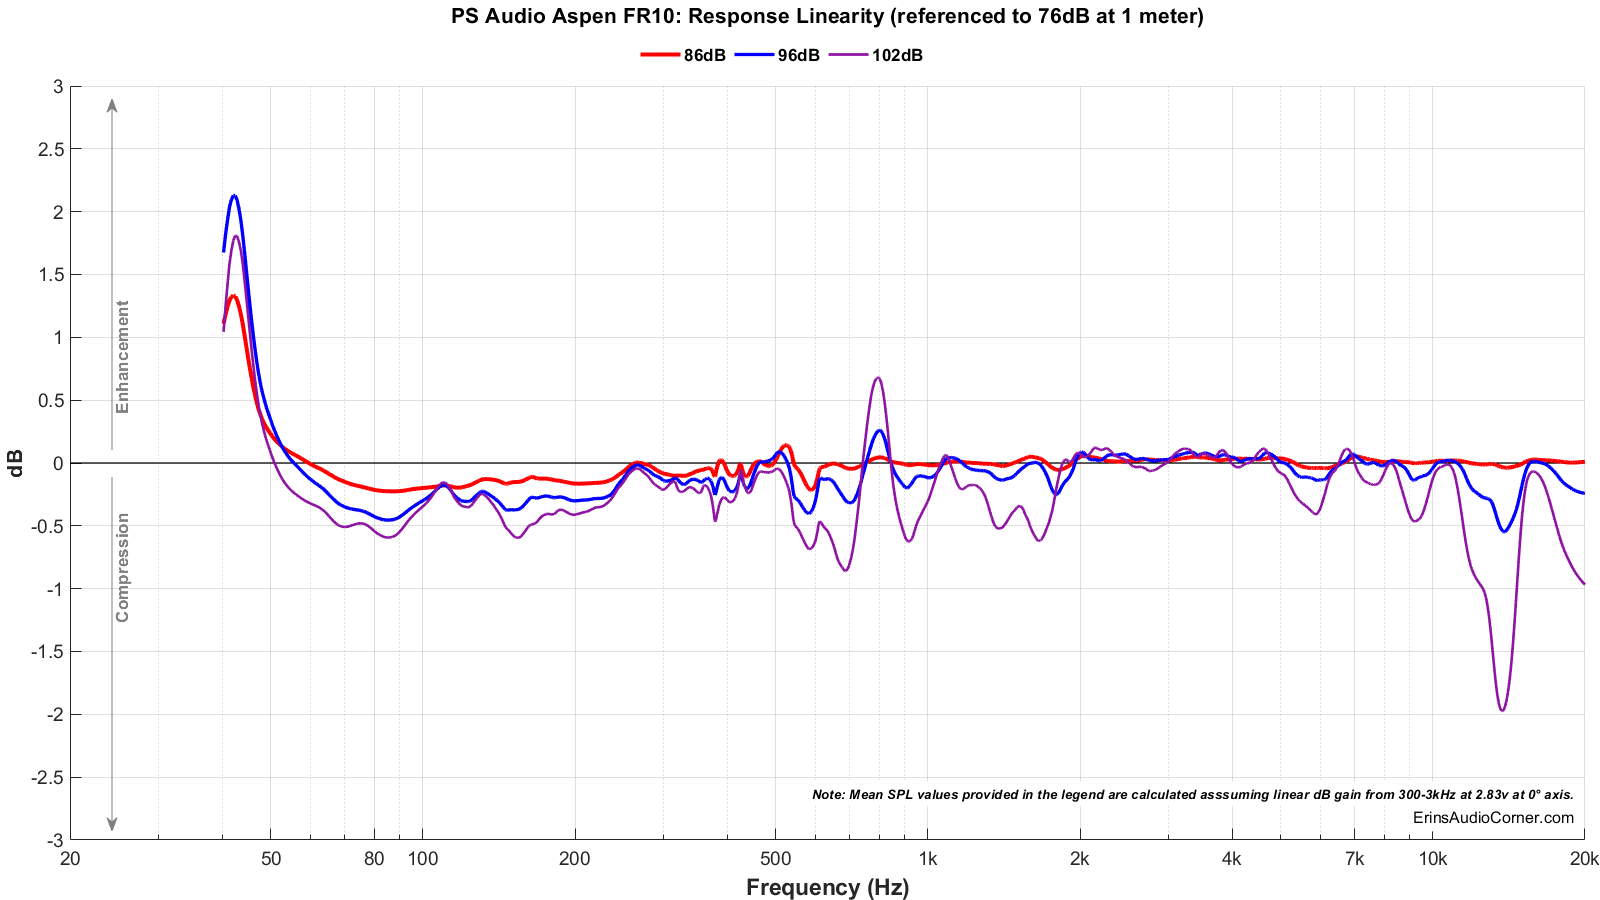
Response Linearity
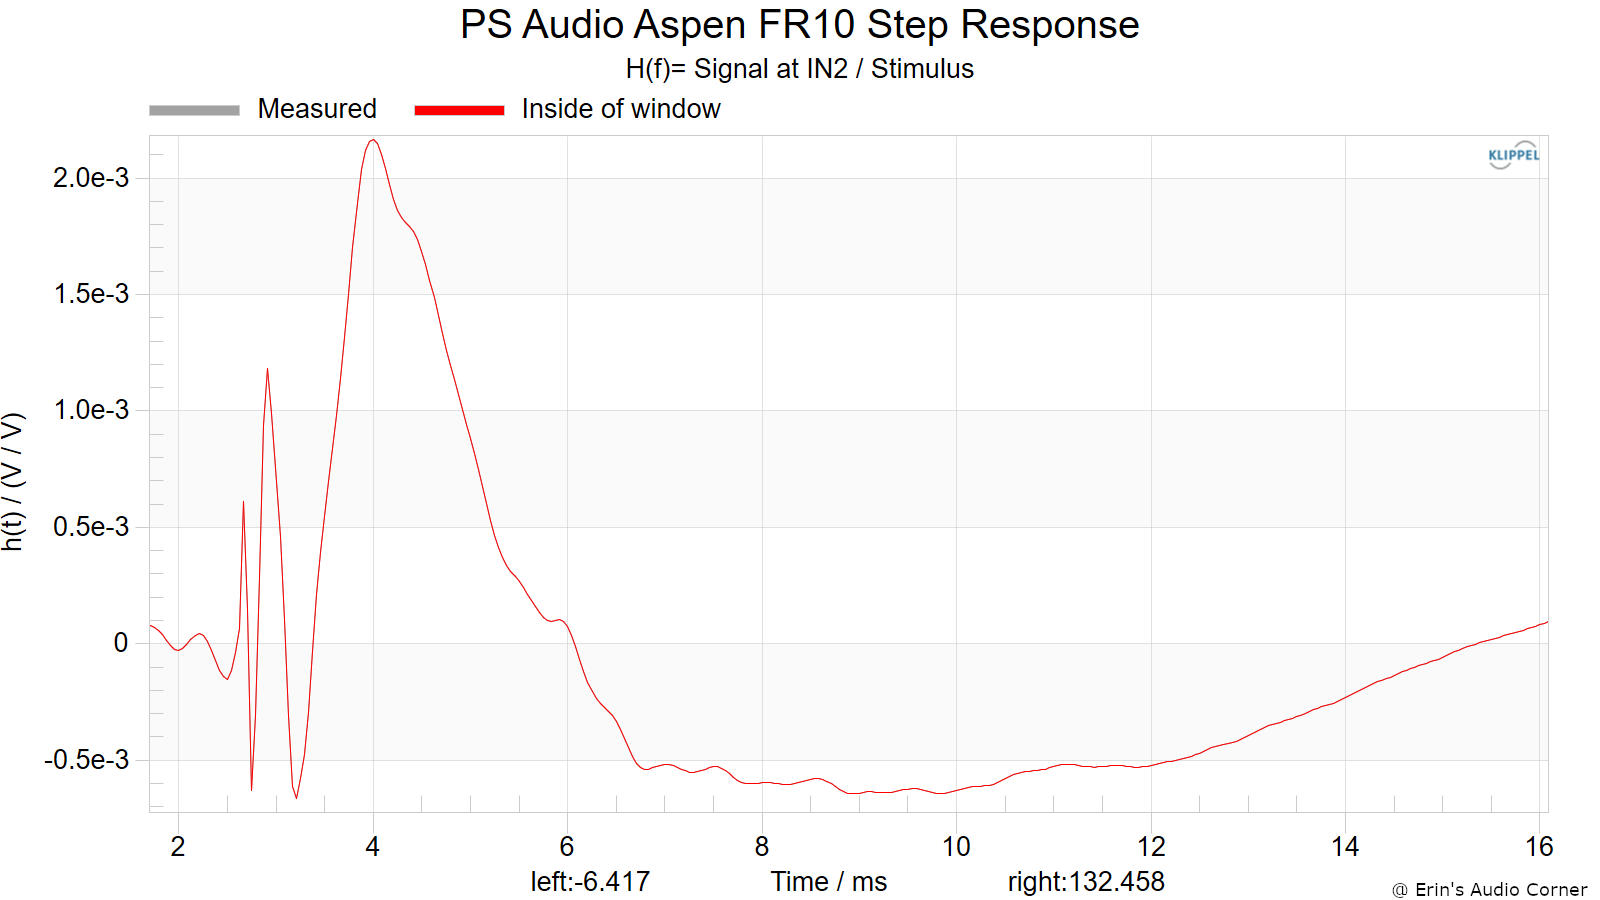
Step Response
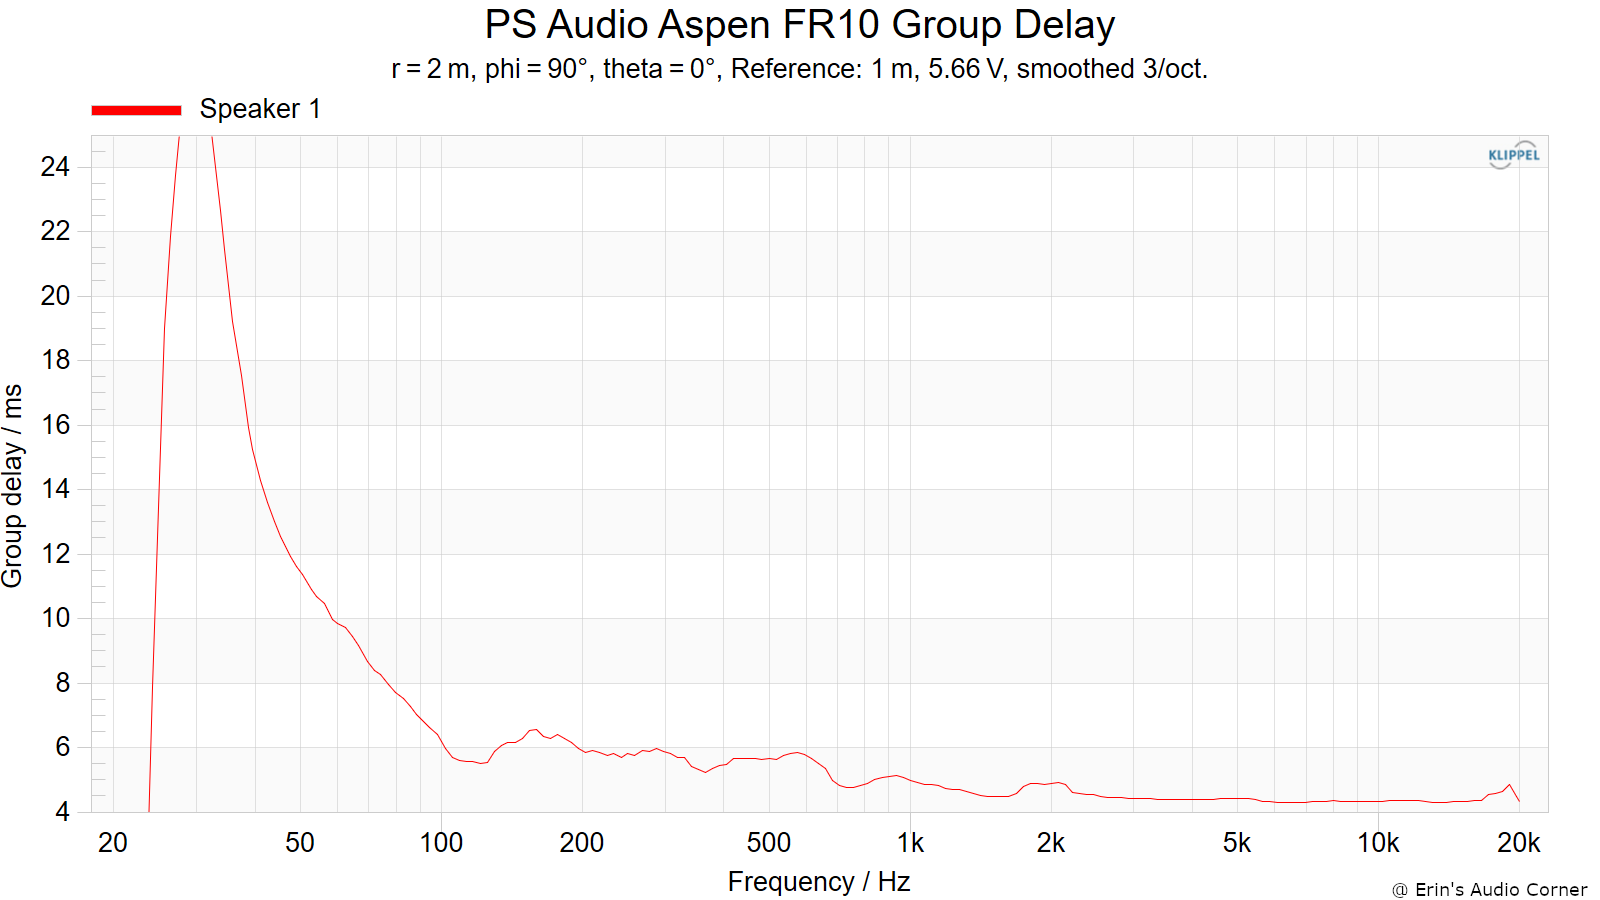
Group Delay
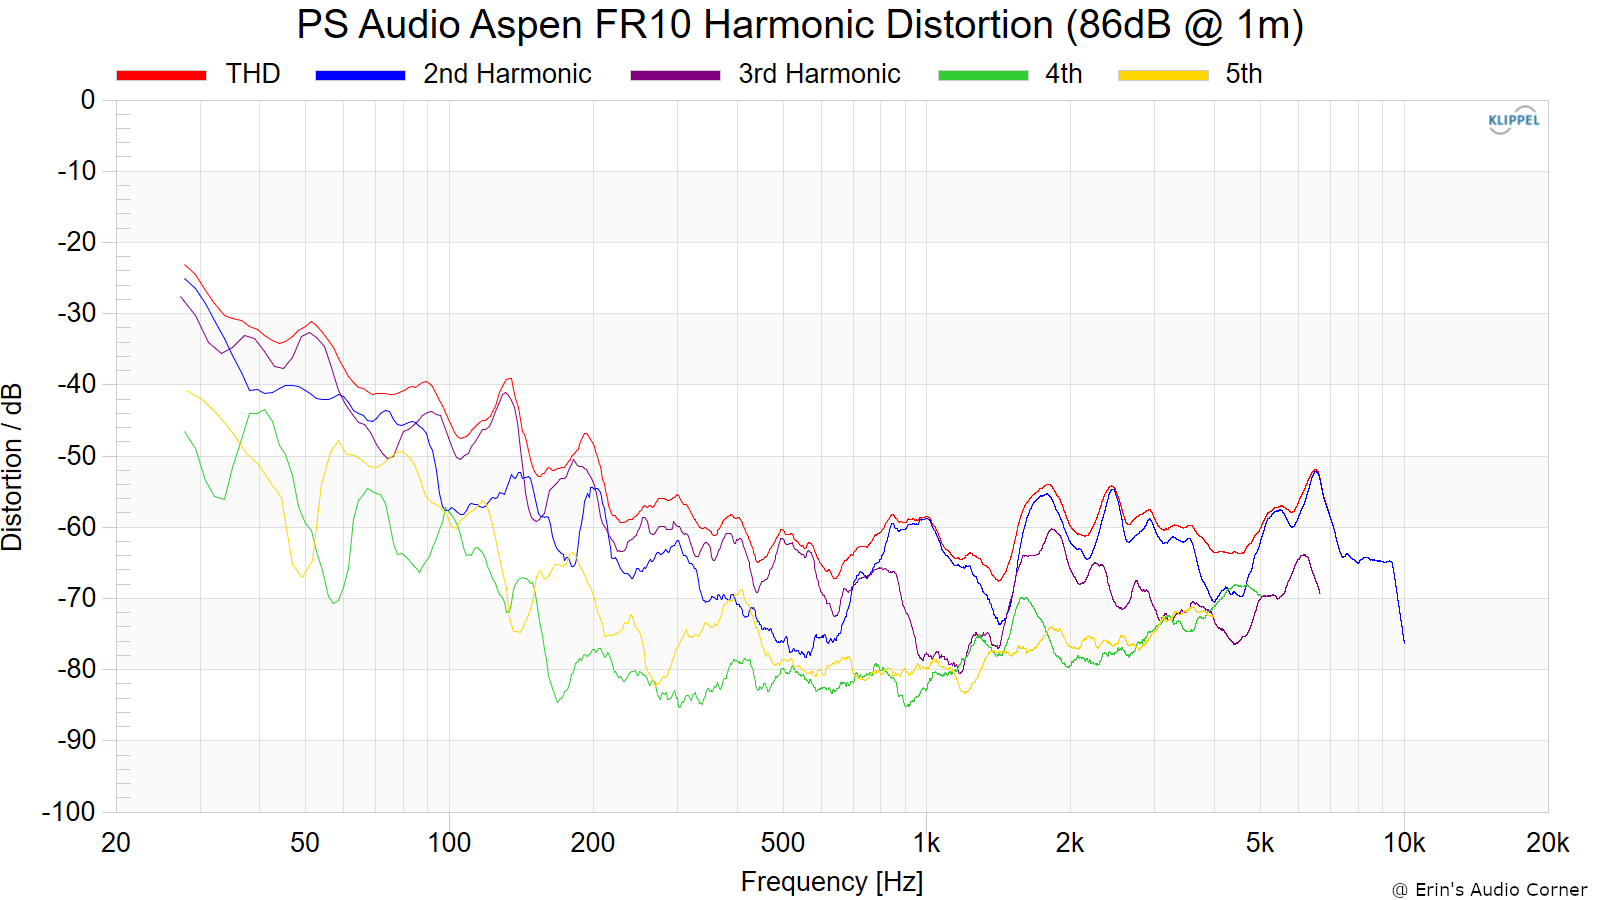
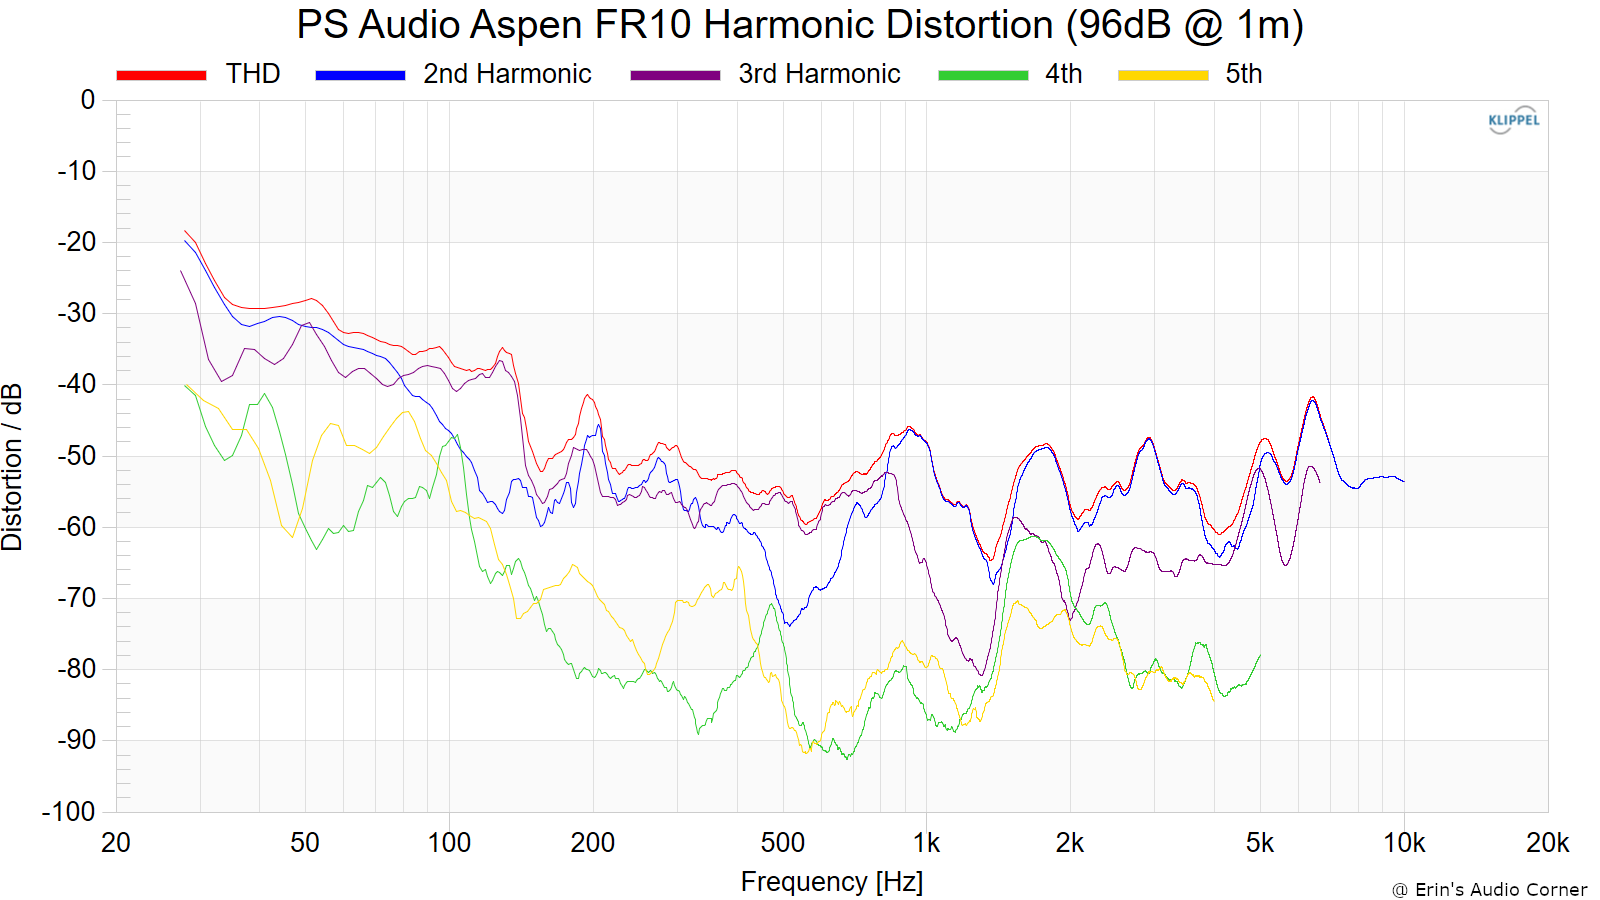
Harmonic Distortion
Harmonic Distortion at 86dB @ 1m:
Harmonic Distortion at 96dB @ 1m:
Dynamic Range (Instantaneous Compression Test)
The below graphic indicates just how much SPL is lost (compression) or gained (enhancement; usually due to distortion) when the speaker is played at higher output volumes instantly via a 2.7 second logarithmic sine sweep referenced to 76dB at 1 meter. The signals are played consecutively without any additional stimulus applied. Then normalized against the 76dB result.
The tests are conducted in this fashion:
- 76dB at 1 meter (baseline; black)
- 86dB at 1 meter (red)
- 96dB at 1 meter (blue)
- 102dB at 1 meter (purple)
The purpose of this test is to illustrate how much (if at all) the output changes as a speaker’s components temperature increases (i.e., voice coils, crossover components) instantaneously.
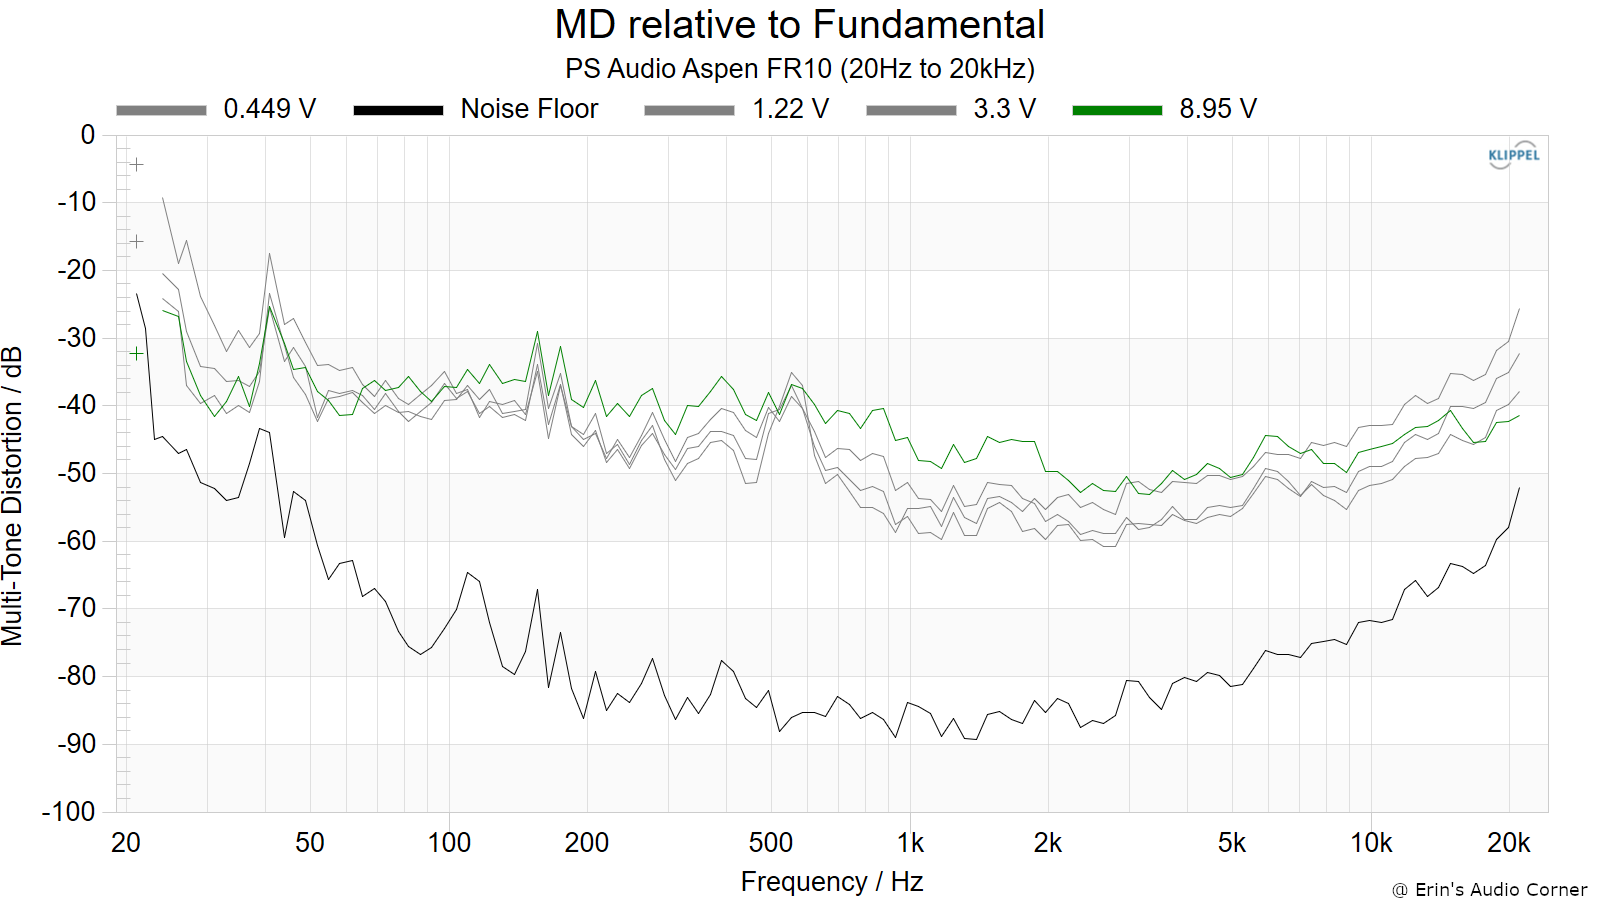
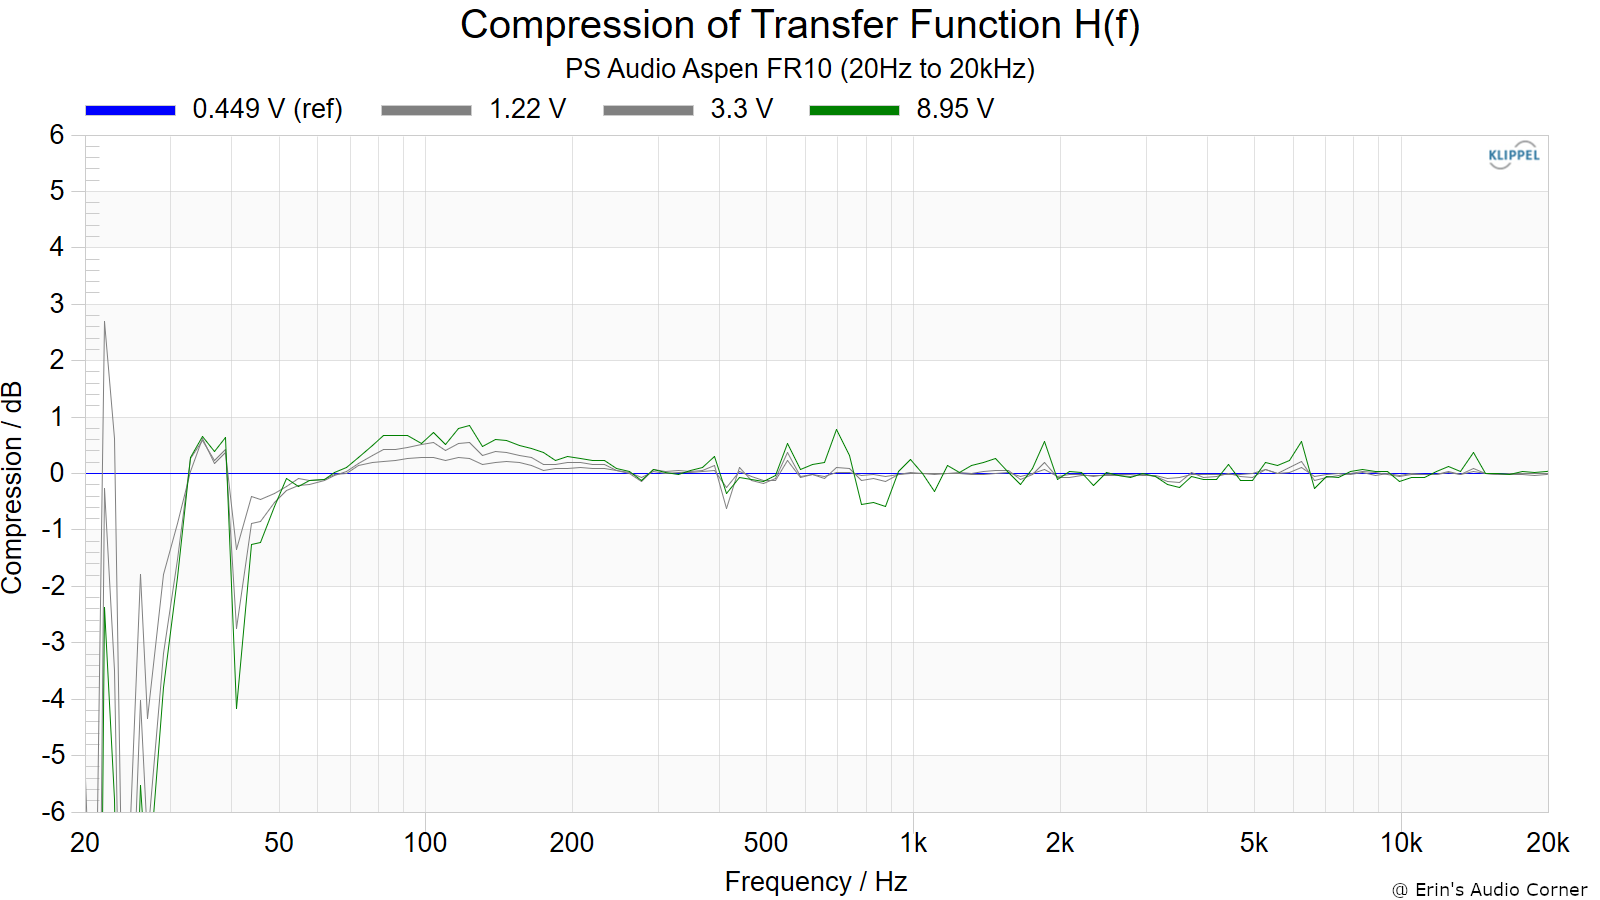
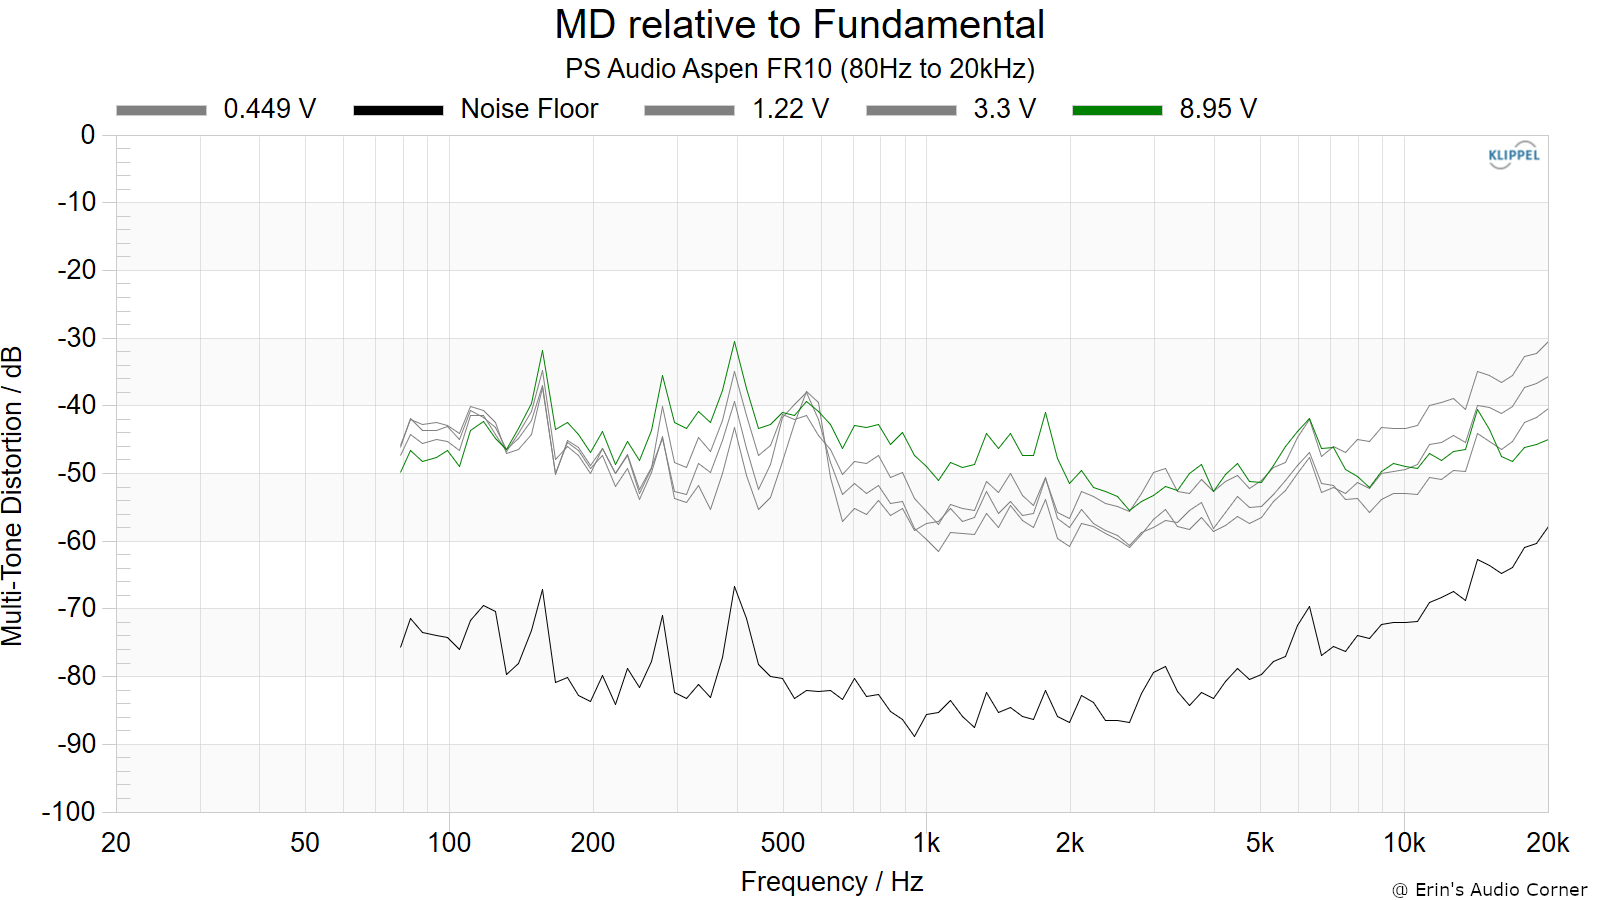
Multitone Distortion
The following tests are conducted at (4) approximate equivalent output volumes: 70/79/87/96dB @ 1 meter. The (4) voltages listed in the legend result in these SPL values. This test signal is dense, similar to pink noise and excites the entire spectrums listed below at the same time. The test signal lasts 30 seconds. This is different than the sine wave test signal used to measure frequency response. The purpose of this distortion and compression test is to illustrate how much (if at all) the output changes as a speaker’s components temperature increases (i.e., voice coils, crossover components) over time.
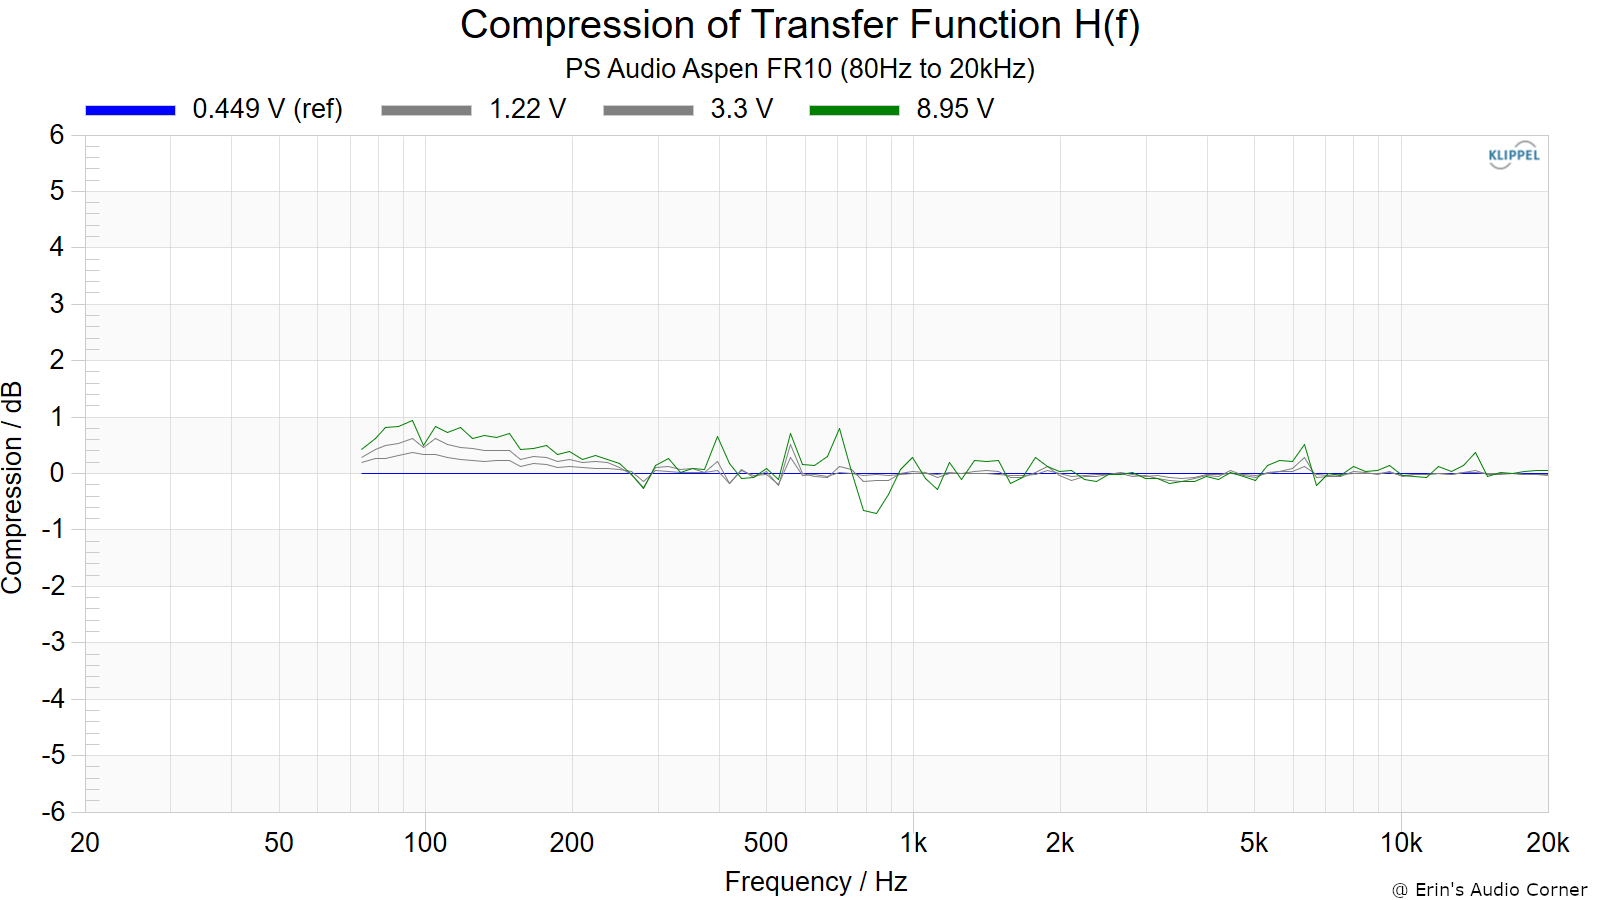
Given the test signal is similar to pink noise and exciting the entire spectrum at the same time I also include compression results, which is captured at the same time distortion is captured. Sometimes these results differ from the compression results you see above (namely with powered designs incorporating DSP-based limiting).
Note: The KLIPPEL software shows compression in the positive scale.
The test was conducted in (3) manners:
- Full bandwidth (20Hz to 20kHz)
- 80Hz to 20kHz
The reason for the two measurements is to simulate running the speaker full range vs using a high-pass filter at 80Hz. However, note: the 2nd test low frequency limit at 80Hz is a “brick wall” and doesn’t quite emulate a standard filter of 12 or 24dB/octave. But… it’s close enough to illustrate the point.
- Full bandwidth (20Hz to 20kHz)
- 80Hz to 20kHz
Parting / Random Thoughts
See video linked above for subjective and objective analysis. A summarized transcript is provided below:
The PS Audio Aspen FR10 speakers, priced at $10,000 per pair, have some objective shortcomings but subjectively sound quite good to me. Objectively the 600-900Hz dip causes some ‘fullness’ to be lost. There is a strong but relatively narrow dip at ~6kHz that I can’t say was bothersome and appears to be related to the HF driver itself. Generally, I’d prefer to have this be filled in but I didn’t find it a detriment to my listening. (if this was a peak, however, it would have been quite aggravating).
My favorite aspect of this speaker was the wide soundstage they present which I am a sucker for. Both the horizontal contour plot and ERDI show this to be the case. Combined with the very nice upper midbass / lower midrange balance I was ablet to “look past” the objective issues noted above.
The reference listening axis is at the tweeter. Deviating more than about ±10° can cause more loss of ‘fullness’ in the 600Hz region and slight detail loss in the upper midrange.
Distortion is quite low, especially above the midrange. Compression is also good, though, the results show expansion (appearance of increased output) below ~50Hz.
The design uses a slight shelf of the midbass frequencies below ~150Hz due to their expected use of being placed near a wall. This is not uncommon in many designs. If pulled out far from the wall you may notice this as a mild lack of ‘punch’ or ‘kick’ if you are used to speakers with a flatter response through this region.
Support / Contribute
If you find this review helpful and want to help support the cause that would be AWESOME! There are a few ways you can do so below. Your support helps me pay for new items to test, hardware, miscellaneous items needed for testing, new speakers to review and costs of the site’s server space and bandwidth. Any help is very much appreciated.
Join my Patreon: Become a Patron!
Shopping
If you are shopping at any of the following stores then please consider using my generic affiliate links below to make the purchase through.
Purchases through these links can earn me a small commission - at no additional cost to you - and help me continue to provide the community with free content and reviews. Doesn’t matter if it’s a TV from Crutchfield, budget speakers from Audio Advice or a pair of socks from Amazon, just use the link above before you make your purchase. Thank you!