Foreword / YouTube Video Review
The review on this website is a brief overview and summary of the objective performance of this speaker. It is not intended to be a deep dive. Moreso, this is information for those who prefer “just the facts” and prefer to have the data without the filler.
Information and Photos
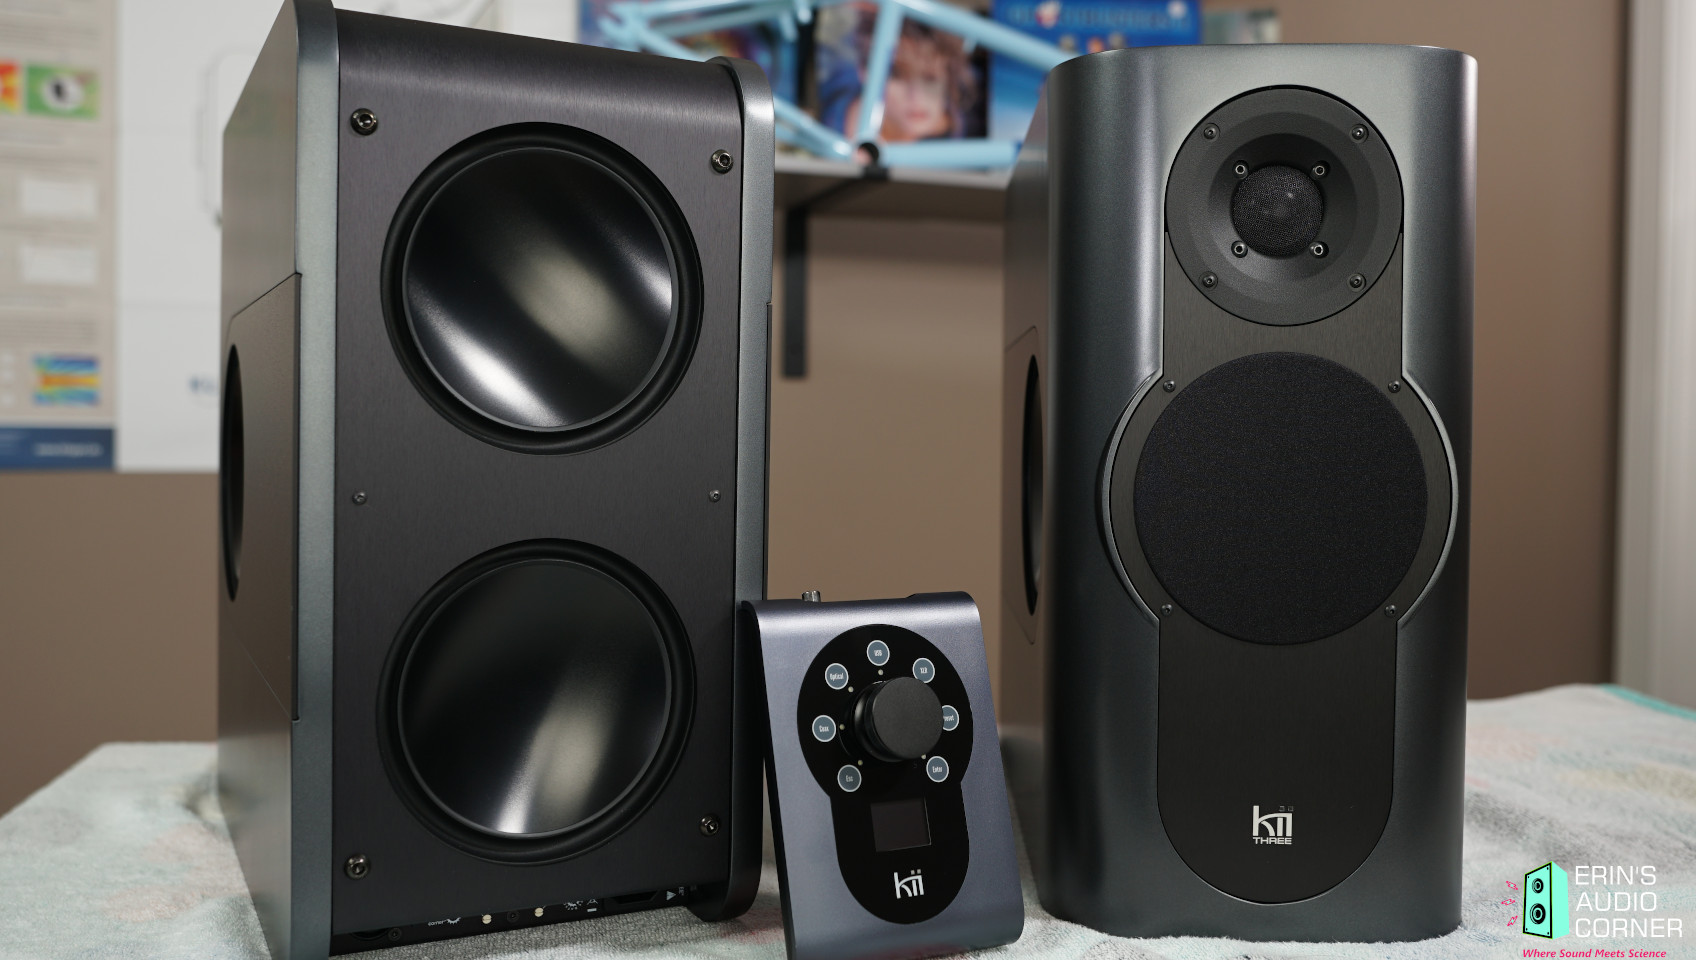
A pair of [Kii THREE](https://www.kiiaudio.com/) speakers and the Kii CONTROL were loaned to me by Kii Audio for review purposes. MSRP is approximately $14,000 USD for a pair.
Some notes from the manufacturer’s website:
Compact DSP controlled monitor speaker
- 4 x 6.5” woofer,
- 1 x 5” midrange,
- 1 x 1” waveguided tweeter, all individually driven
- Amplification: 1.500 W full-custom Class D
- Active Wave Focusing crossover filter
- Frequency response: ± 0,5dB - 25 kHz, 20Hz -6dB (*)
- Integrated tone control
- Phase response: selectable, linear phase or minimum latency
- Protection limiters
- Controlled Directivity: 4.8dB (54Hz - 1kHz, slowly rising thereafter)
- Size: 20x40x40cm, 8”x16”x16” (WxHxD)
- Weight: 19kg (40lbs)
- Inputs: Analogue, AES/EBU, KiiLink
- SPDIF, TOSLink, USB on Kii Control.
- Selectable correction for free-standing, near wall or in corner (14 positions)
- Automatic Standby Mode
- (*) IEC60268-5 Paragraphe 20.6
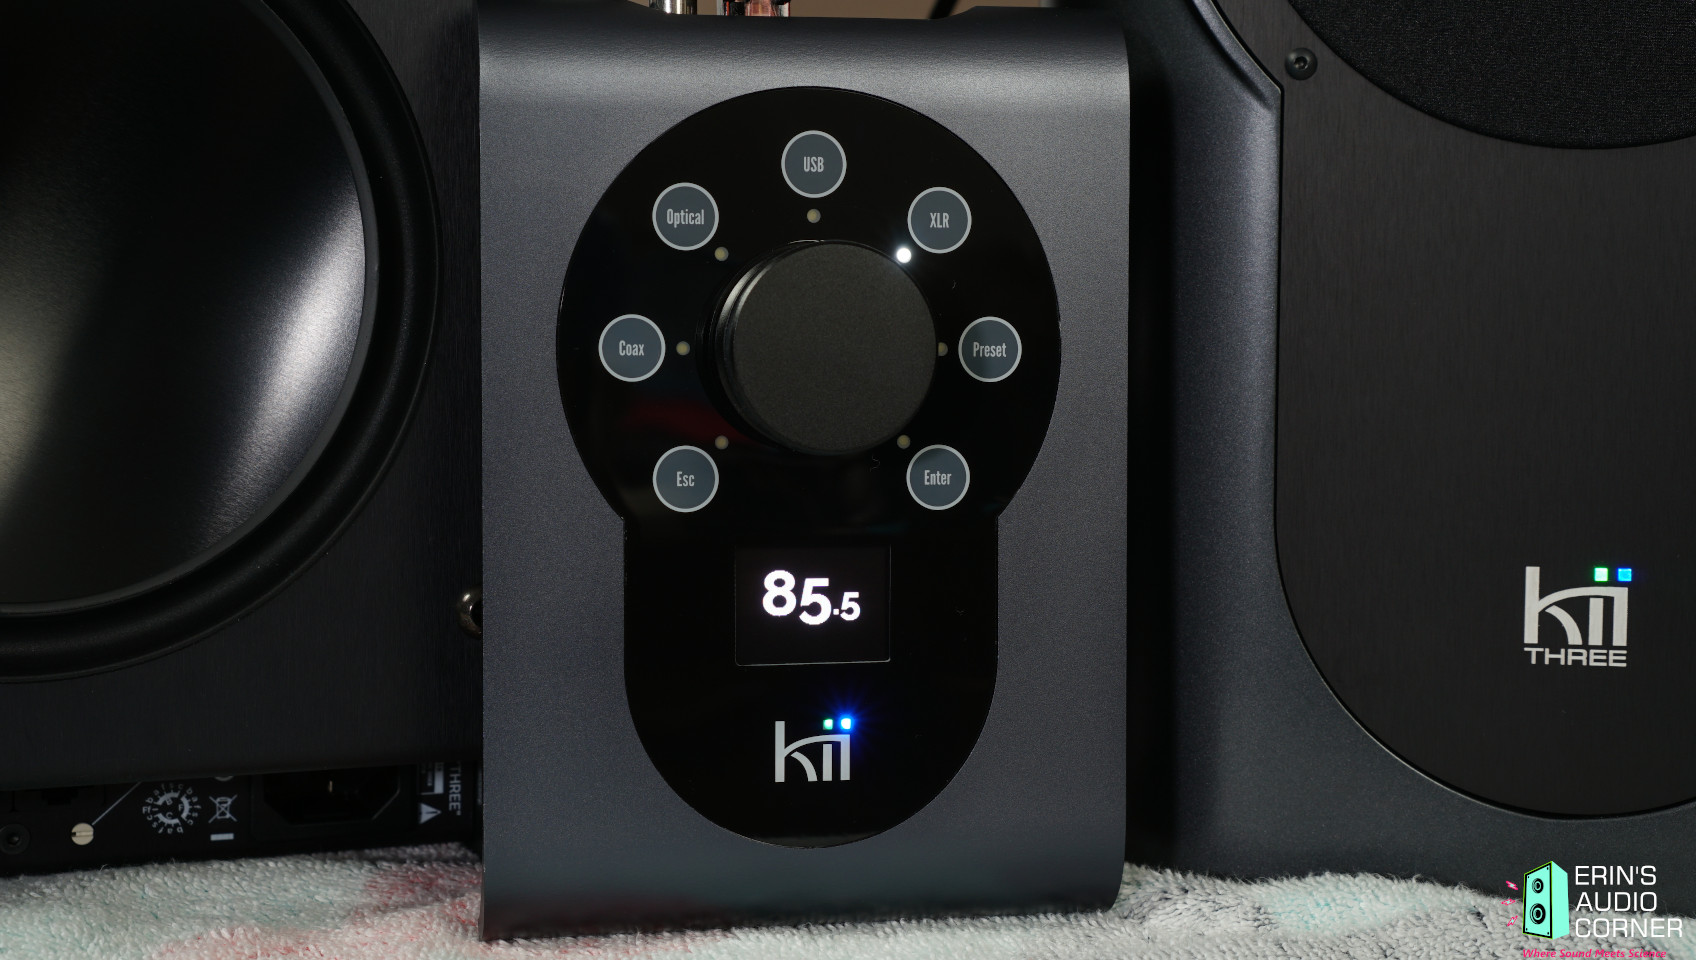
The Kii CONTROL turns the Kii THREE into a complete playback system of highest sonic quality and usability. It offers a user interface for your speakers and works like a digital preamplifier. Only connect your analog source, CD player/drive, server, streamer, TV set or set top box to enjoy a breathtakingly audiophile full range system in a stunningly small footprint. The Kii CONTROL offers three additional digital inputs for the Kii THREE: Coax SPDIF, Optical TOSLINK and USB (up to LPCM 24/384kHz or DSD64/128 on USB).For more information from the manufacturer about the Kii THREE, check out the video below.
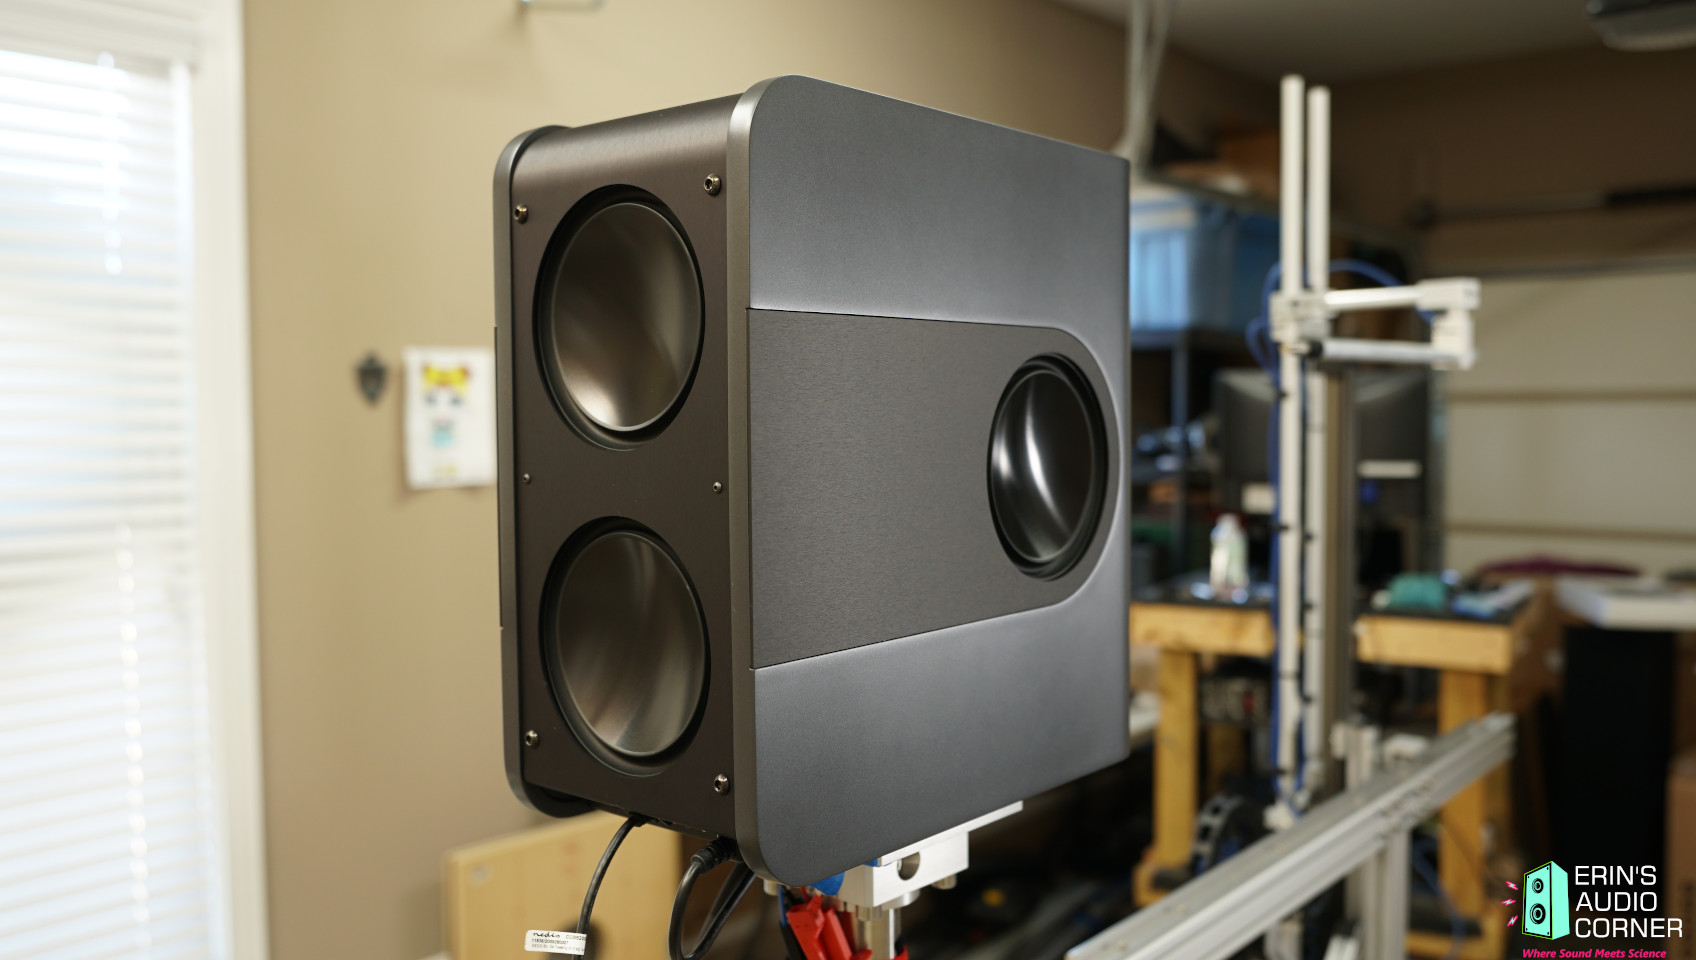
Back of the speaker - shown on the Klippel test stand:
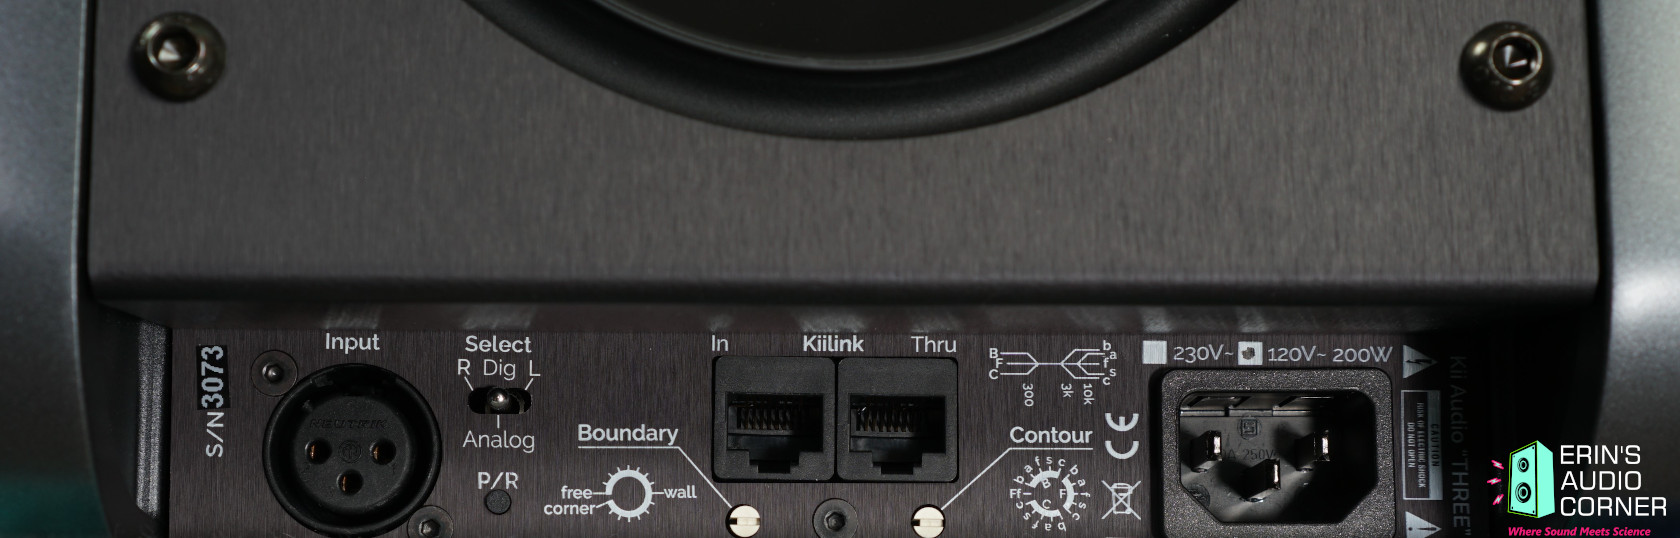
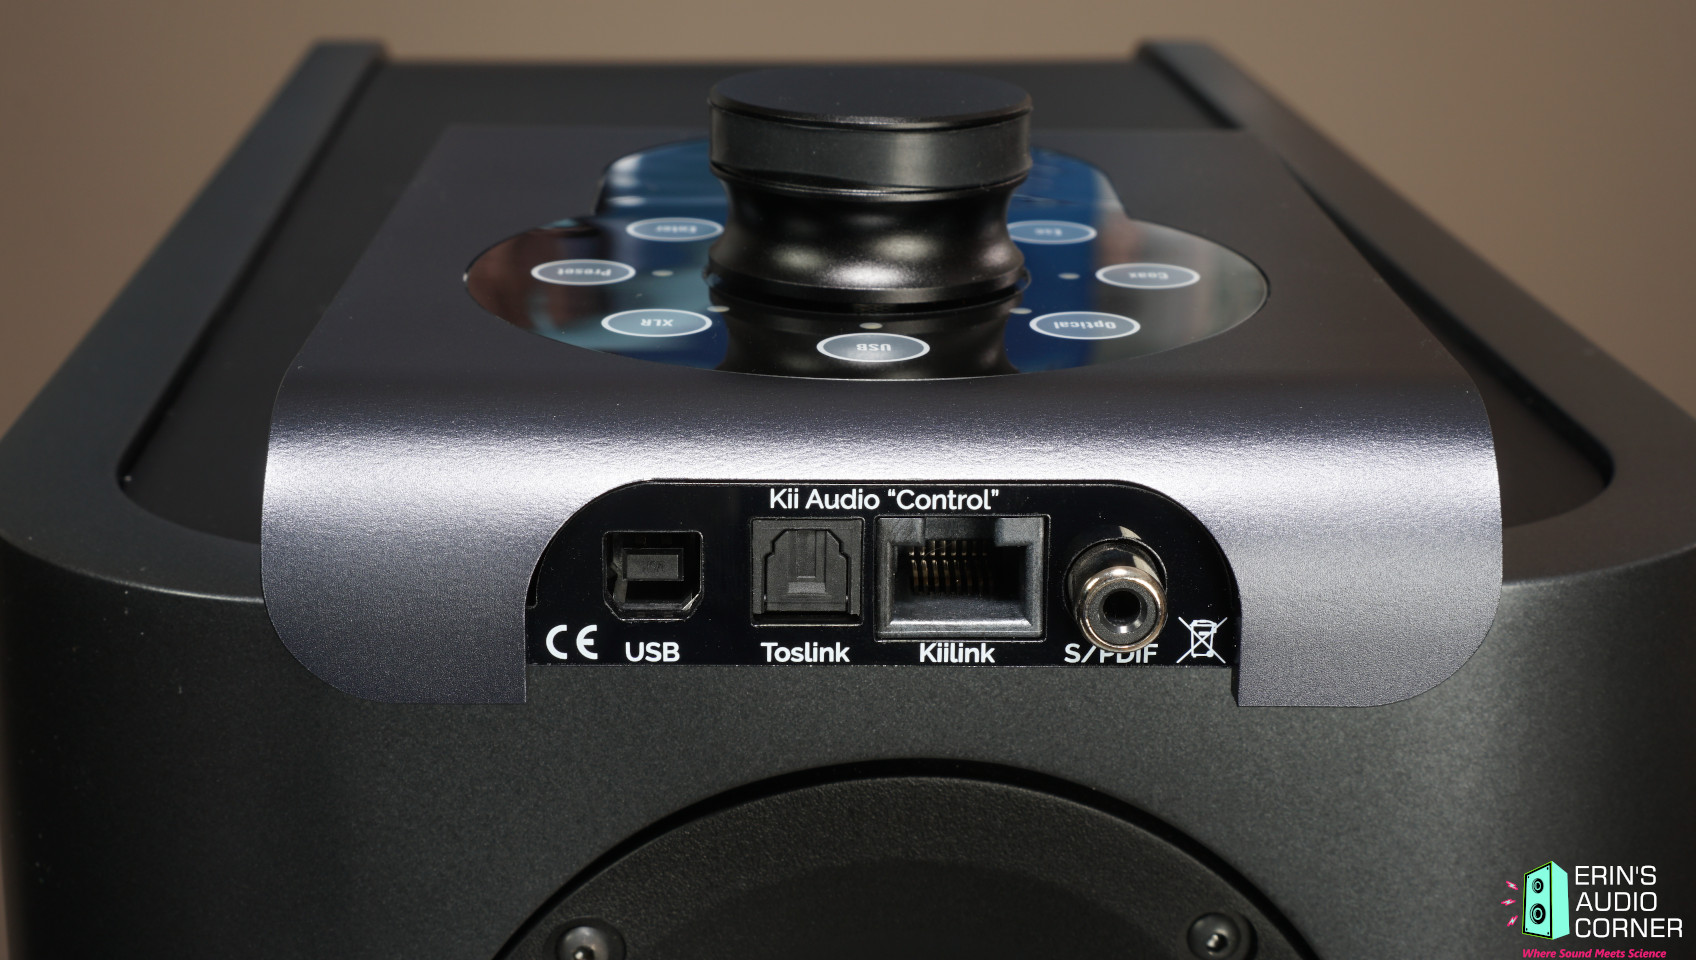
Closeup of the back showing DSP settings (boundary controls and tonal balance) and input options:
Kii CONTROL with additional Coax SPDIF, Optical TOSLINK and USB inputs.

CTA-2034 (SPINORAMA) and Accompanying Data
All data collected using Klippel’s Near-Field Scanner. The Near-Field-Scanner 3D (NFS) offers a fully automated acoustic measurement of direct sound radiated from the source under test. The radiated sound is determined in any desired distance and angle in the 3D space outside the scanning surface. Directivity, sound power, SPL response and many more key figures are obtained for any kind of loudspeaker and audio system in near field applications (e.g. studio monitors, mobile devices) as well as far field applications (e.g. professional audio systems). Utilizing a minimum of measurement points, a comprehensive data set is generated containing the loudspeaker’s high resolution, free field sound radiation in the near and far field. For a detailed explanation of how the NFS works and the science behind it, please watch the below discussion with designer Christian Bellmann:
The reference plane in this test is between the midrange and the tweeter. Through some testing I found the most nominal response to be with the tweeter level down 2dB so the results given below are with this setting in place. Boundary controls and otherwise, all settings are ‘default’.
Measurements are provided in a format in accordance with the Standard Method of Measurement for In-Home Loudspeakers (ANSI/CTA-2034-A R-2020). For more information, please see this link.
Note: Since this is a powered speaker, the SPL readings in the below graphics was not the SPL tested. This speaker was tested at a level of approximately 80dB at 1m (0.25vRMS input). The output SPL is scaled based on the 0.30v, though. Therefore, at 0.30v input to this speaker, the output is shown as below.
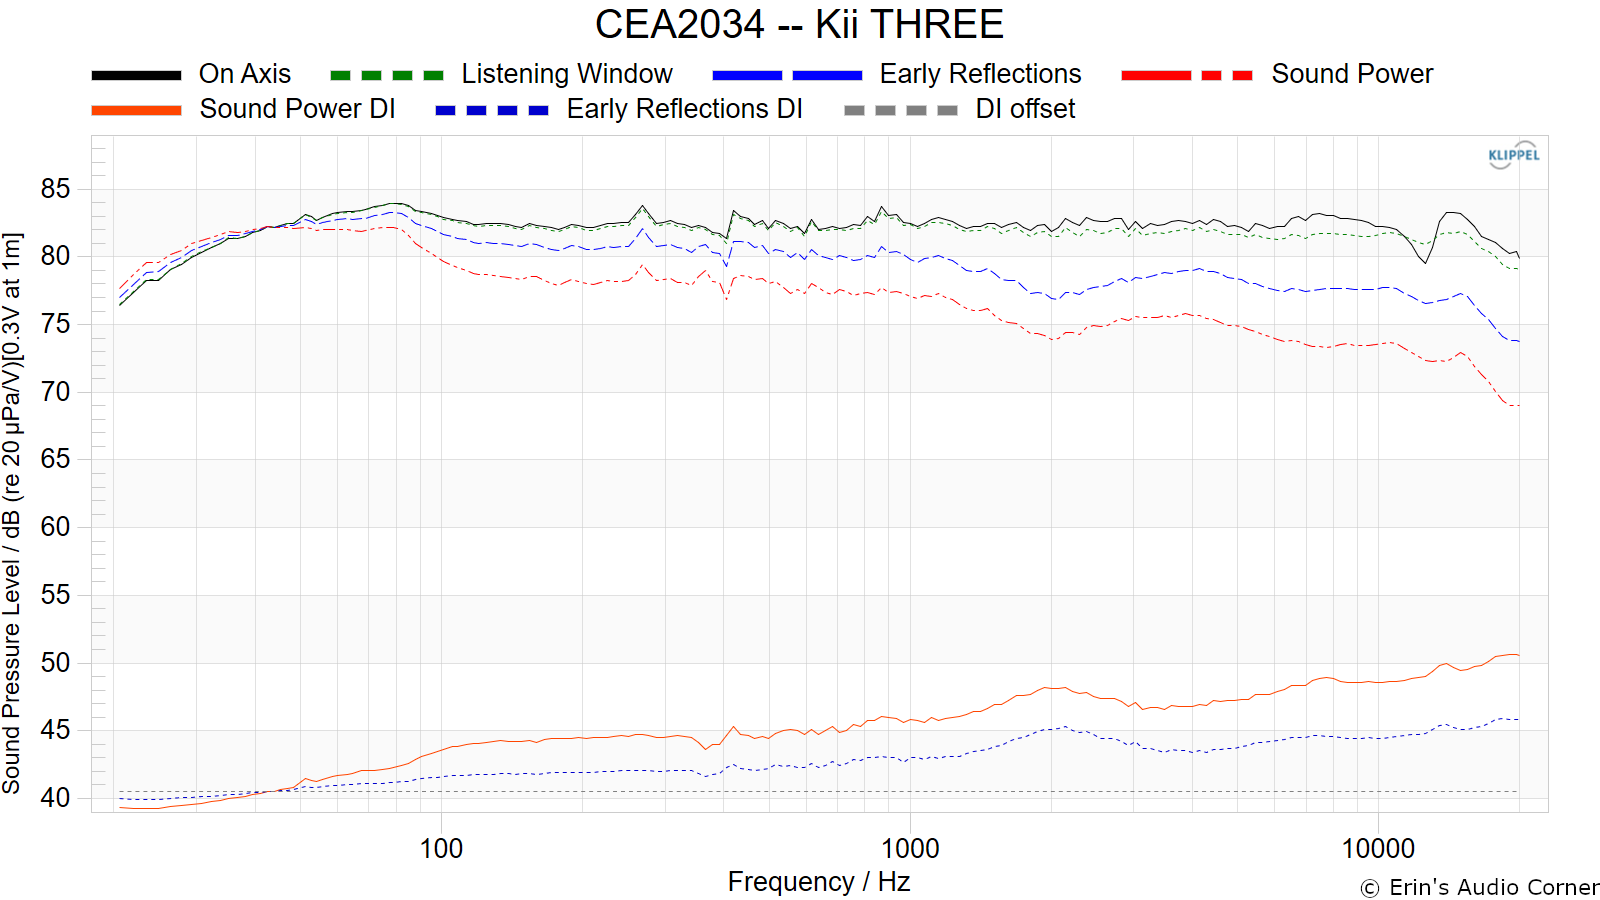
CTA-2034 / SPINORAMA:
The On-axis Frequency Response (0°) is the universal starting point and in many situations it is a fair representation of the first sound to arrive at a listener’s ears.
The Listening Window is a spatial average of the nine amplitude responses in the ±10º vertical and ±30º horizontal angular range. This encompasses those listeners who sit within a typical home theater audience, as well as those who disregard the normal rules when listening alone.
The Early Reflections curve is an estimate of all single-bounce, first-reflections, in a typical listening room.
Sound Power represents all the sounds arriving at the listening position after any number of reflections from any direction. It is the weighted rms average of all 70 measurements, with individual measurements weighted according to the portion of the spherical surface that they represent.
Sound Power Directivity Index (SPDI): In this standard the SPDI is defined as the difference between the listening window curve and the sound power curve.
Early Reflections Directivity Index (EPDI): is defined as the difference between the listening window curve and the early reflections curve. In small rooms, early reflections figure prominently in what is measured and heard in the room so this curve may provide insights into potential sound quality.
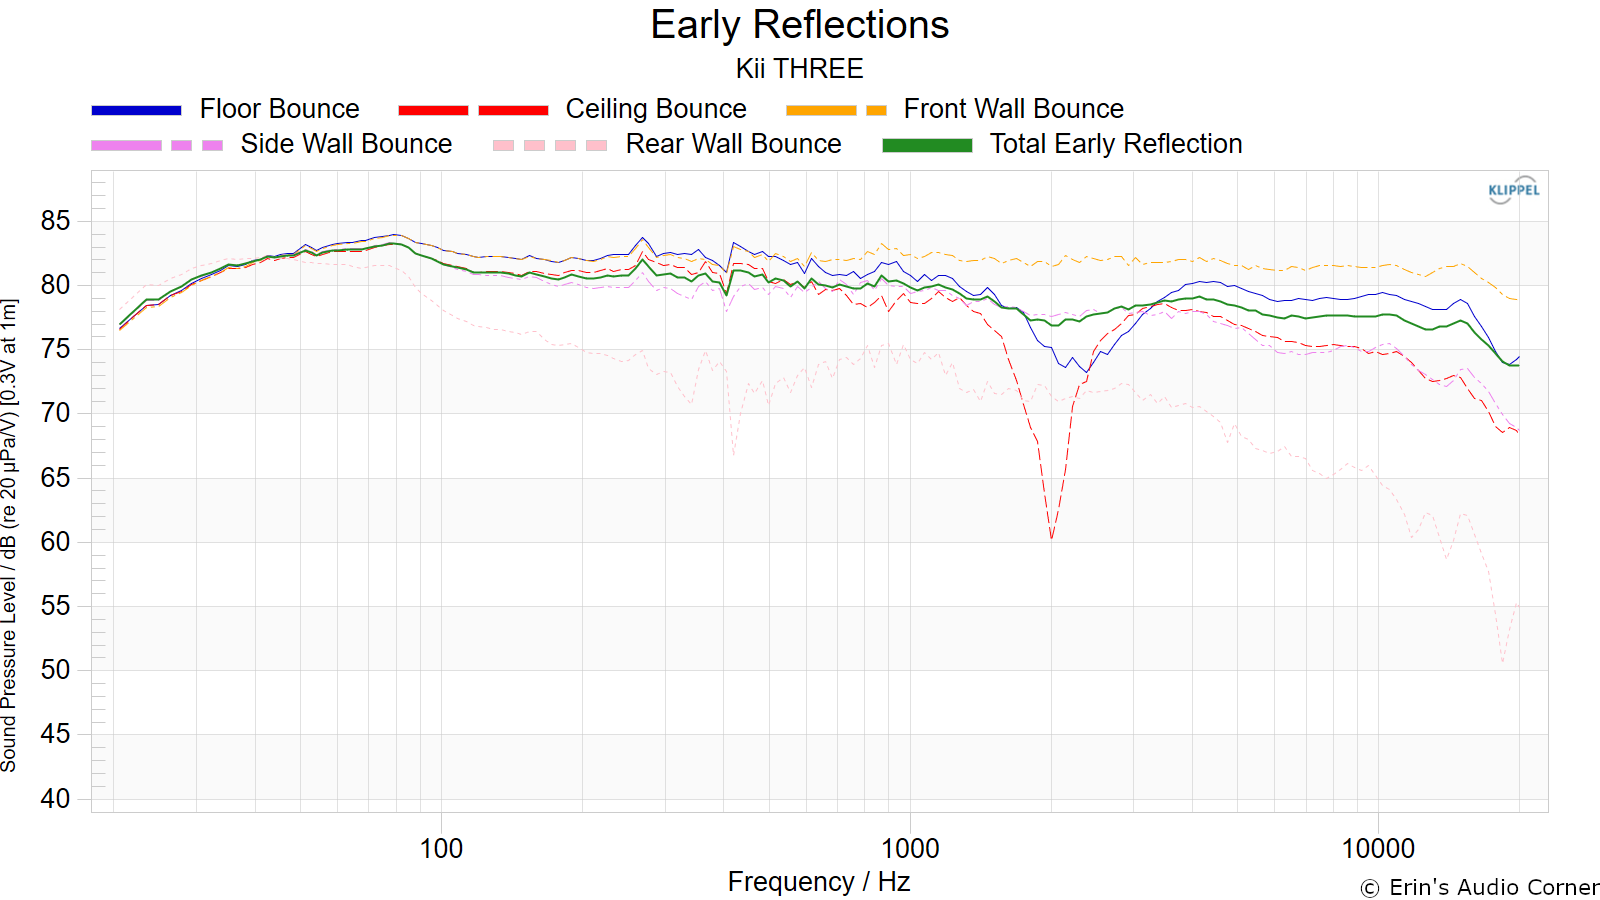
Early Reflections Breakout:
Floor bounce: average of 20º, 30º, 40º down
Ceiling bounce: average of 40º, 50º, 60º up
Front wall bounce: average of 0º, ± 10º, ± 20º, ± 30º horizontal
Side wall bounces: average of ± 40º, ± 50º, ± 60º, ± 70º, ± 80º horizontal
Rear wall bounces: average of 180º, ± 90º horizontal
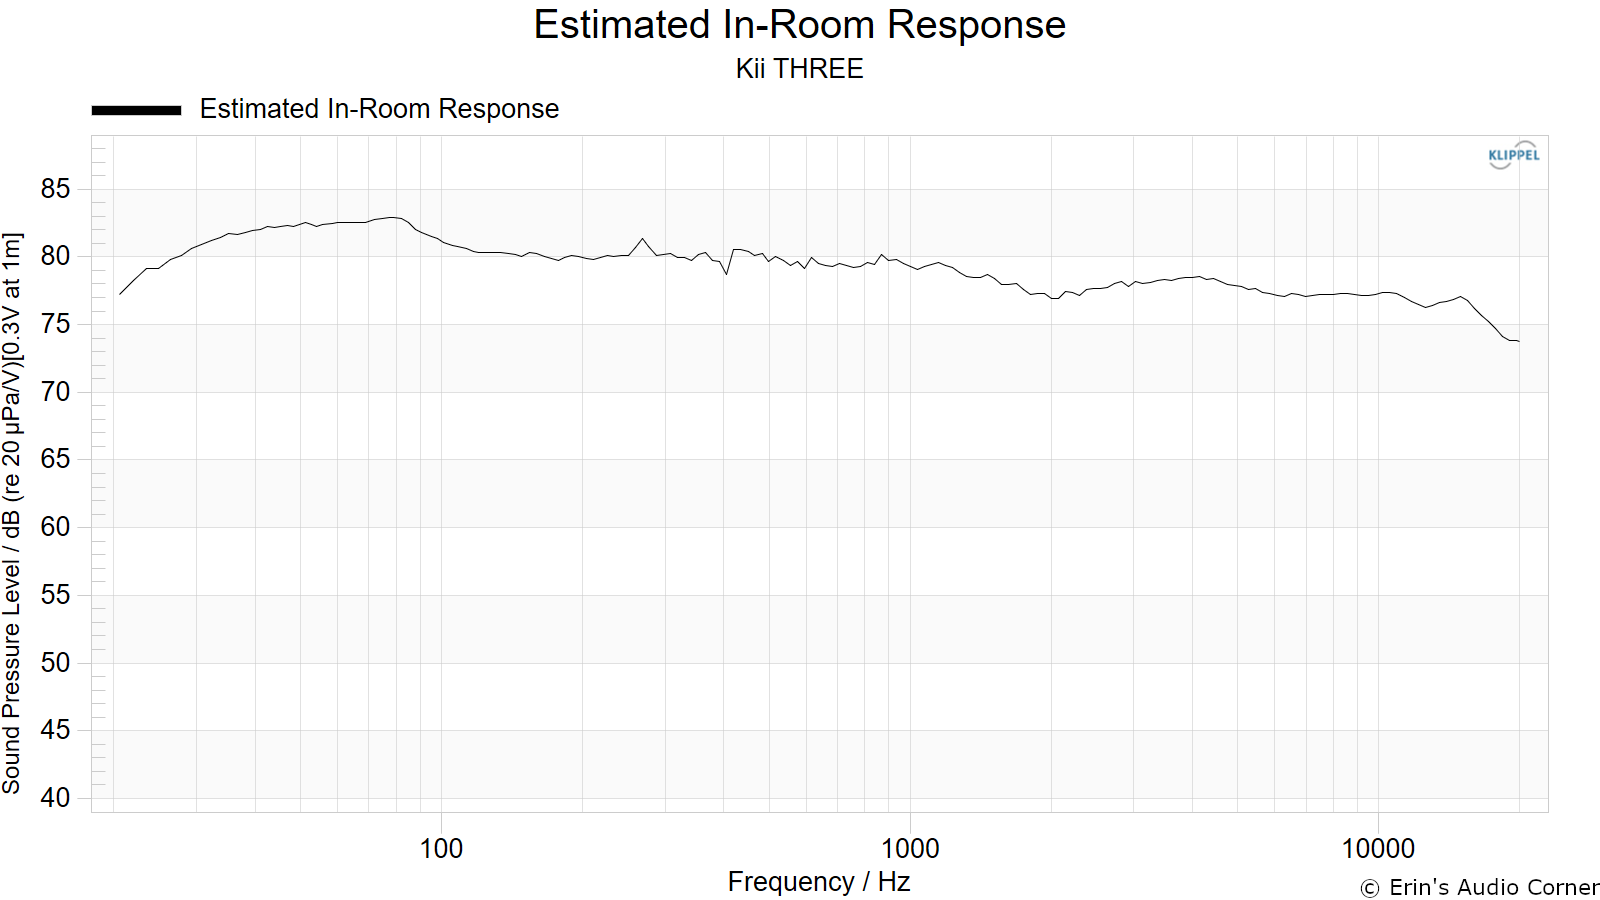
Estimated In-Room Response:
In theory, with complete 360-degree anechoic data on a loudspeaker and sufficient acoustical and geometrical data on the listening room and its layout it would be possible to estimate with good precision what would be measured by an omnidirectional microphone located in the listening area of that room. By making some simplifying assumptions about the listening space, the data set described above permits a usefully accurate preview of how a given loudspeaker might perform in a typical domestic listening room. Obviously, there are no guarantees because individual rooms can be acoustically aberrant. Sometimes rooms are excessively reflective (“live”) as happens in certain hot, humid climates, with certain styles of interior décor and in under-furnished rooms. Sometimes rooms are excessively “dead” as in other styles of décor and in some custom home theaters where acoustical treatment has been used excessively. This form of post processing is offered only as an estimate of what might happen in a domestic living space with carpet on the floor and a “normal” amount of seating, drapes, and cabinetry.
For these limited circumstances it has been found that a usefully accurate Predicted In-Room (PIR) amplitude response, also known as a “room curve” is obtained by a weighted average consisting of 12 % listening window, 44 % early reflections and 44 % sound power. At very high frequencies errors can creep in because of excessive absorption, microphone directivity, and room geometry. These discrepancies are not considered to be of great importance.
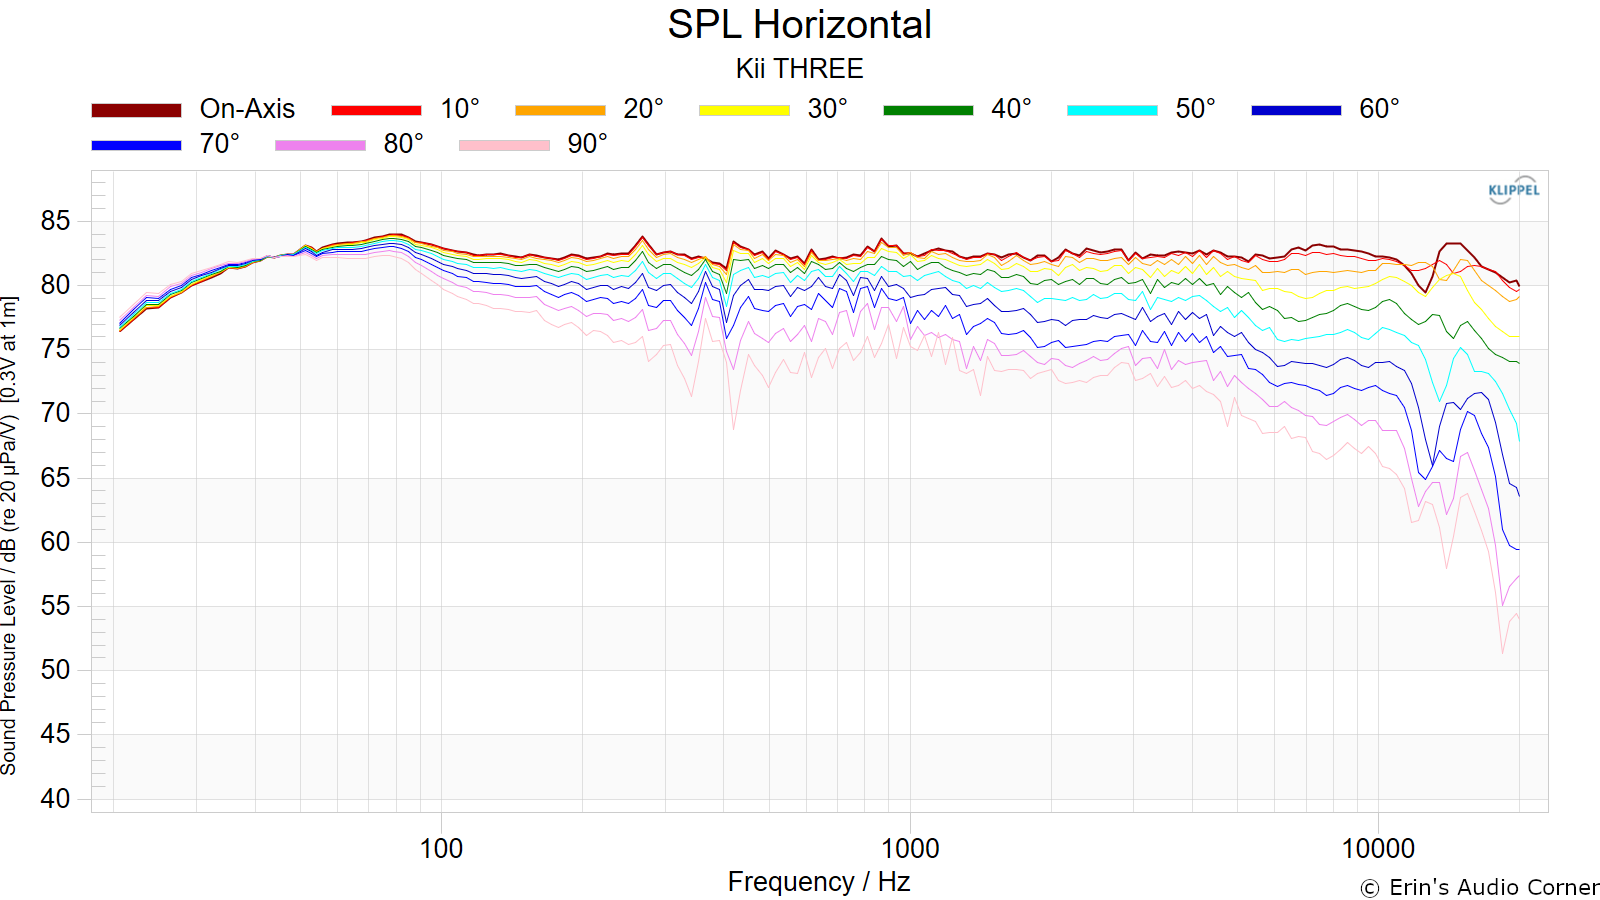
Horizontal Frequency Response (0° to ±90°):
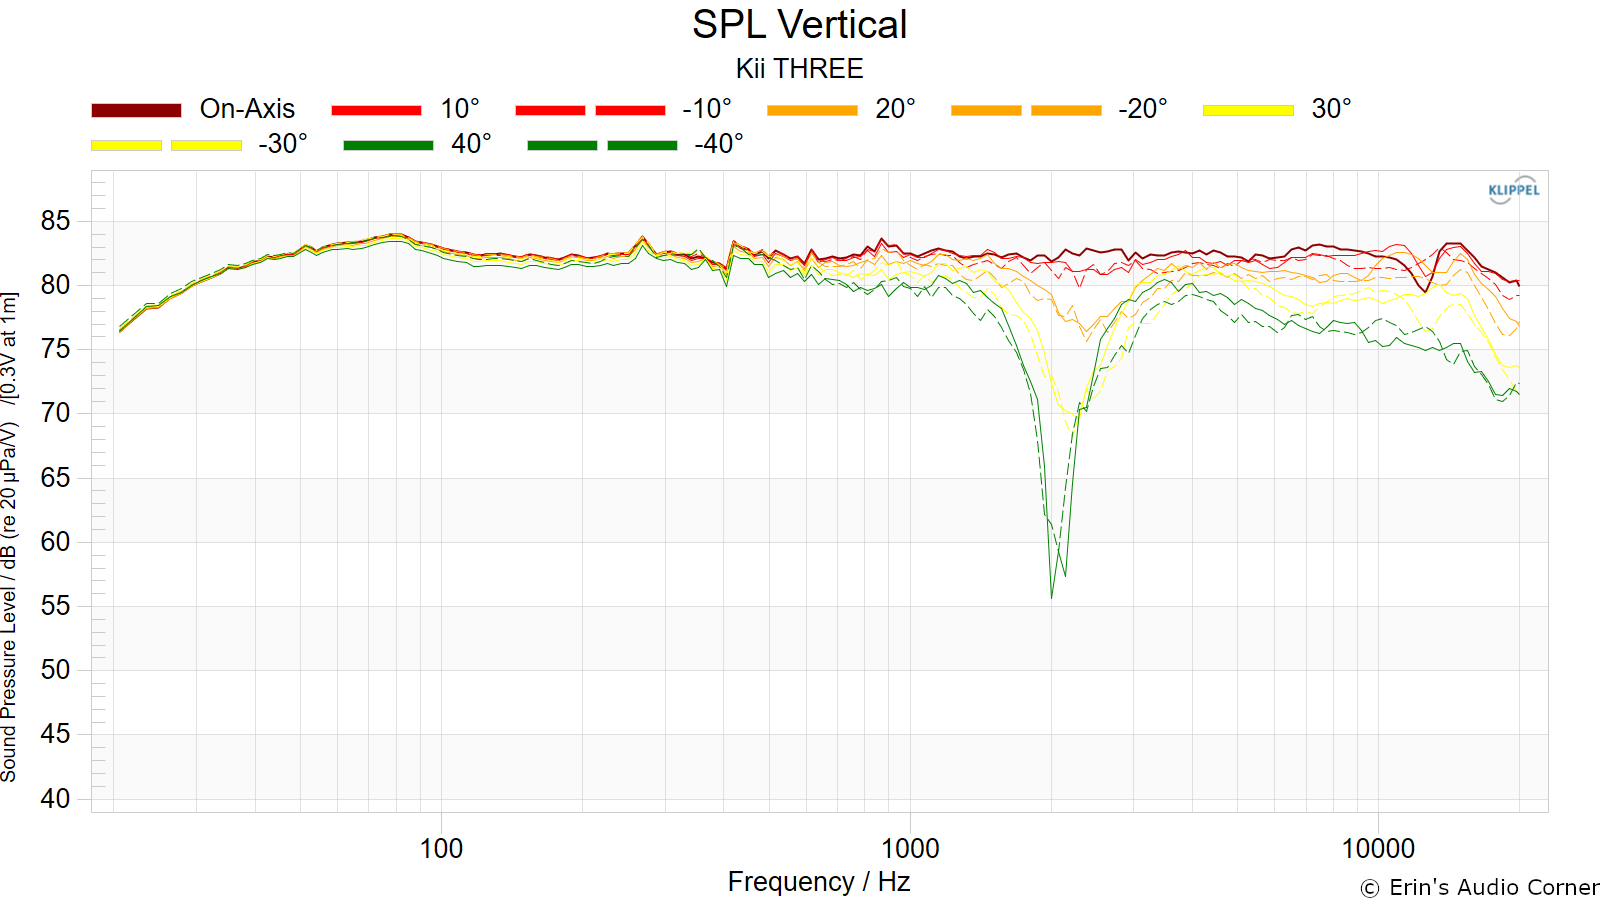
Vertical Frequency Response (0° to ±40°):
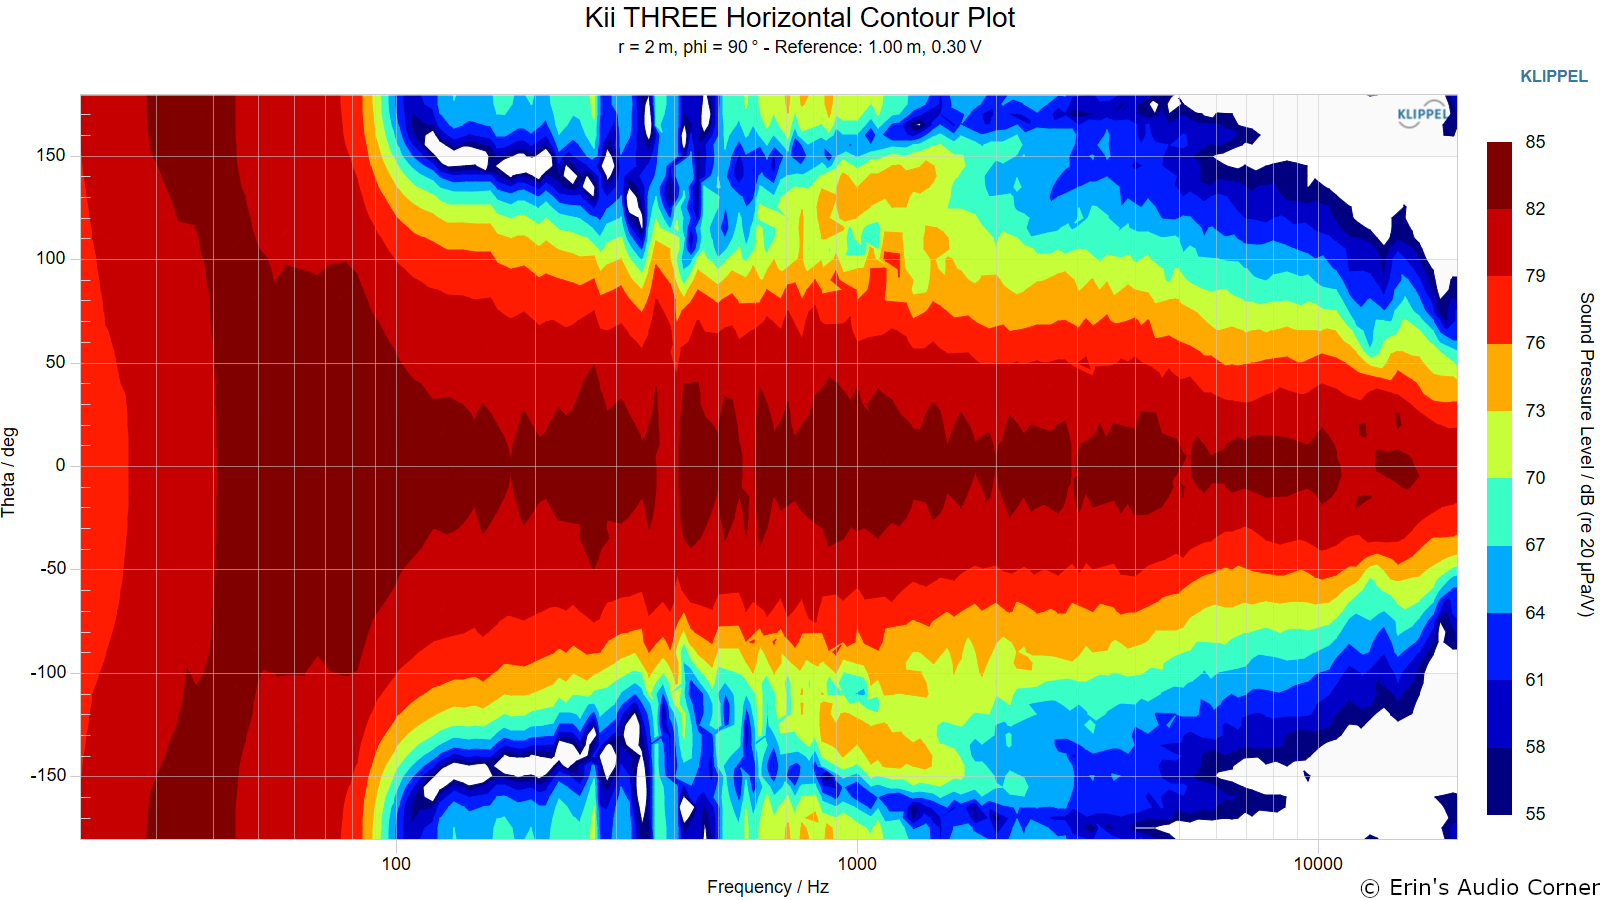
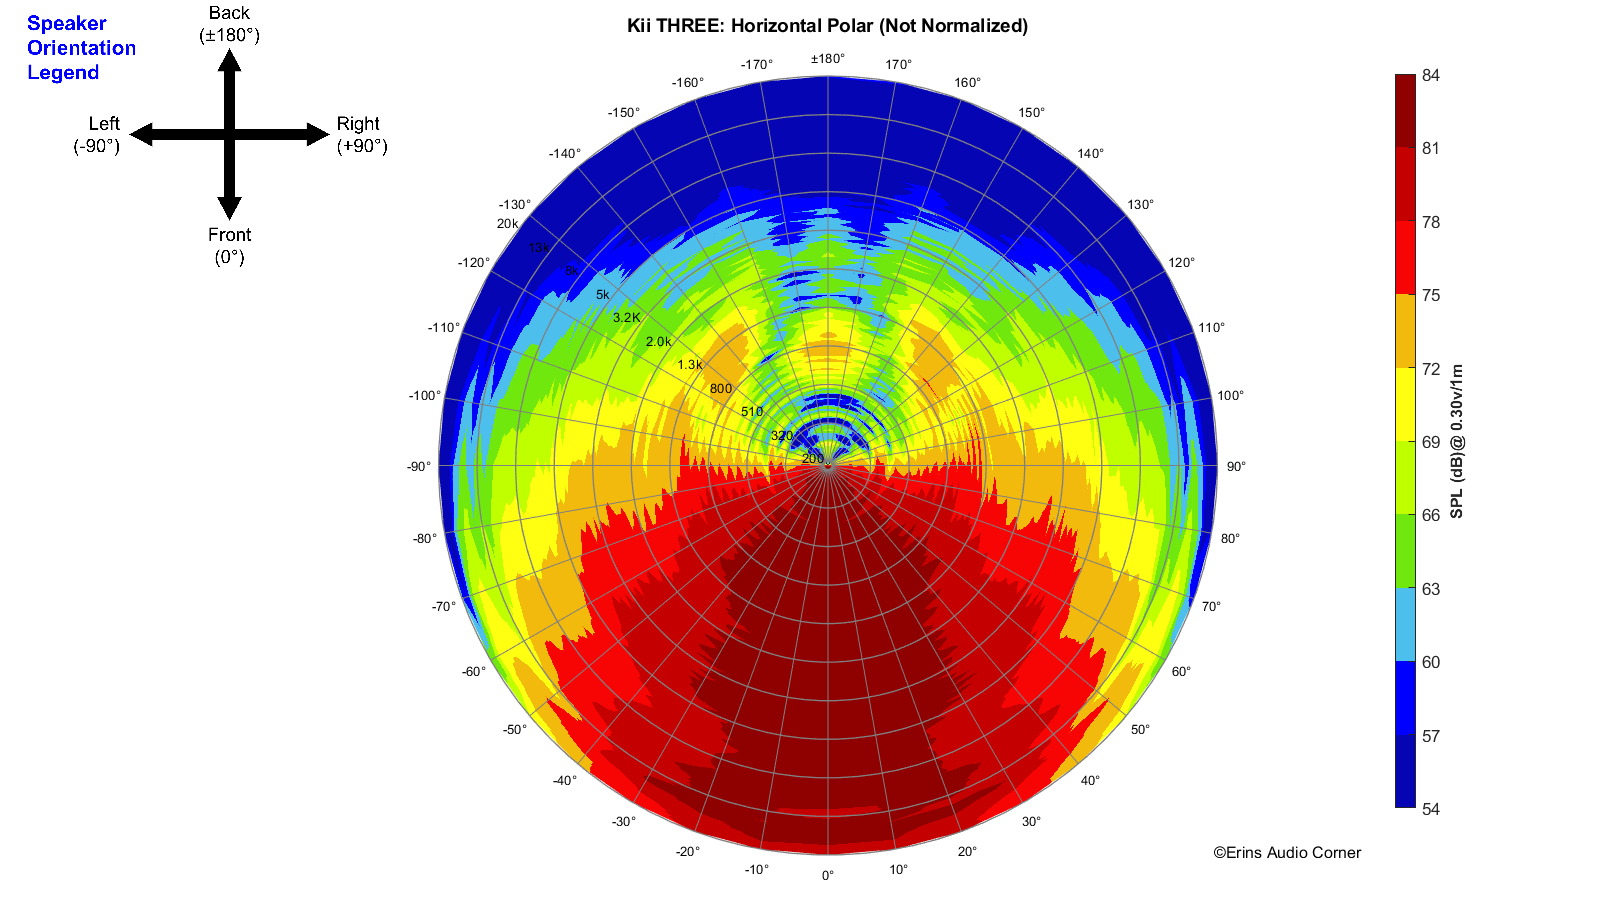
Horizontal Contour Plot (not normalized):
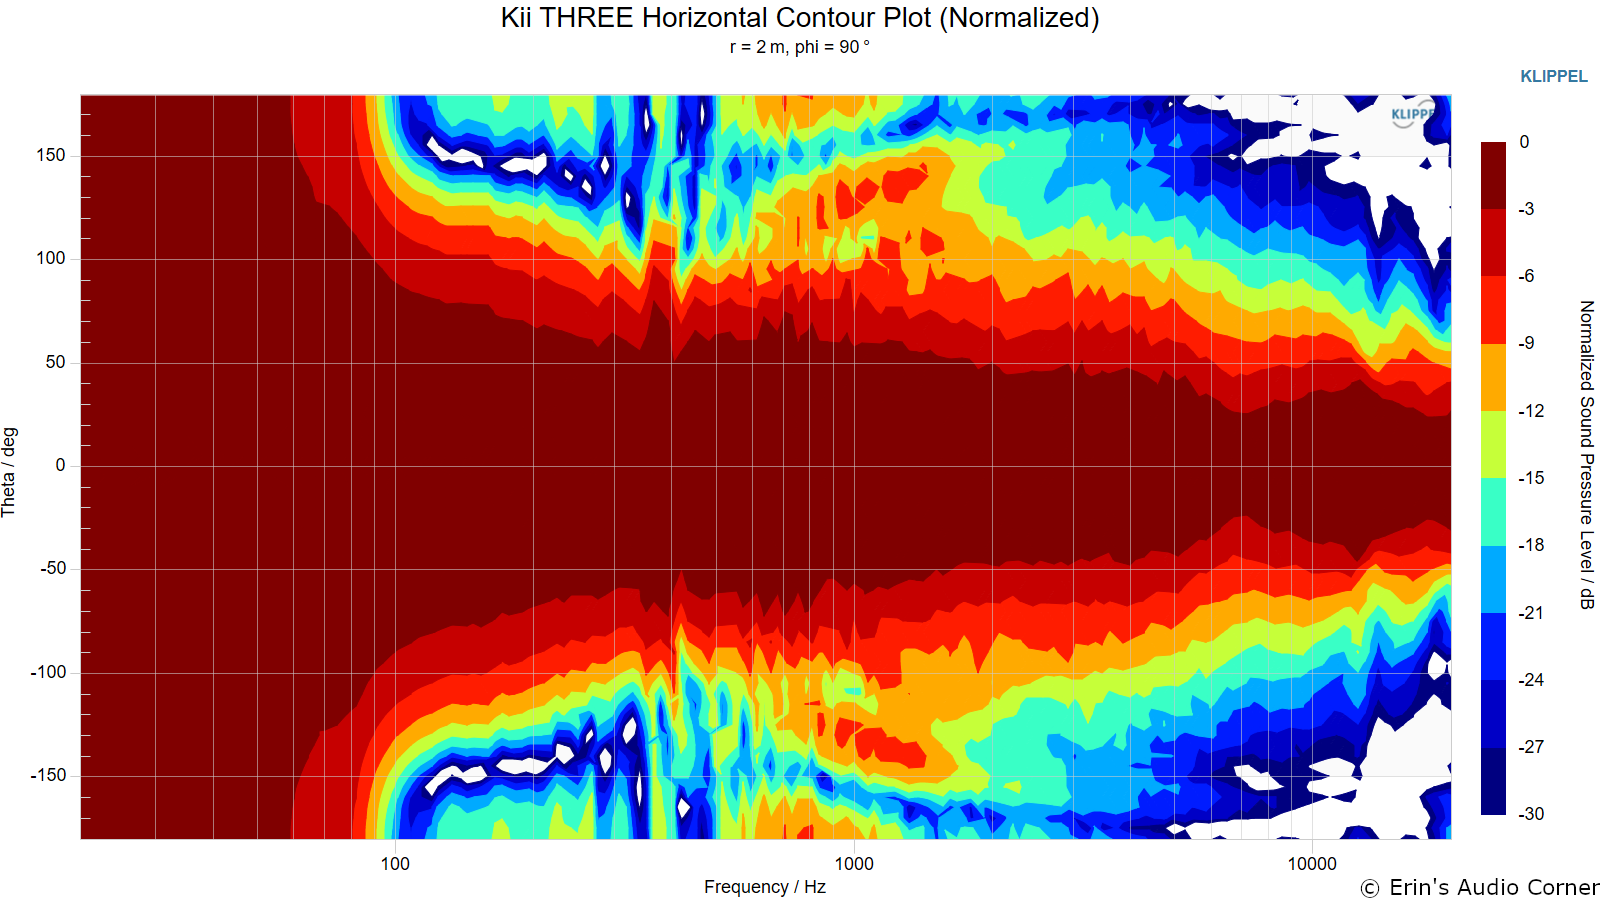
Horizontal Contour Plot (normalized):
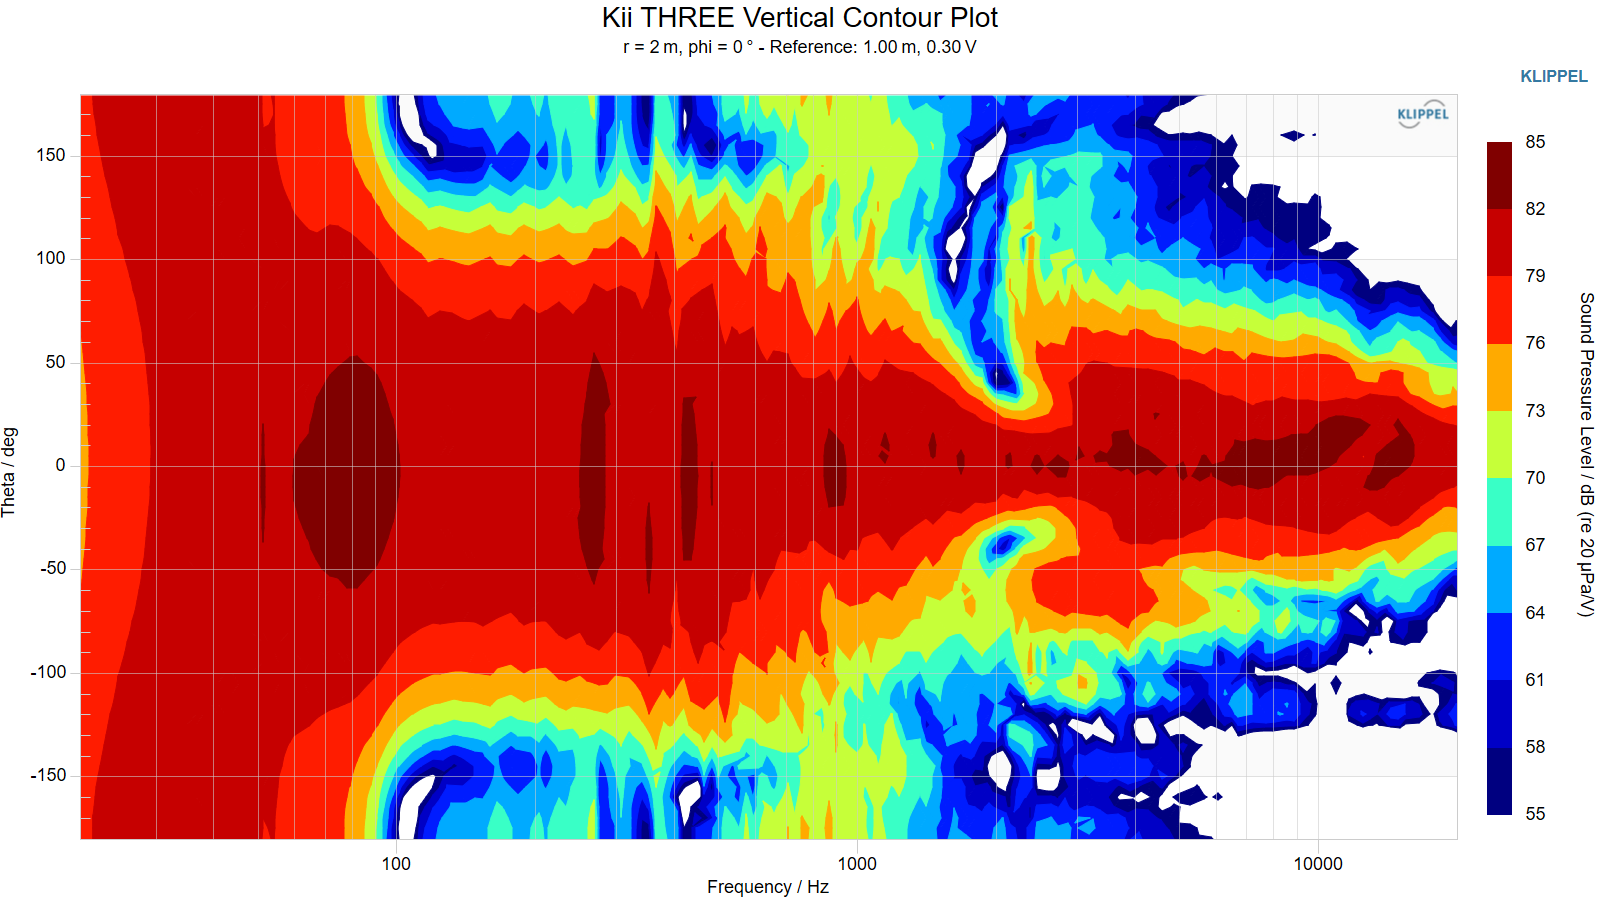
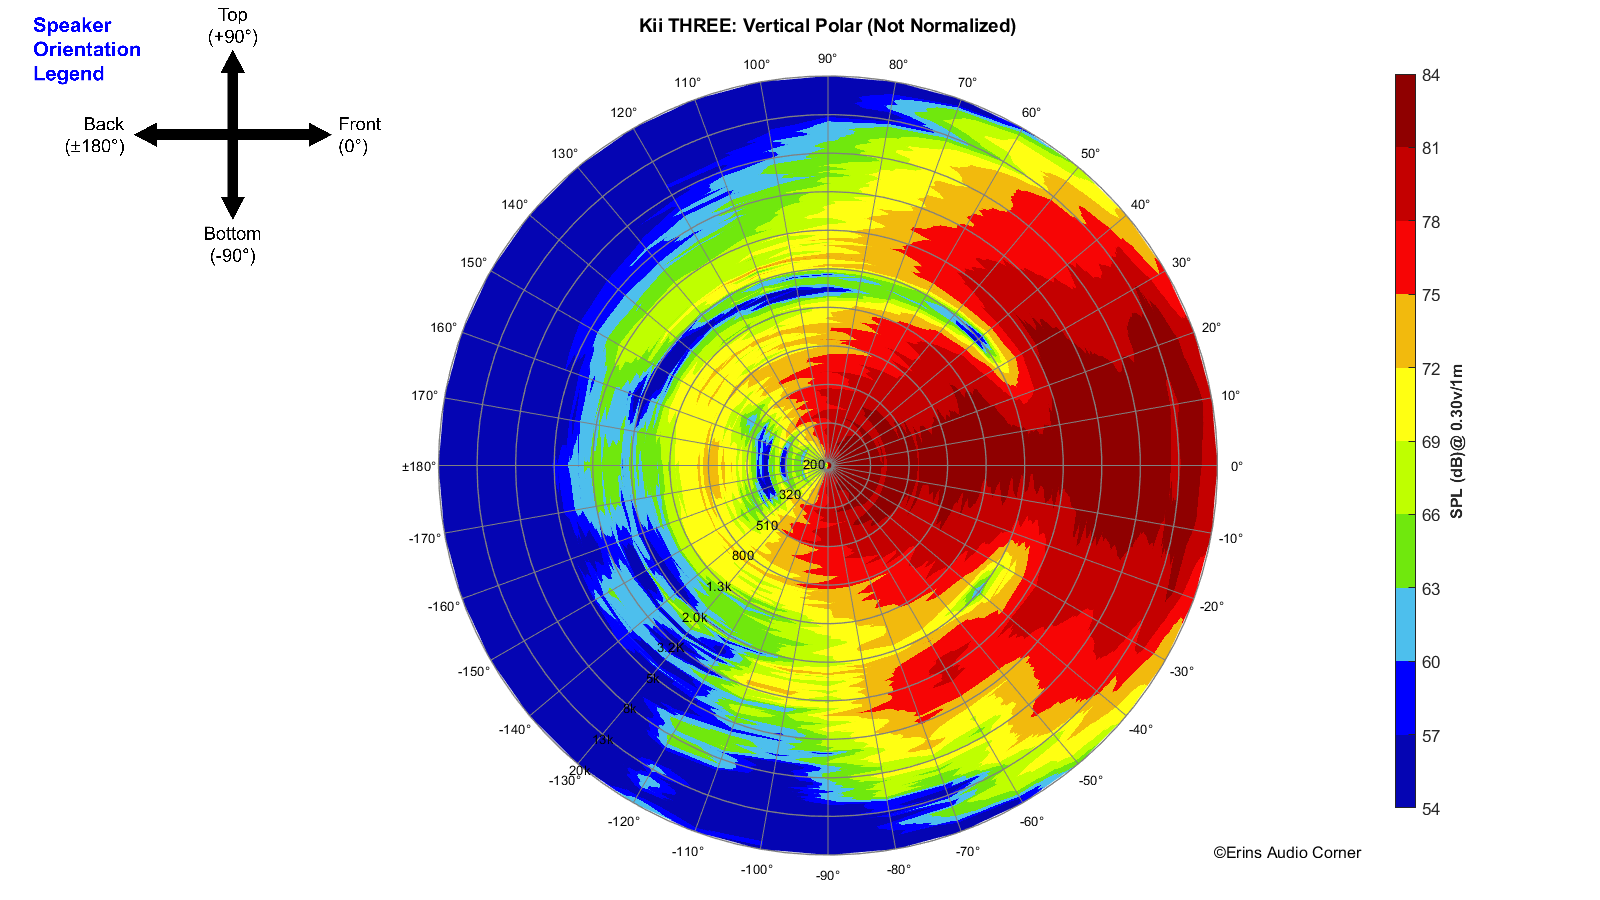
Vertical Contour Plot (not normalized):
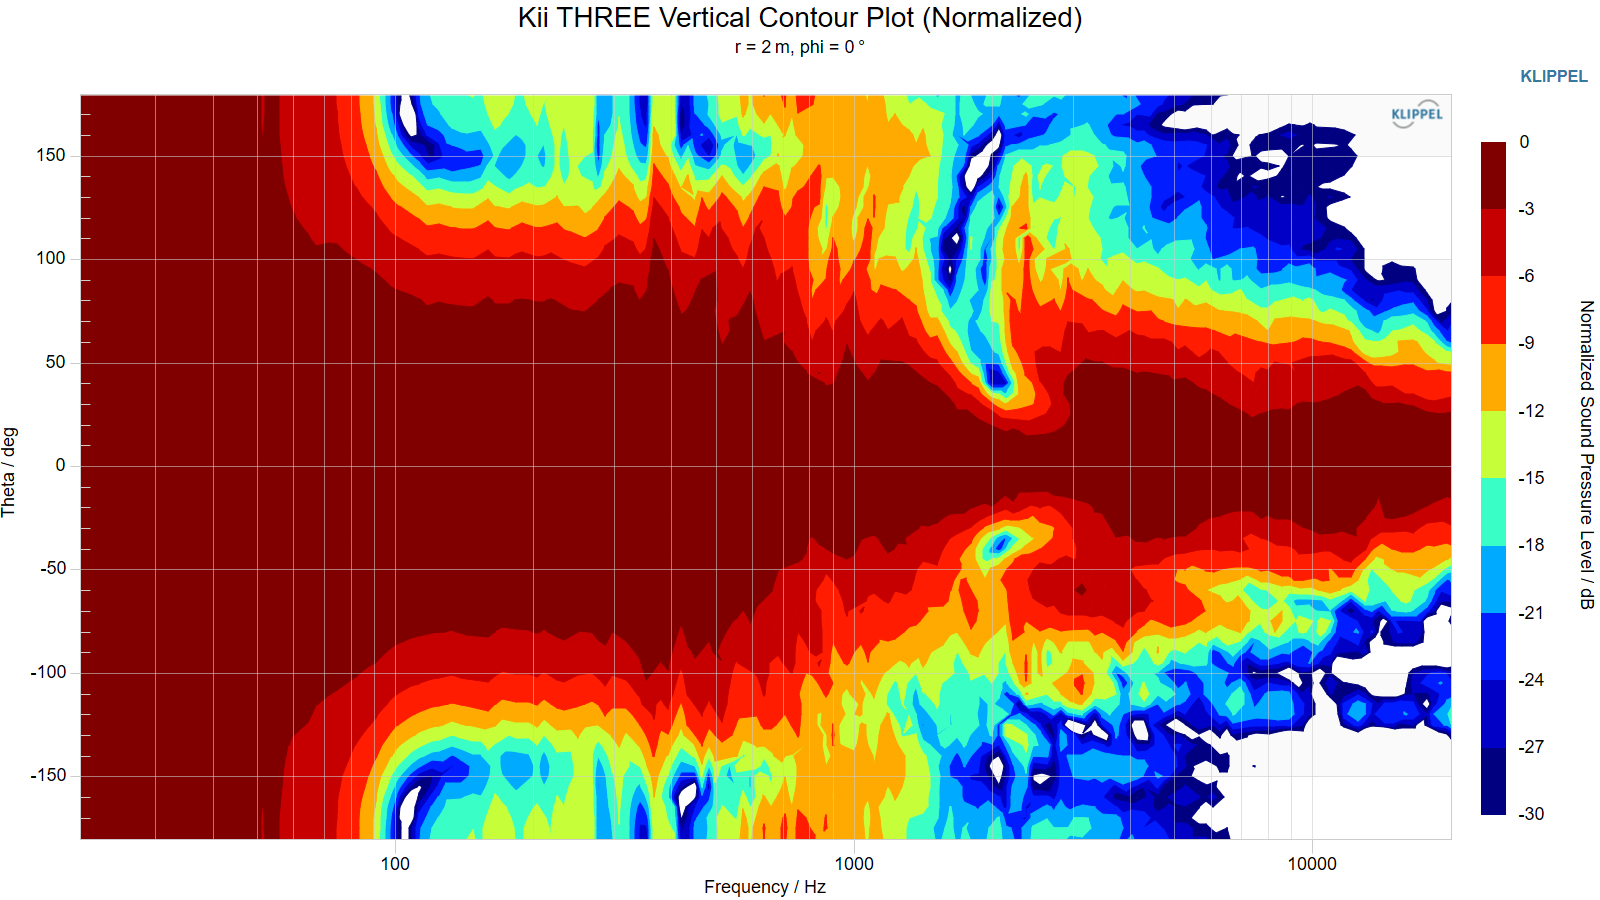
Vertical Contour Plot (normalized):
Additional Measurements
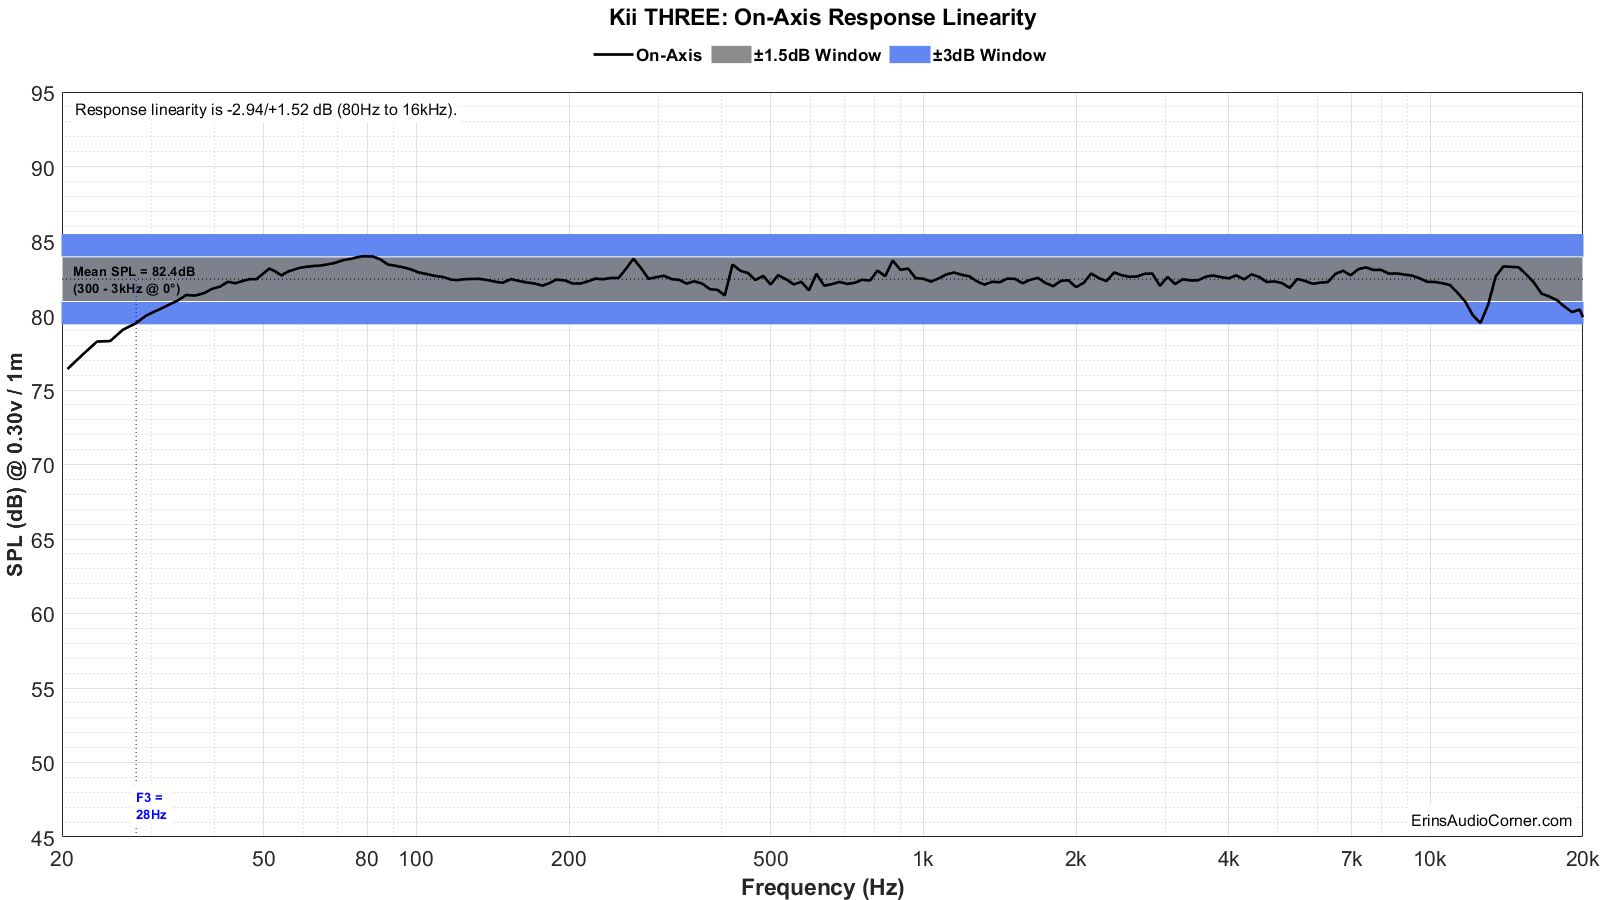
On-Axis Response Linearity
“Globe” Plots
These plots are generated from exporting the Klippel data to text files. I then process that data with my own MATLAB script to provide what you see. These are not part of any software packages and are unique to my tests.
Horizontal Polar (Globe) Plot:
This represents the sound field at 2 meters - above 200Hz - per the legend in the upper left.
Vertical Polar (Globe) Plot:
This represents the sound field at 2 meters - above 200Hz - per the legend in the upper left.
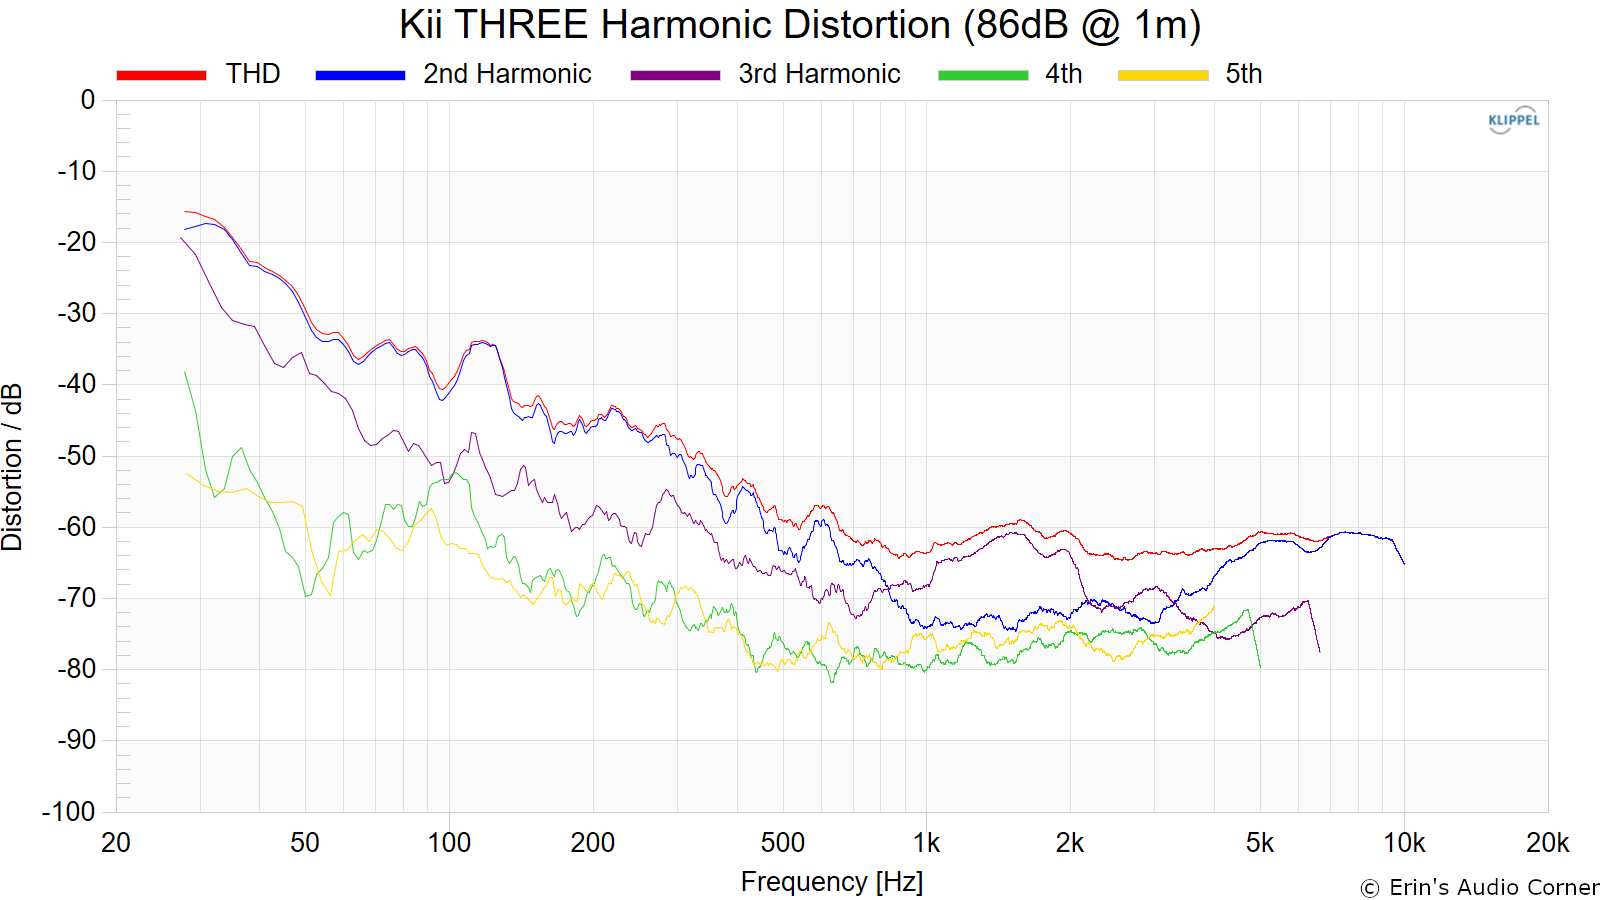
Harmonic Distortion
Harmonic Distortion at 86dB @ 1m:
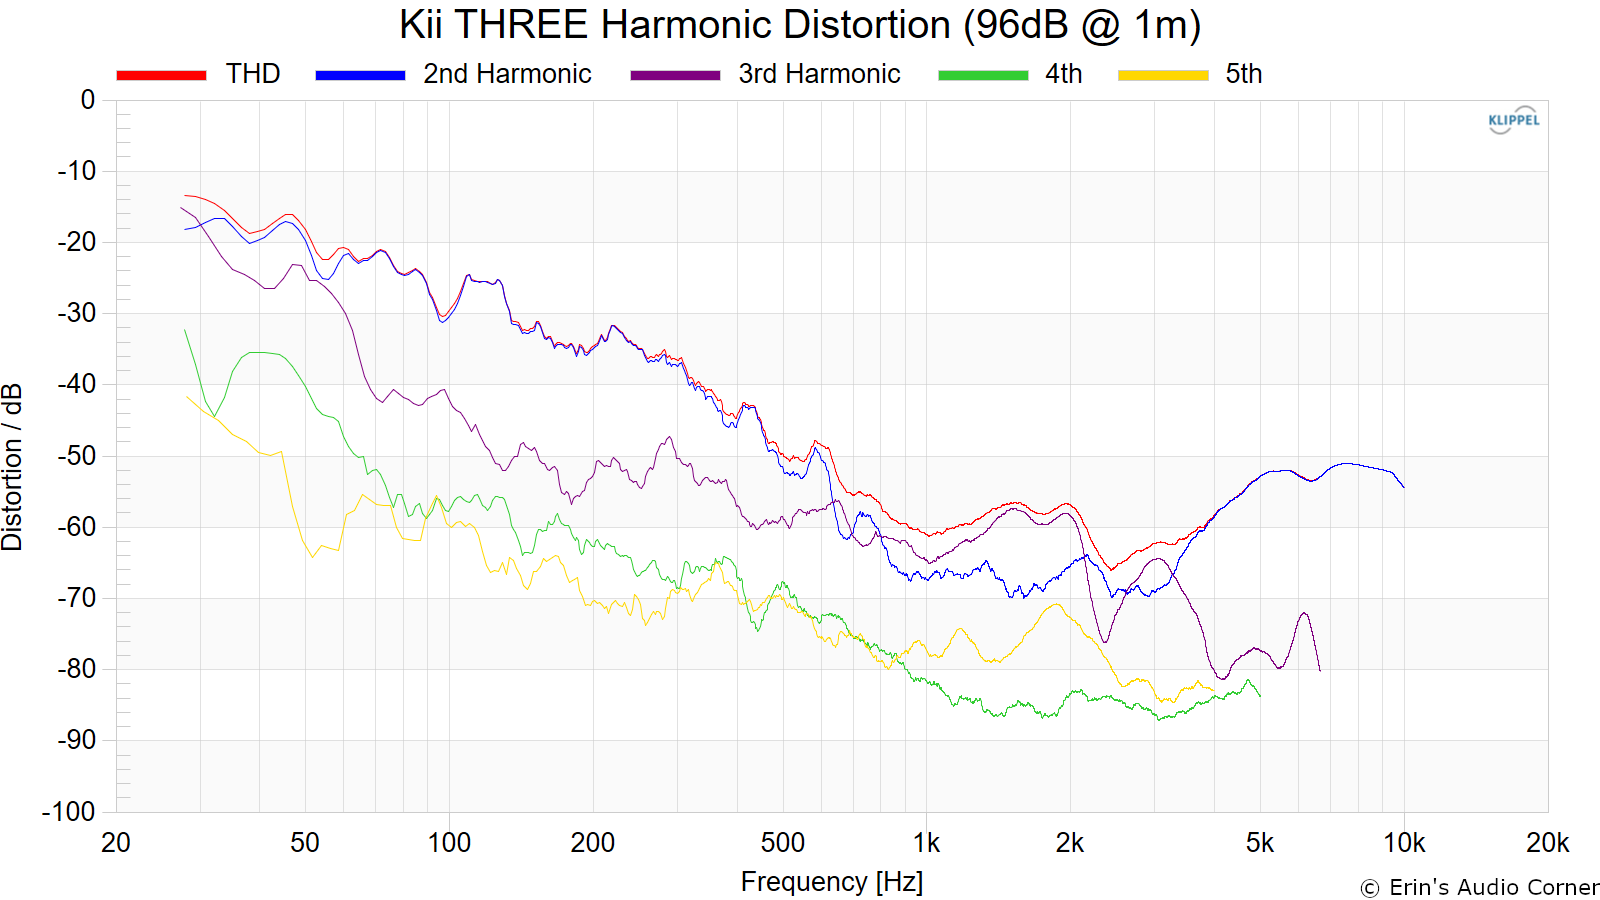
Harmonic Distortion at 96dB @ 1m:
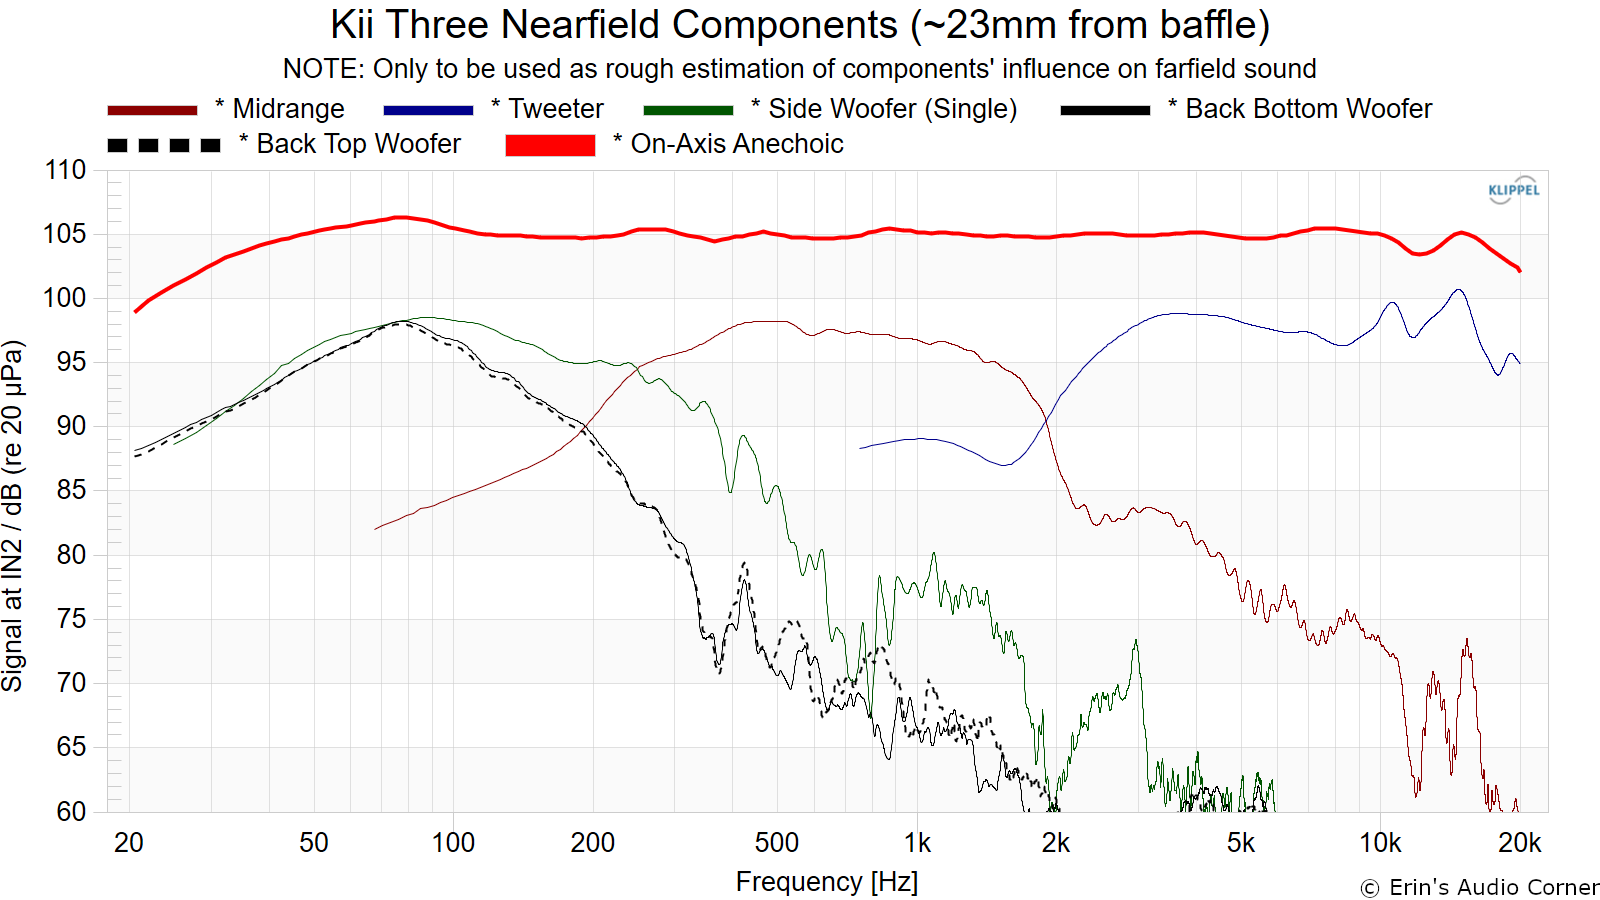
Near-Field Response
Nearfield response of individual drive units:
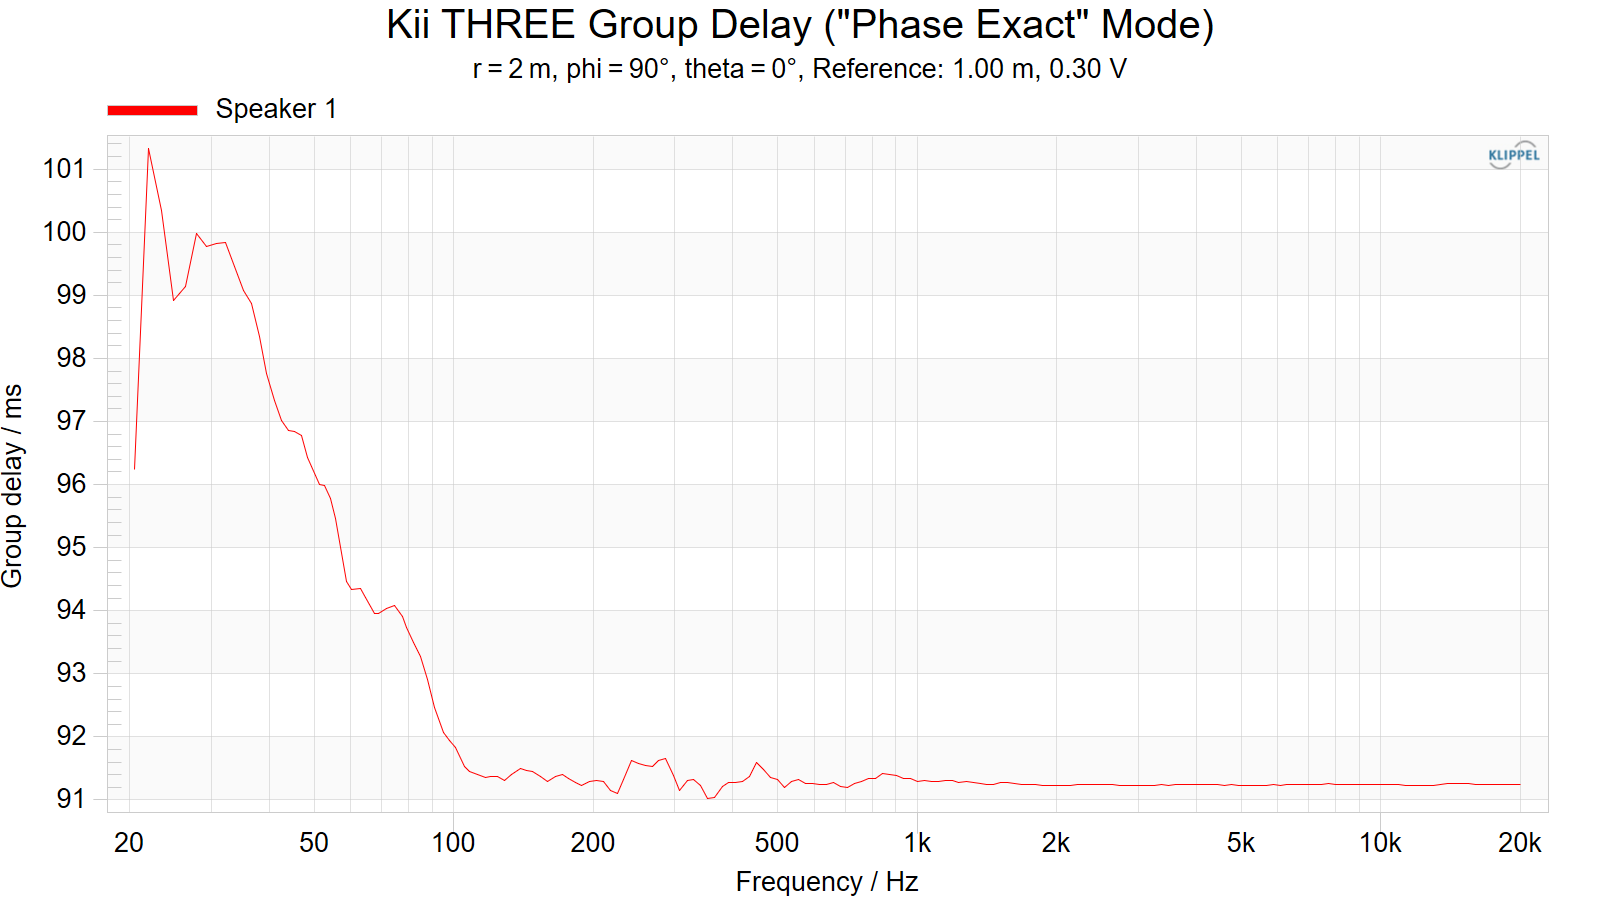
Group Delay (smoothed to 1/3-octave)
Dynamic Range (Instantaneous Compression Test)
The below graphic indicates just how much SPL is lost (compression) or gained (enhancement; usually due to distortion) when the speaker is played at higher output volumes instantly via a 2.7 second logarithmic sine sweep referenced to 76dB at 1 meter. The signals are played consecutively without any additional stimulus applied. Then normalized against the 76dB result.
The tests are conducted in this fashion:
- 76dB at 1 meter (baseline; black)
- 86dB at 1 meter (red)
- 96dB at 1 meter (blue)
- 102dB at 1 meter (purple)
The purpose of this test is to illustrate how much (if at all) the output changes as a speaker’s components temperature increases (i.e., voice coils, crossover components) instantaneously.
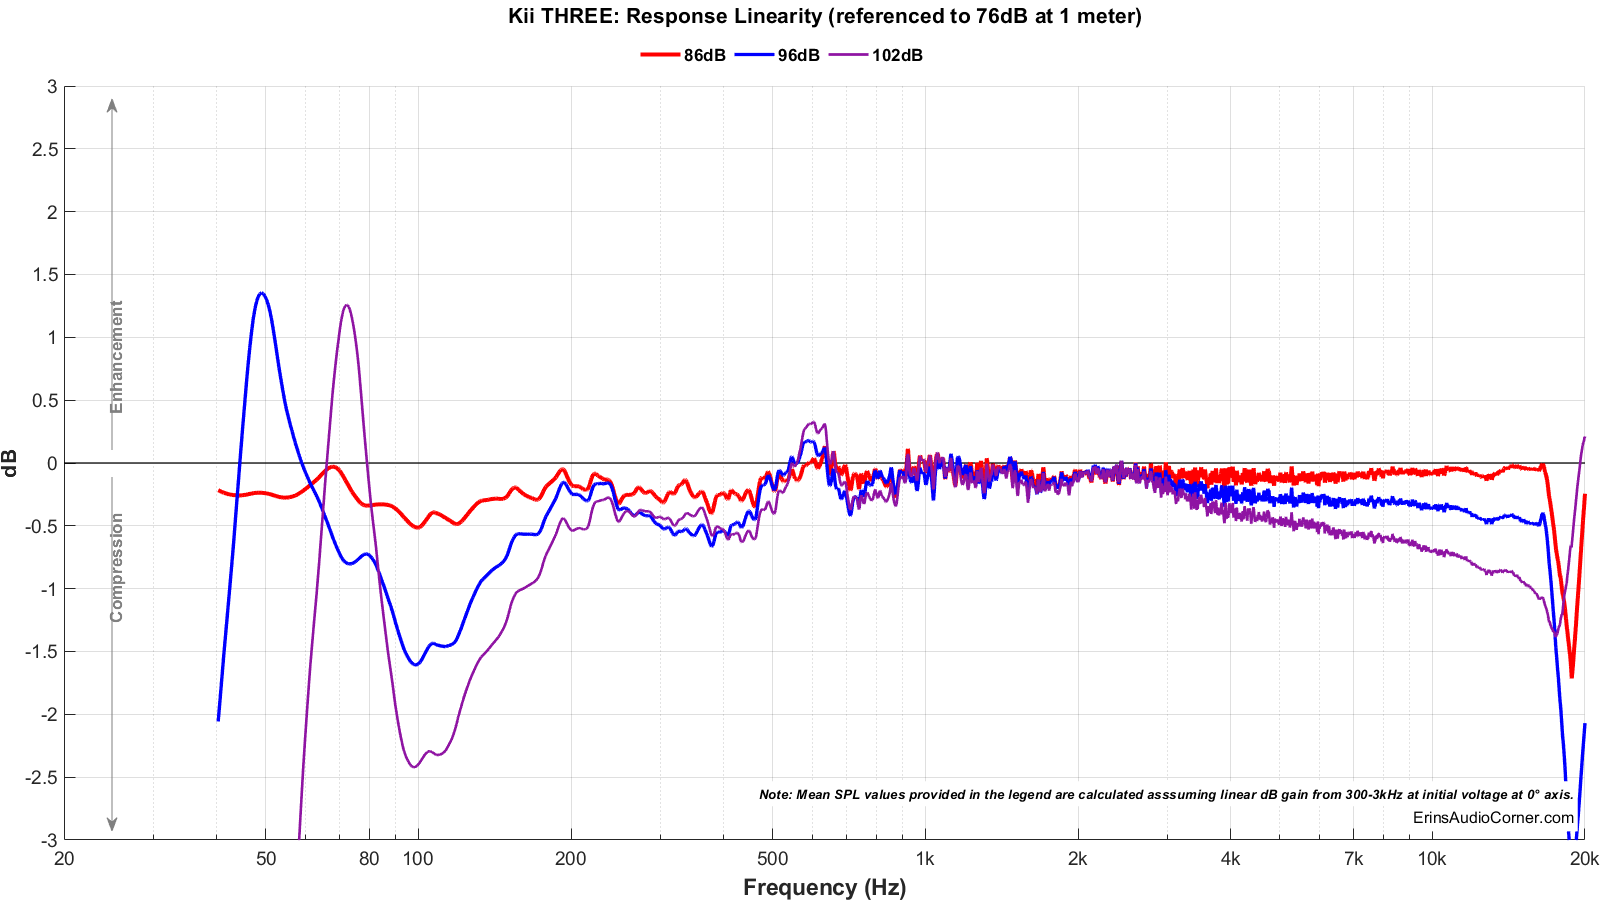
Based on my results above, it is obvious the output is limited (via internal DSP) somewhere above the 96dB @ 1m output level.
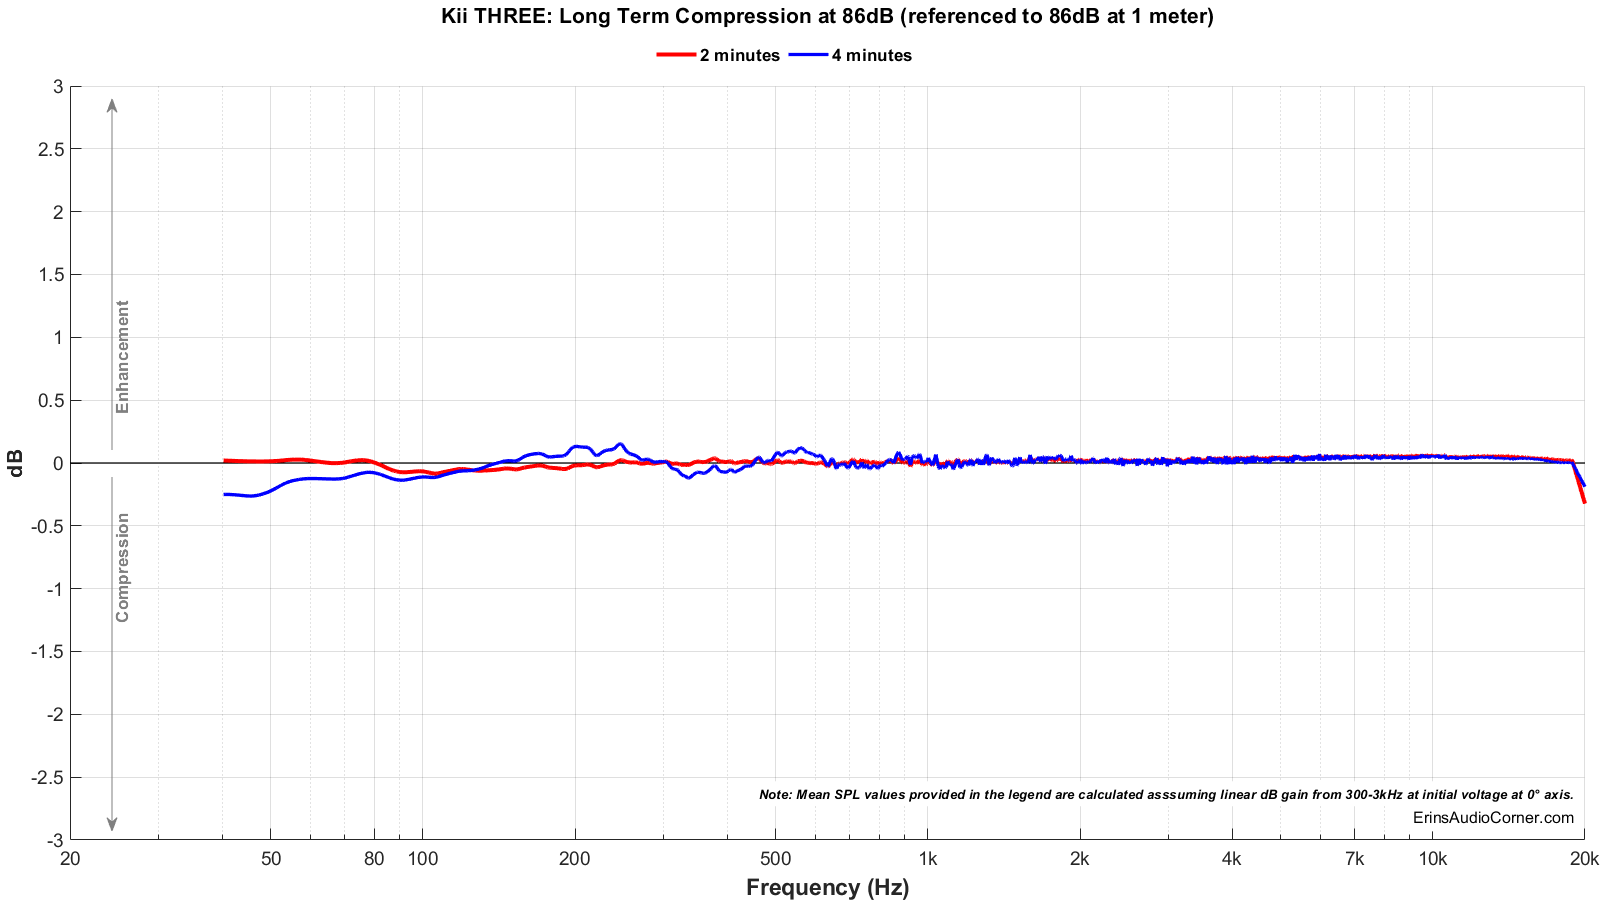
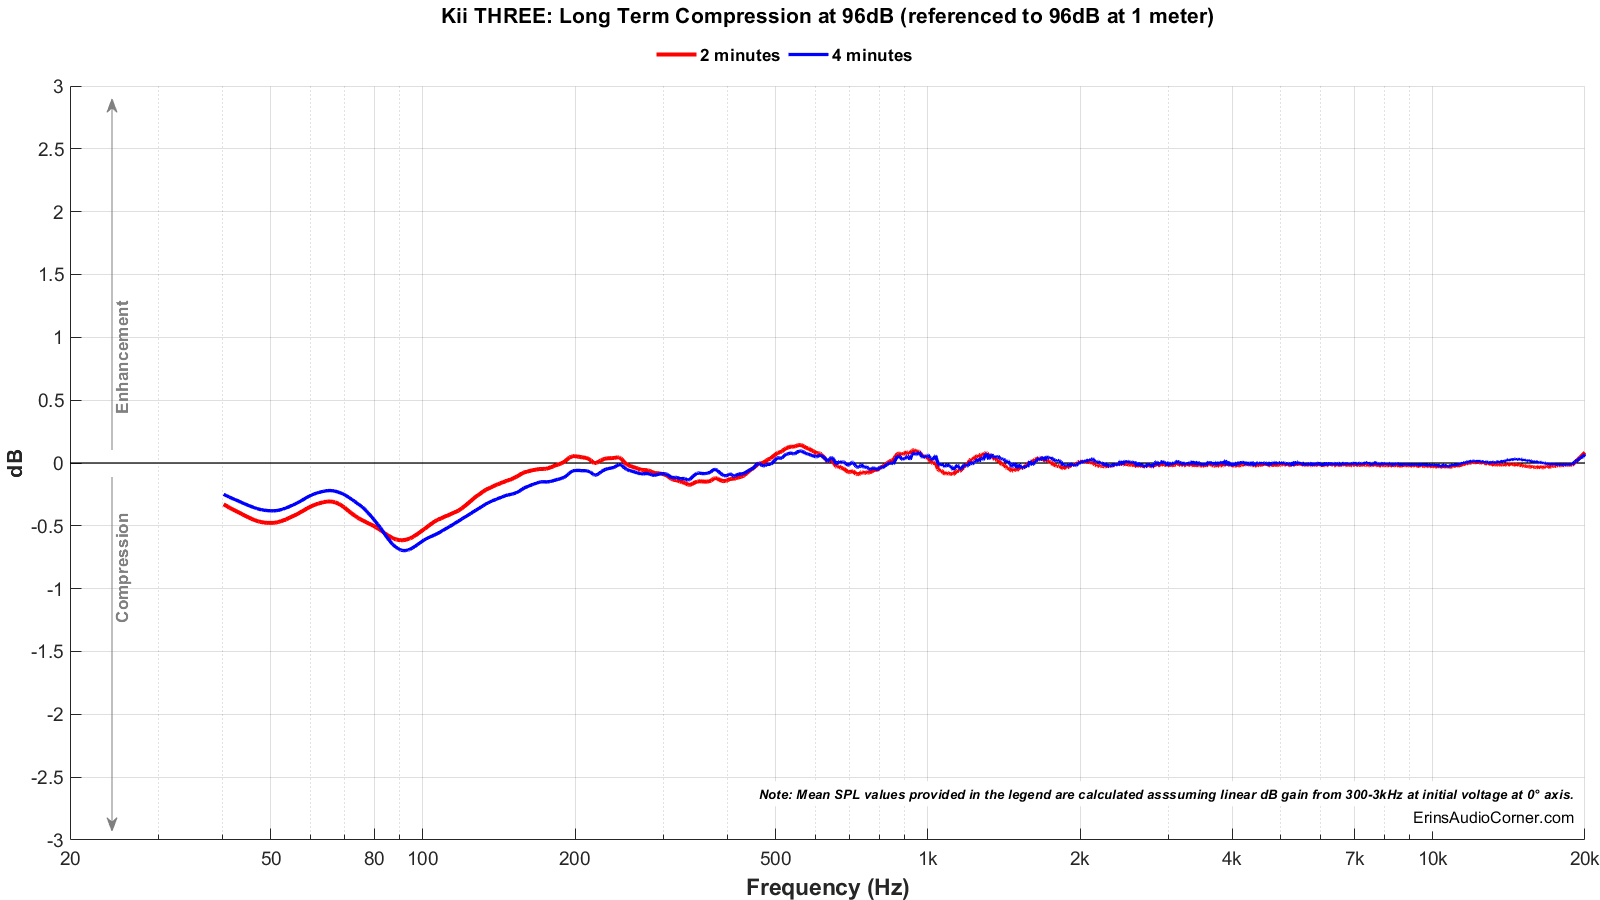
Long Term Compression Tests
The below graphics indicate how much SPL is lost or gained in the long-term as a speaker plays at the same output level for 2 minutes, in intervals. Each graphic represents a different SPL: 86dB and 96dB both at 1 meter.
The purpose of this test is to illustrate how much (if at all) the output changes as a speaker’s components temperature increases (i.e., voice coils, crossover components).
The tests are conducted in this fashion:
- “Cold” logarithmic sine sweep (no stimulus applied beforehand)
- Multitone stimulus played at desired SPL/distance for 2 minutes; intended to represent music signal
- Interim logarithmic sine sweep (no stimulus applied beforehand) (Red in graphic)
- Multitone stimulus played at desired SPL/distance for 2 minutes; intended to represent music signal
- Final logarithmic sine sweep (no stimulus applied beforehand) (Blue in graphic)
The red and blue lines represent changes in the output compared to the initial “cold” test.
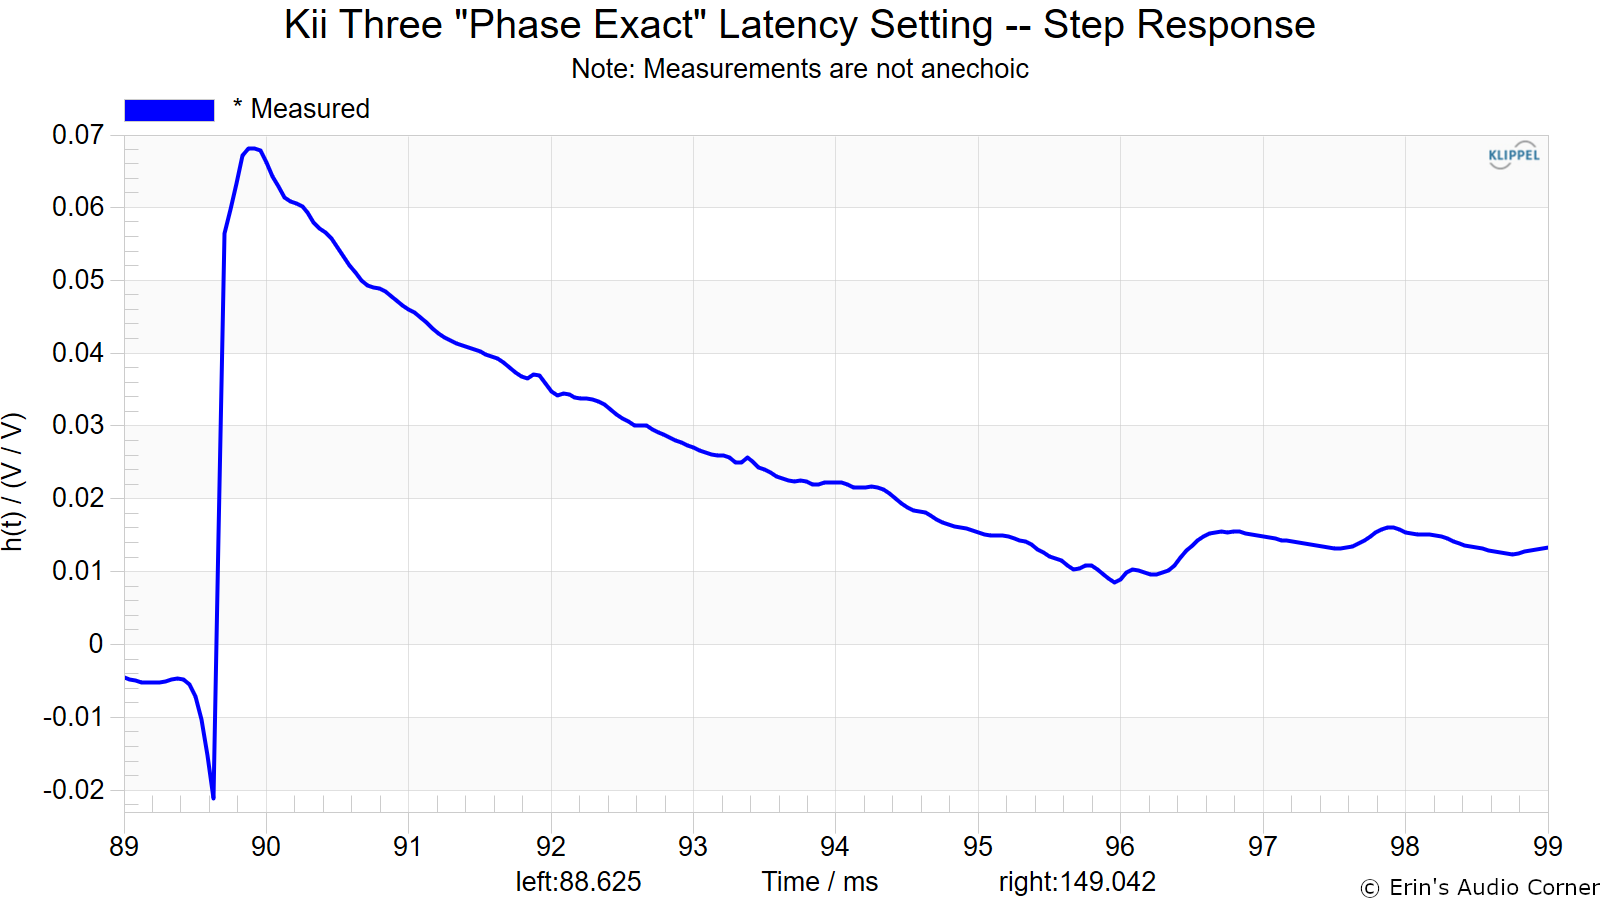
Latency Settings
Per the Kii Audio FAQ:
Some people might want to use their Kii THREE alongside a TV or Beamer to also enjoy their sound qualities when watching a movie or DVD. In some cases the latency that occurs from the extensive DSP calculations within the speakers may actually be too high to be properly compensated by the available settings on your TV or beamer. For this case we offer a special low latency mode for the Kii THREE, which changes some of the filters in the DSP and therefore provides an extremely short (nearly neglectable) latency. The overall sound quality is not as perfect in low latency mode as it is in normal mode (most notably only in the low end), but still provides a very pleasurable listening experience for your TV. Also the ActiveWaveFocusing is still fully intact in low-latency mode, so the speakers keep their cardioid dispersion qualities.
Below are the results of the step response for the two main latency settings.
“Phase Exact”:
“Minimal Latency”:
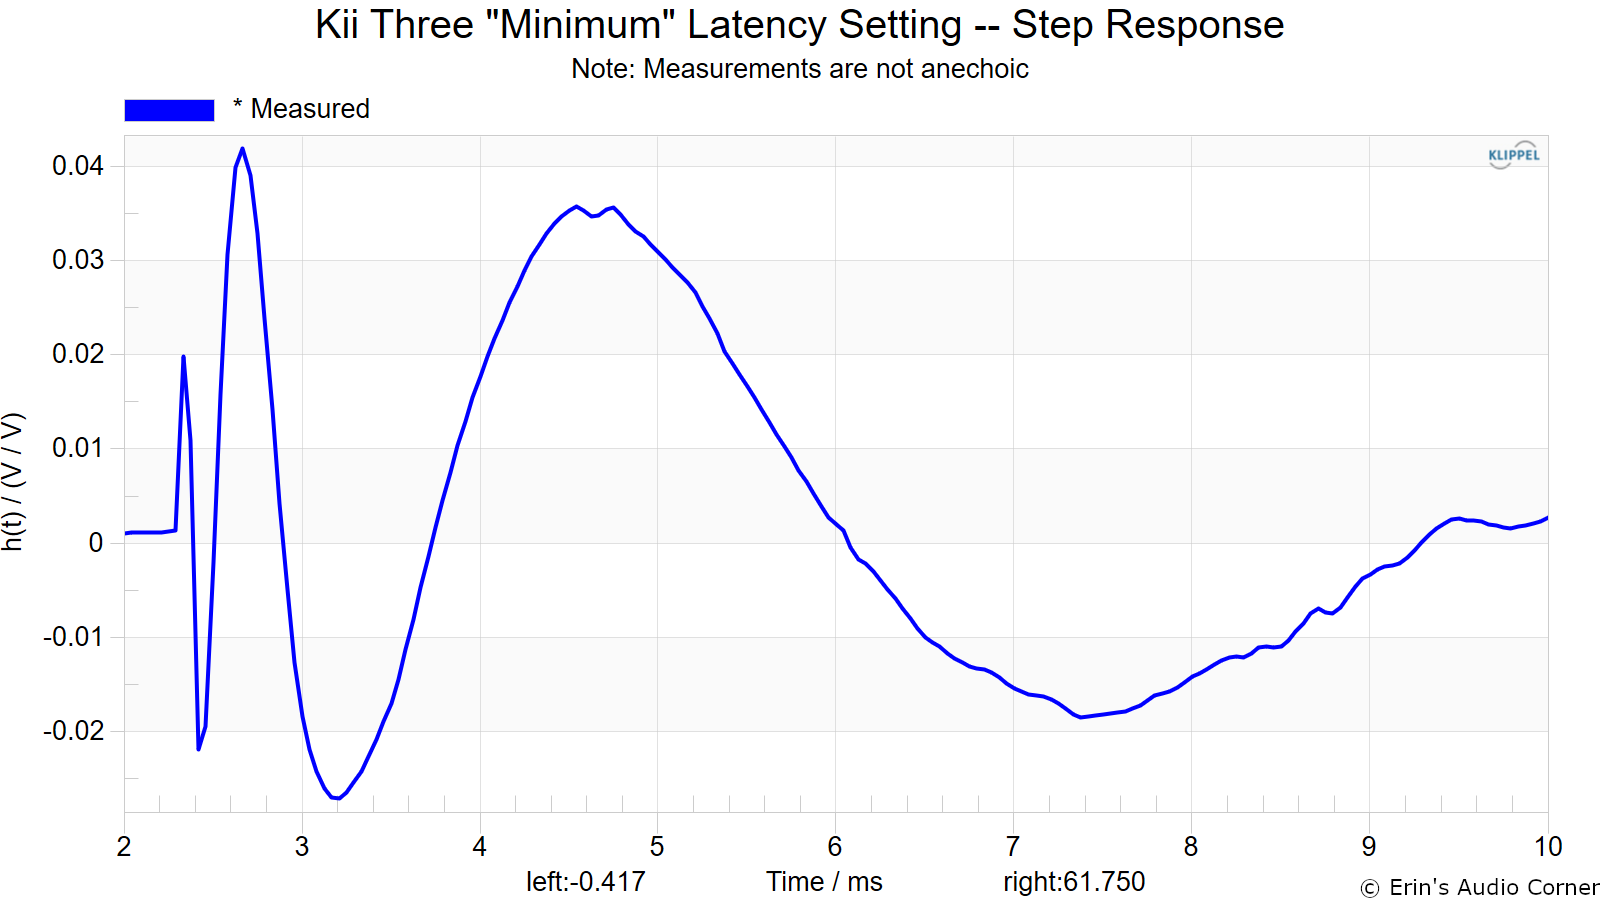
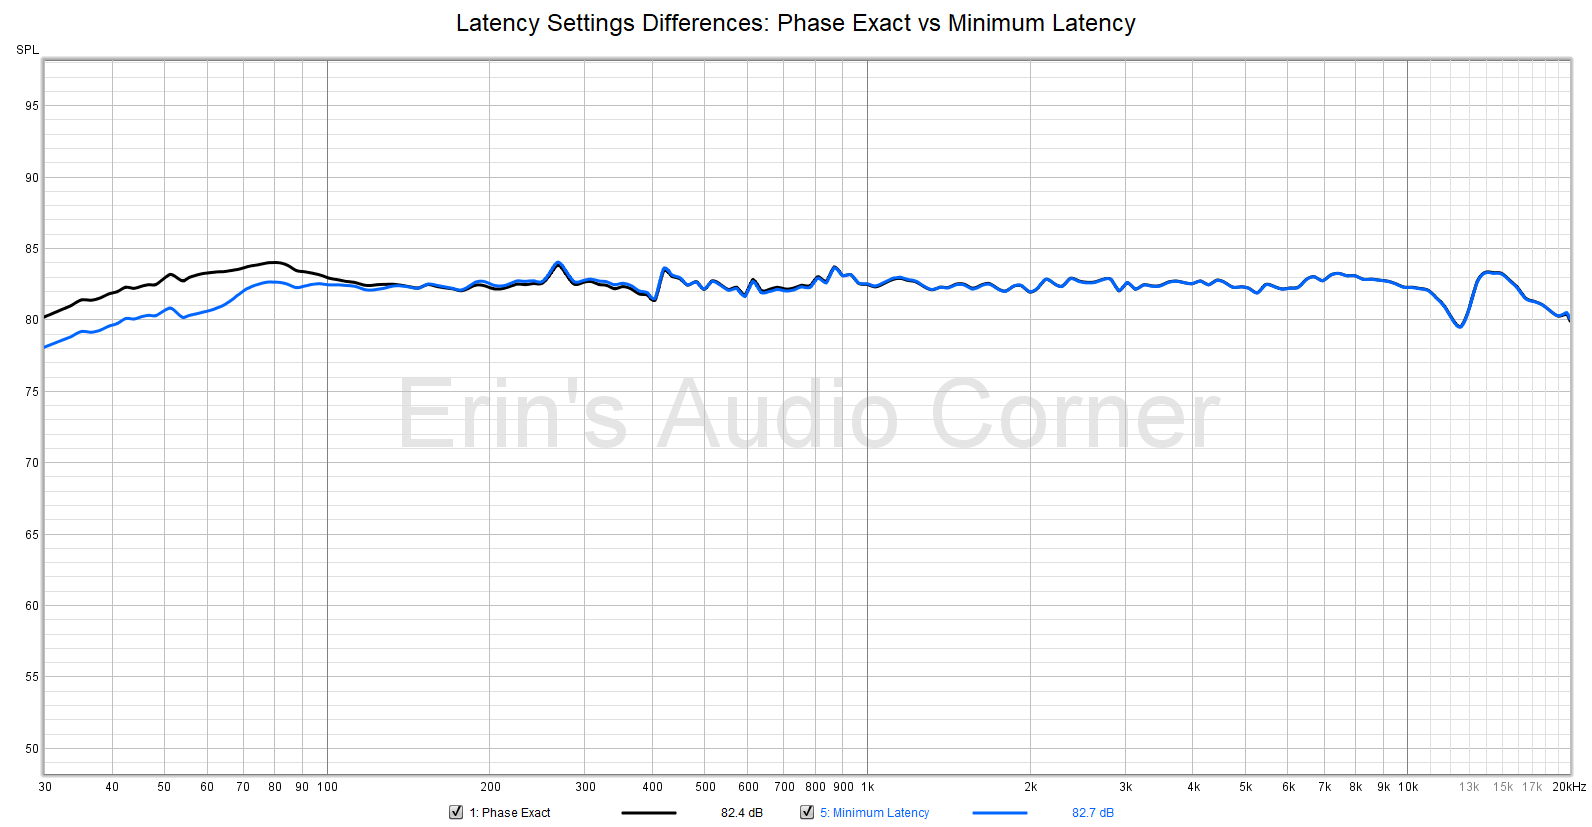
Below is the frequency response (on-axis) of each.
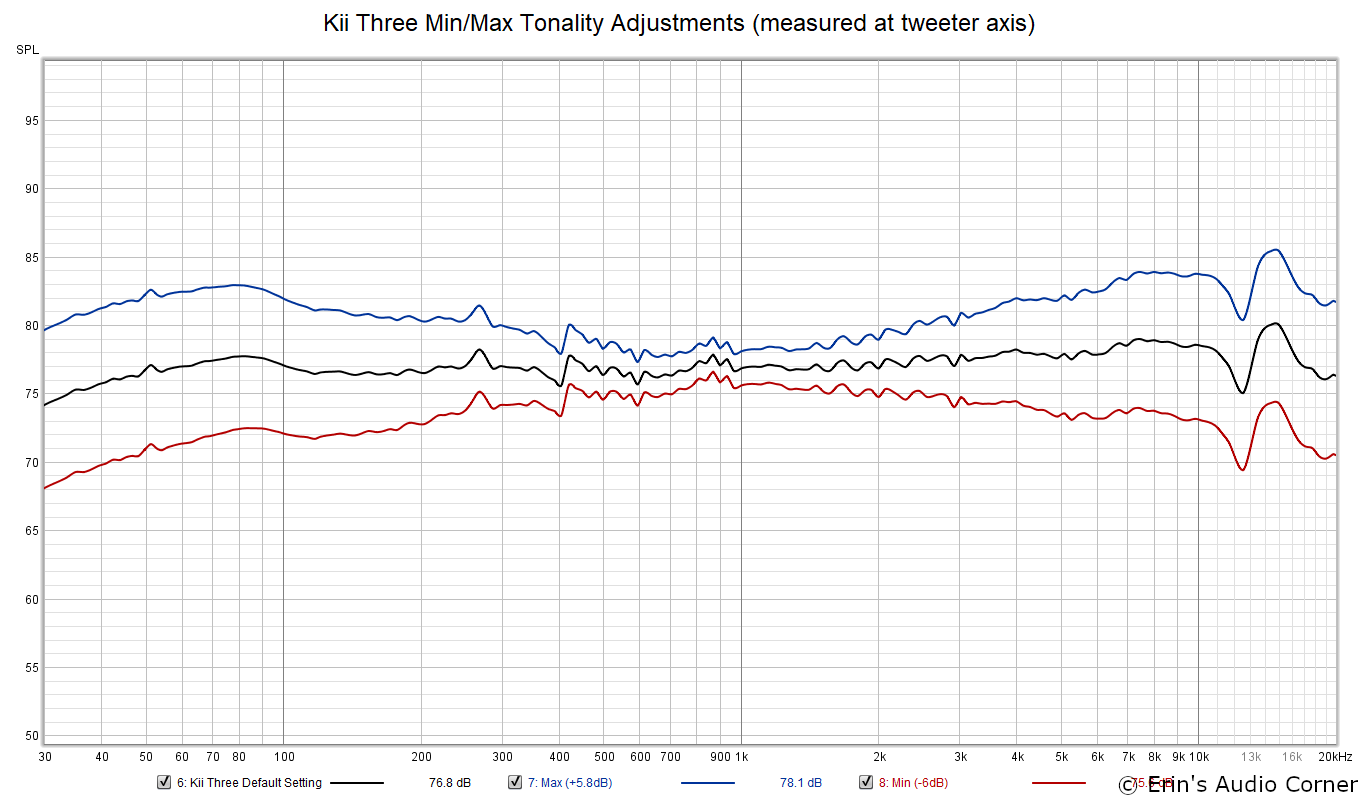
Tonal Balance Adjustments
These are anechoic measurements. The Kii CONTROL settings were left at default and the speaker was measured at the tweeter axis. The CONTROL settings for tweeter and bass levels were set to maximum and minimum, then measured with the comparison shown in the graphic below.
In-Room Measurements from the Listening Position
The speakers were placed approximately 80cm from the front wall (note: I have built-in cabinets; the speaker was roughly 10cm from the cabinet but 80cm from the wall itself). The listening position was approximately 4 meters from the speakers.
Below is the actual measured in-room response (with no DSP correction applied). This is a spatial average taken over approximately 1 cubic foot. As you can see, the actual in-room response aligns quite well with the prediction generated from the SPIN data. Pretty cool to see how anechoic measurements can reliably predict the actual in-room response. I feel many others often overlook this powerful benefit of the SPIN data.
- Black = Predicted In-Room Response from SPIN data
- Blue = Actual In-Room Measured Response from Main Listening Position (speakers aimed on-axis)
- Red = Actual In-Room Measured Response from Main Listening Position (speakers aimed 10° off-axis)
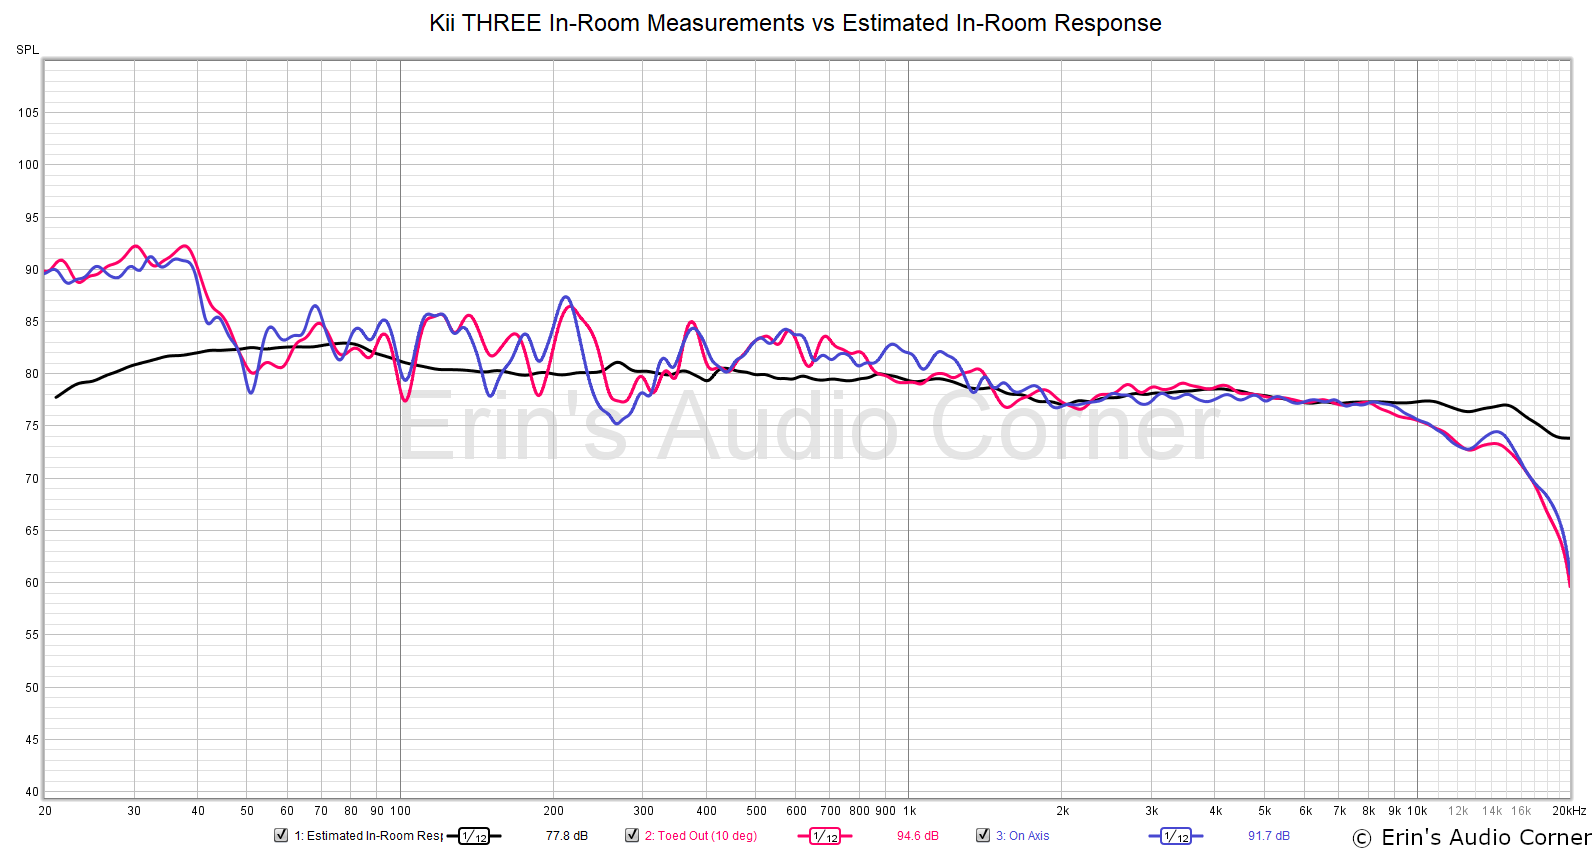
Below 1kHz we see more deviation from the prediction. This is expected. My couch, the back wall behind where I sit, the end table and the lamp near the listening position all have an effect on the measured response. The thing I notice here, though, is just how well behaved the room modes are above 100Hz. There are a few but they are much less severe than other in-room measurements I have taken of past speakers. One has to think this is attributed to the cardioid nature of these speakers.
Notice the amount of low bass. There is nearly 8 to 10dB of gain, flat down to 20Hz. This means there is plenty of headroom in the low bass and serves to counteract the limiter’s effect when the speaker is placed near a boundary - per its design.
Cardioid Performance
Conventional speakers are omnidirectional at low frequencies and become more directional at higher frequencies. Omnidirectional means that the sound is radiated 360° around the speaker. More directional means that the sound is “focused” more forward than it is behind or to the sides. Most bookshelf and floorstanding speakers are omnidirectional from 20Hz up to 400-500Hz. Sometimes higher; sometimes lower. This is usually dictated by the size of the drive units and baffle used in the speaker.
A cardioid speaker - like the Kii THREE - is designed to not be omnidirectional above a certain frequency, and in the case of the THREE that frequency is between 70-90Hz (depending on where you ‘draw the line’). Why would this be useful? Well, remember, the Kii THREE features subwoofers on the rear of the speaker. These subwoofers depend on boundary reinforcement in order for the response to extend as low as possible in frequency. The issue, typically, would be rear-wall reflections. If the Kii THREE had the upper midbass and lower midrange frequencies radiating backwards then there would be a high degree of sound traveling rearward only to be reflected off the rear wall and back to the front of the speaker causing comb filtering in these lower frequencies. In terms of sound, this can (and typically does) result in marred tonality, loss of impact and imaging in the mid-to-low frequencies at the listening position.
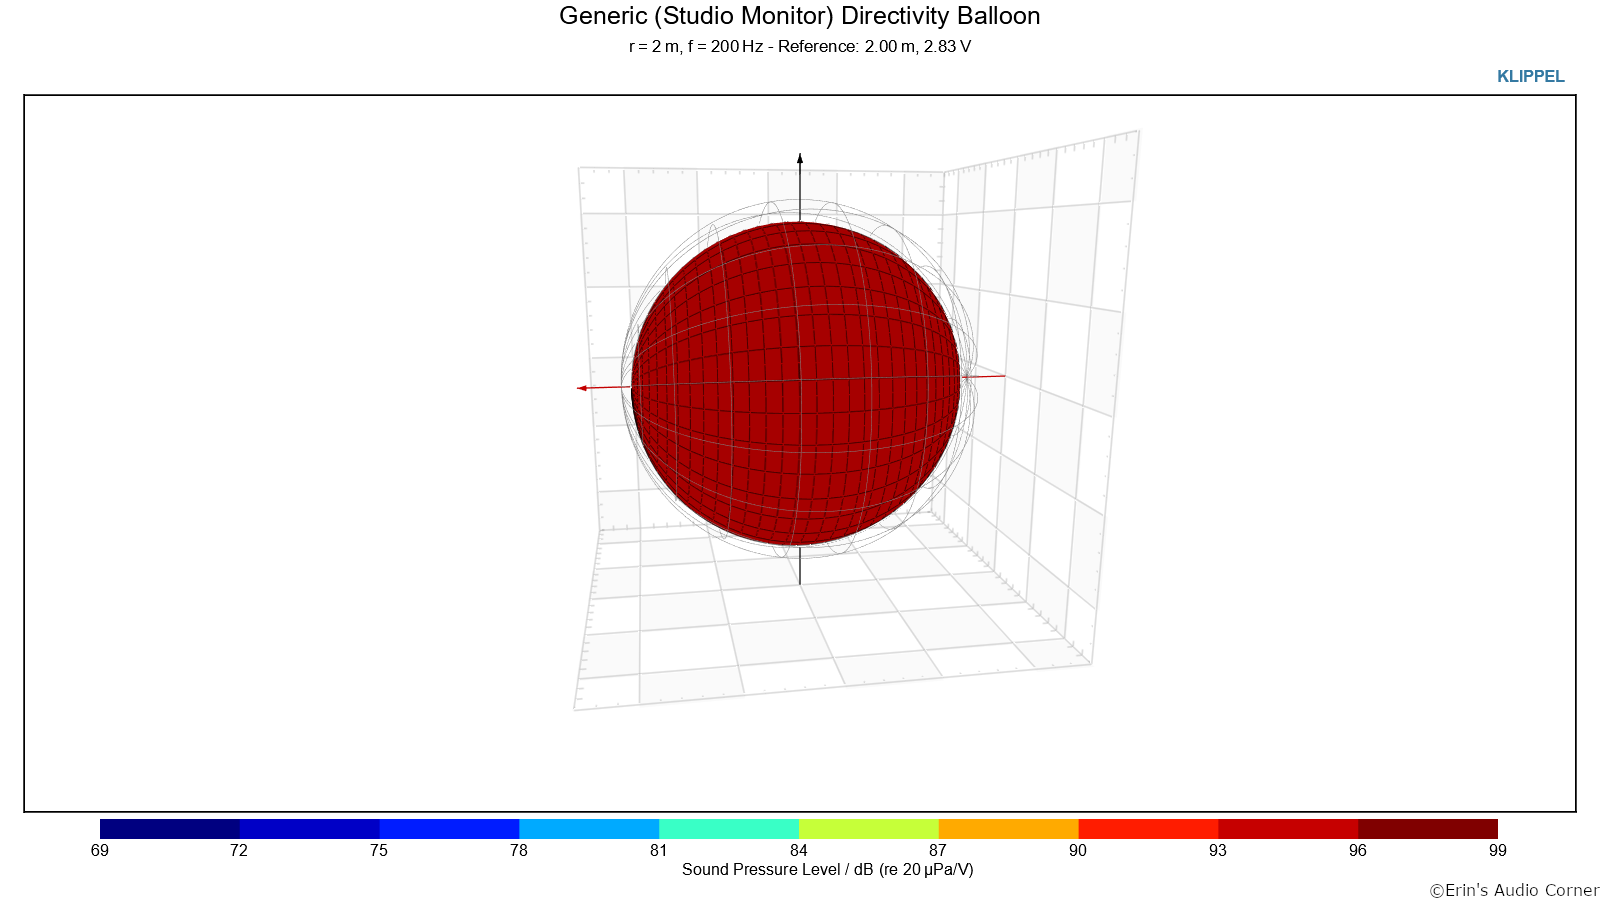
How well does this actually work, though? Well, let’s take a look at the typical response of a generic studio monitor at 200Hz. The below graphic is a plot of the sound field of said speaker at 200Hz and certainly even lower in frequency. This was generated using Klippel’s Near-Field Scanner and Visualization module. The story here is the sound is a big ball of energy, radiating in all directions. In front (illustrated by the red arrow), backwards, up and down. This energy is all practically the same SPL, too. Nothing new here. Typical of a standard monopole speaker.
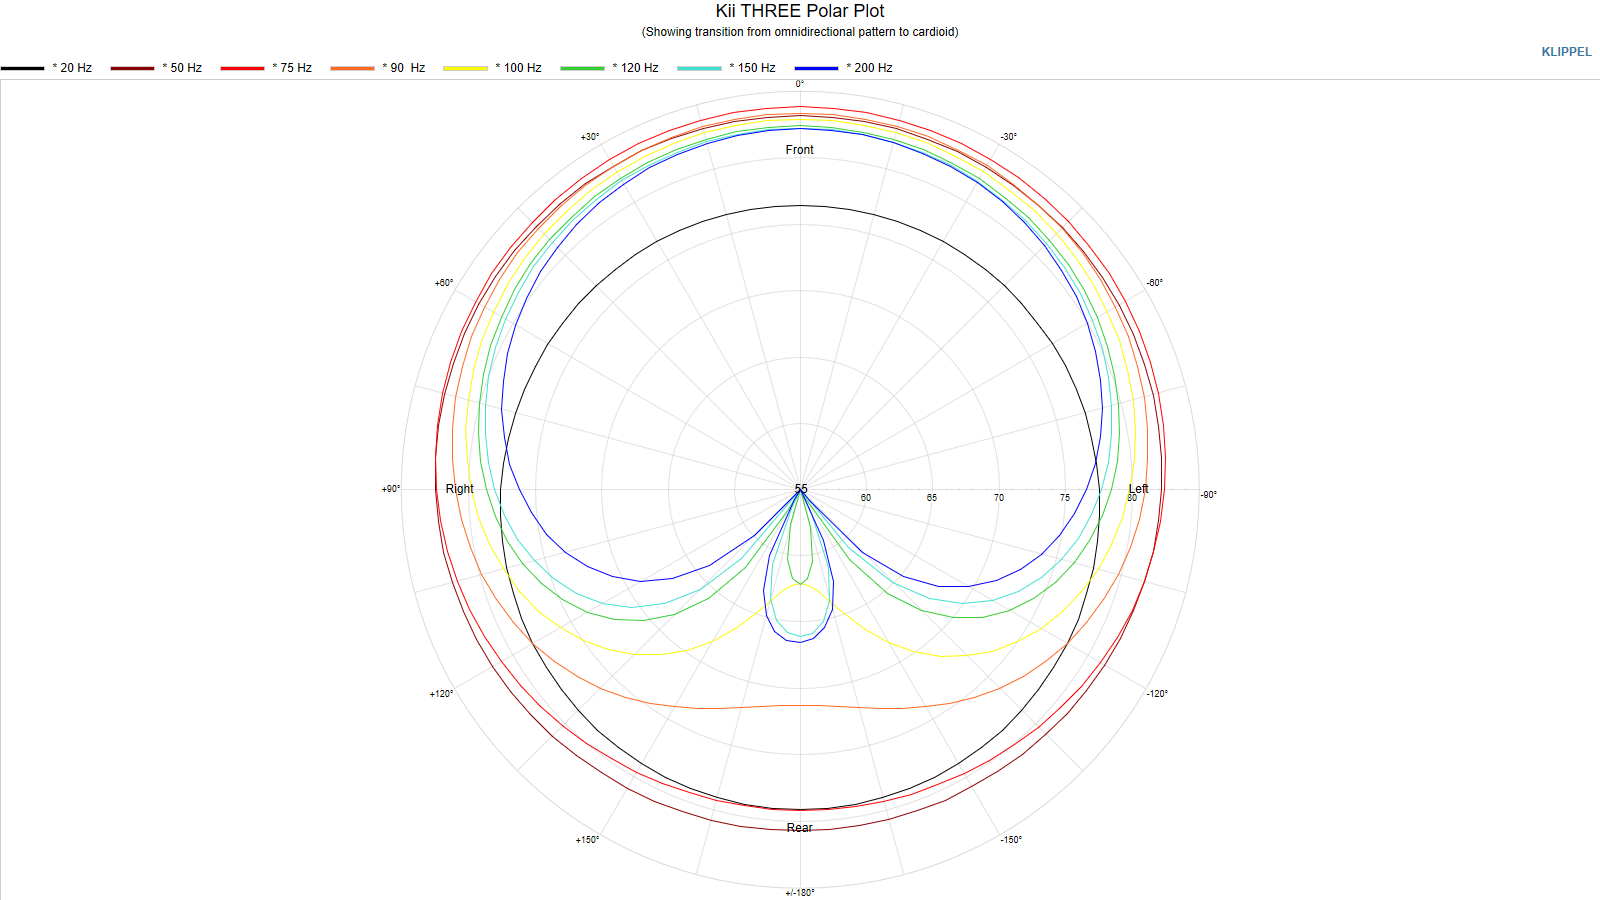
Now, let’s look at the response of the Kii THREE from 50Hz to 200Hz, below. At as low as 100Hz, what we see here is in stark contrast to the above. The first thing that stands out is there is practically zero sound radiating backwards (opposite of the red arrow) at 200Hz. And what energy is back there is roughly 10-15dB down in level relative to what is firing forward.
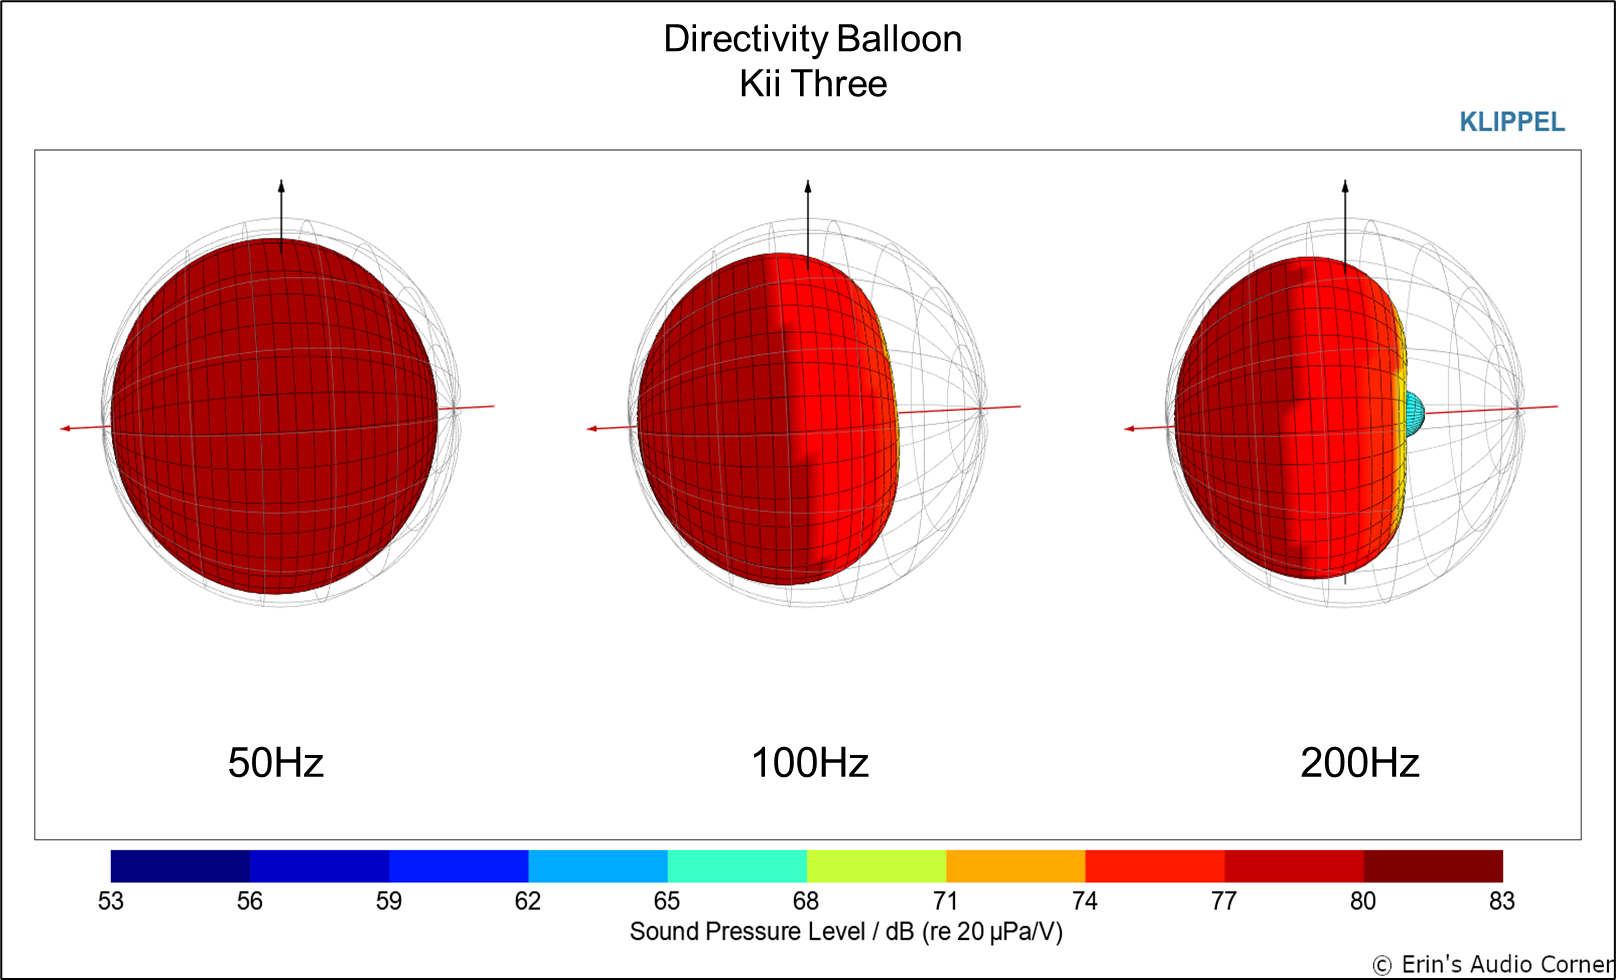
Below is another way of looking at the transition from omnidirectional to cardioid which should provide a better idea of where this transition takes place:
Parting / Random Thoughts
Note: As stated in the Foreword, this written review is purposely a cliff’s notes version. For more details about the performance (objectively and subjectively) please watch the YouTube video (once it is posted, of course).
If you want to see some of the music I use for evaluating speakers subjectively, see my Spotify playlist.
Speakers positioned about 0.50 feet from front wall. No DSP/contour adjustments made other than treble -2dB. In-seat SPL measured between 80-90dB @ 4m with some more “stress” testing at higher output levels.
Some notes from my listening:
- One of my absolute favorite things about this speaker was that the soundstage is side to side without any “bow” or “curve” to it like many setups I test. Is this because the bass is fixed so well with the speakers and there is little variation in the lower frequencies thanks to the cardioid design? Is this due to the “exact” phase alignment of the drivers? It’s worth mentioning that I typically only hear this symmetry in a soundstage with concentric drivers (think Kef, Genelec). We know those employ point-source drivers with time-aligned drivers. Stands to reason the practically-perfect step response (time alignment) of this speaker is responsible for the awesome symmetry. And while I did do some A/B testing with the phase mode from “exact” to “minimal latency” and think this is the answer, it was a sighted test and who knows what my brain may have tricked me into believing.
- In terms of positioning/aiming, I find the best compromise in soundstage width and focus is about 10°-15° horizontal off-axis aiming. However, the tonality hardly changes at all other than the >10kHz drop off that is expected. Vertically, the best positioning is between the mid and tweeter. You can go about ±20° above/below the speaker but not much beyond that. Keep in mind these were designed with the vertical listening axis between the mid and tweeter, though. Of note, the design is extremely symmetrical in its off-axis response. Conventional bookshelf designs often result in a significantly different radiation pattern above and below a speaker’s main listening axis but in this case you can clearly see in the vertical contour data that the radiation pattern is practically the same above and below the speaker.
- Plenty of dynamic range from low to medium volume. Though when you get above about 90dB @ 4m you can tell the limiter is kicking in to reduce bass output.
- In Dave Matthews Band’s “Stay” there is a 30Hz rumble at the opening of the track before the bass guitar kicks in. Now, on any other bookshelf speaker this would not and has not been noticeable but with the Kii THREE, there was enough output that they literally caused my dogs to perk up and start looking around in that “Hey, what was that? Someone is here!” look dogs typically give. The bass was subtle but enough to notice that it was in the track and was very cool to hear come from such relatively small speakers. If you look back at my measured in-room response you can see what’s going on here.
- Jackson Browne’s “Doctor My Eyes”: I had goosebumps throughout the entire song. When the breakdown happens at 1:25 it just grabbed me and put a big smile on my face.
- Very neutral midrange with no standouts (which is a good thing).
- The treble seemed a bit sharp at times to me and this is what prompted me to adjust the tonality of the high frequency down by 2dB. Anecdotally, I have read a few other reviewers who made passing mention of this. With the Kii’s wide radiation pattern I attribute this more to additional room interaction in the 3-5kHz area. You can get an idea of this by simply looking at the Estimated In-Room Response. A simple PEQ filter at 4kHz would likely remedy this issue but I didn’t take the time to test this theory.
- In David Bowie’s “Space Oddity” - which is great for testing soundstage width - stage was outside of speakers sufficiently wide to make me happy. Maybe not as wide as some ribbon designs I have auditioned over the last year but I wasn’t left with wanting more.
- SPL was able to exceed 100dB @ 4m with most music. However, if the music is bass heavy then the volume needs to be dialed back to keep from plopping the woofers, as I did with a few tracks. While these speakers do well for output needs about 90% of the time, if I were buying these I would likely opt for the BXT because I tend to listen at louder volumes while I wander around the house and let my jams play. If you are sitting within 4 meters then I would say you likely don’t need the BXT but if you sit further or tend to listen loudly like I do then you may want to consider the addition of the BXT.
The Kii THREE is one of those game-changing speakers that you hear and you question what you’ve been missing your entire life. From the aesthetic to the way they sound, I love everything about the Kii THREE. Unfortunately, it’s price is at a tier I am not likely to be at so I will kindly bid them adieu but hope to get some more time with them again in the future.
Support the Cause
If you like what you see here and want to help support the cause there are a few ways you can do so below. Your support helps me pay for new items to test, hardware, miscellaneous items needed for testing and costs of the site’s server space and bandwidth. Any help is very much appreciated.
Manufacturer’s Comment Regarding the Limiter/Output
I contacted Bruno Putzeys to ask if he had any input on the limiter/compression results and he had this to say:
Concerning the low frequency limit, the speaker is a sealed cabinet when all is said and done, so comparably sized vented cabinets will clearly have more oomph. The limiter works by estimating excursion (the delay of the phase correction FIR filter is used as lookahead) of a linearised model of the driver, and then working out where to put the corner frequency to keep excursion just within a pre-set limit. The intent of the limiter is not to protect the driver (those are rather robust) but to avoid the fairly ugly distortion you get when the drivers self-limit. In other words, it’s more a matter of keeping the sound quality acceptable irrespective of the volume setting. But that necessarily requires the limiter to start operating well before the drivers self-limit. This seems like better compromise than raising the excursion limit but feeling I have to turn the volume down when playing “too loud”. On the HF end I don’t think the tweeter limiter was already acting, so it looks like thermal compression to me. The midrange is current driven so until the limiter acts there is no compression at all.
You can also join my Facebook and YouTube pages if you’d like to follow along with updates.