Foreword / YouTube Video Review
The review on this website is a brief overview and summary of the objective performance of this speaker. It is not intended to be a deep dive. Moreso, this is information for those who prefer “just the facts” and prefer to have the data without the filler.
However, for those who want more - a detailed explanation of the objective performance, and my subjective evaluation (what I heard, what I liked, etc) - please watch the below video where I go more in-depth.
Information and Photos
I have provided an introduction to this speaker on my YouTube channel and provided below.
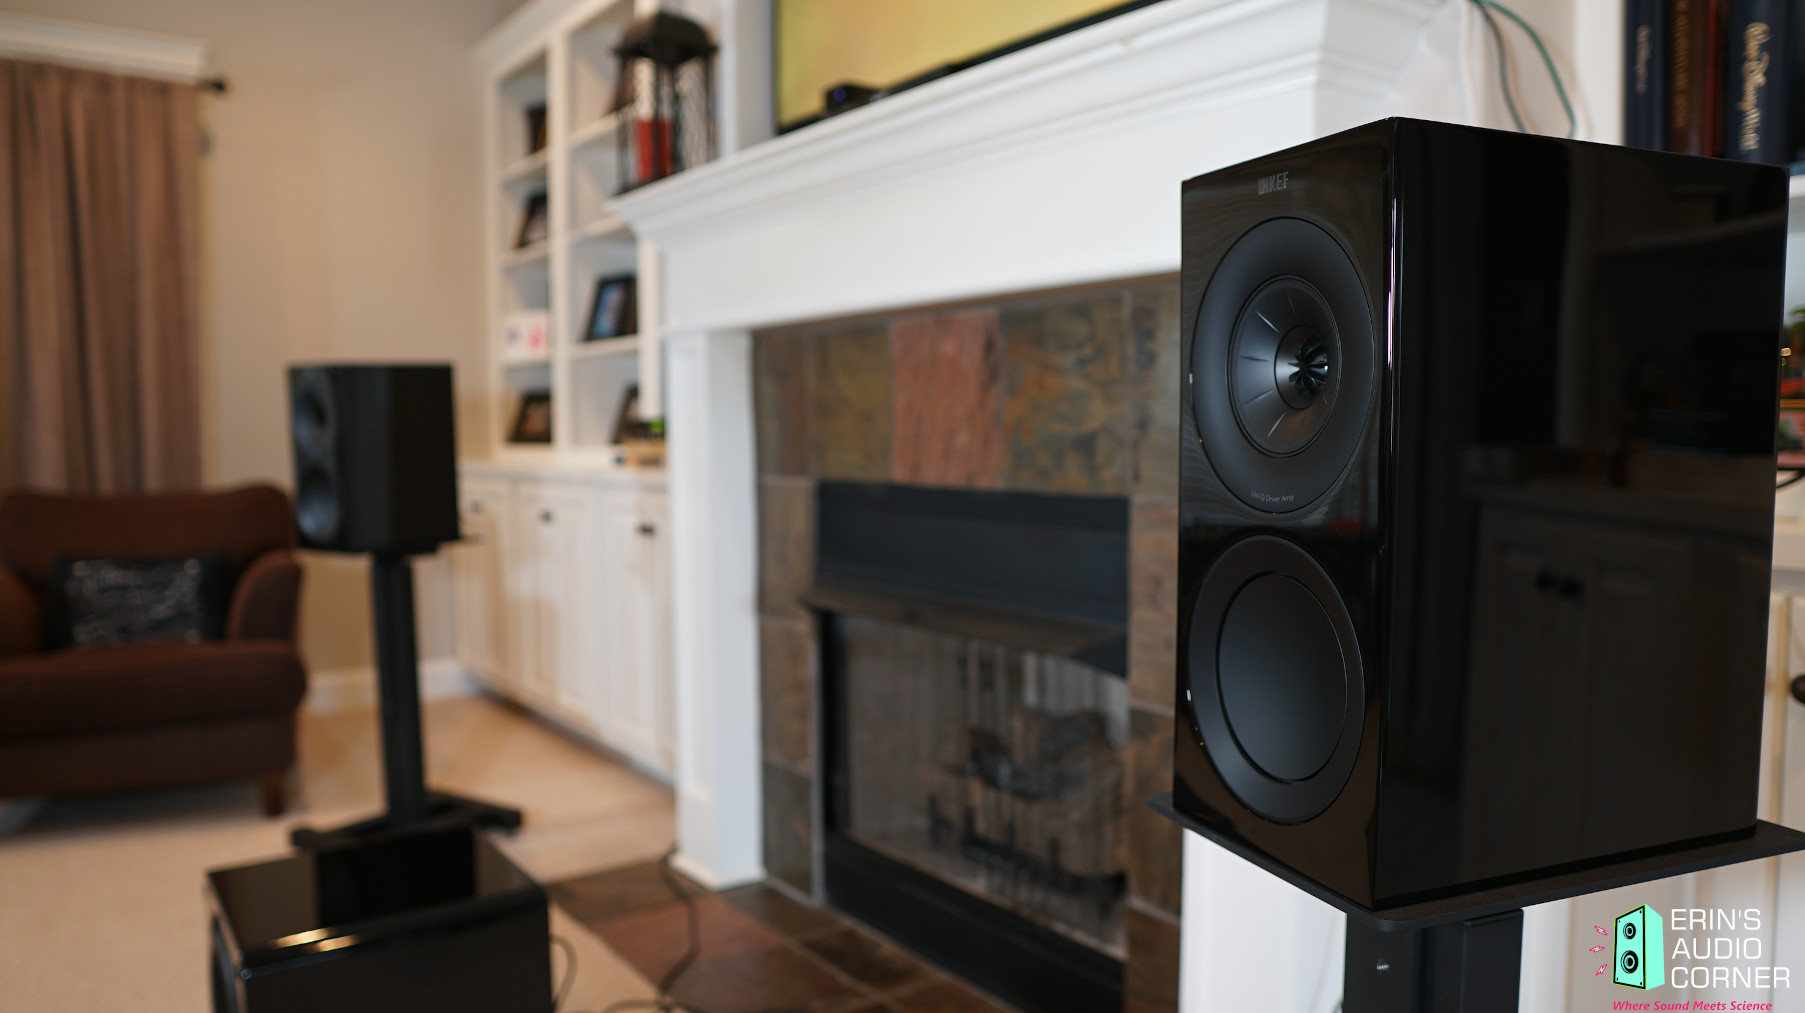
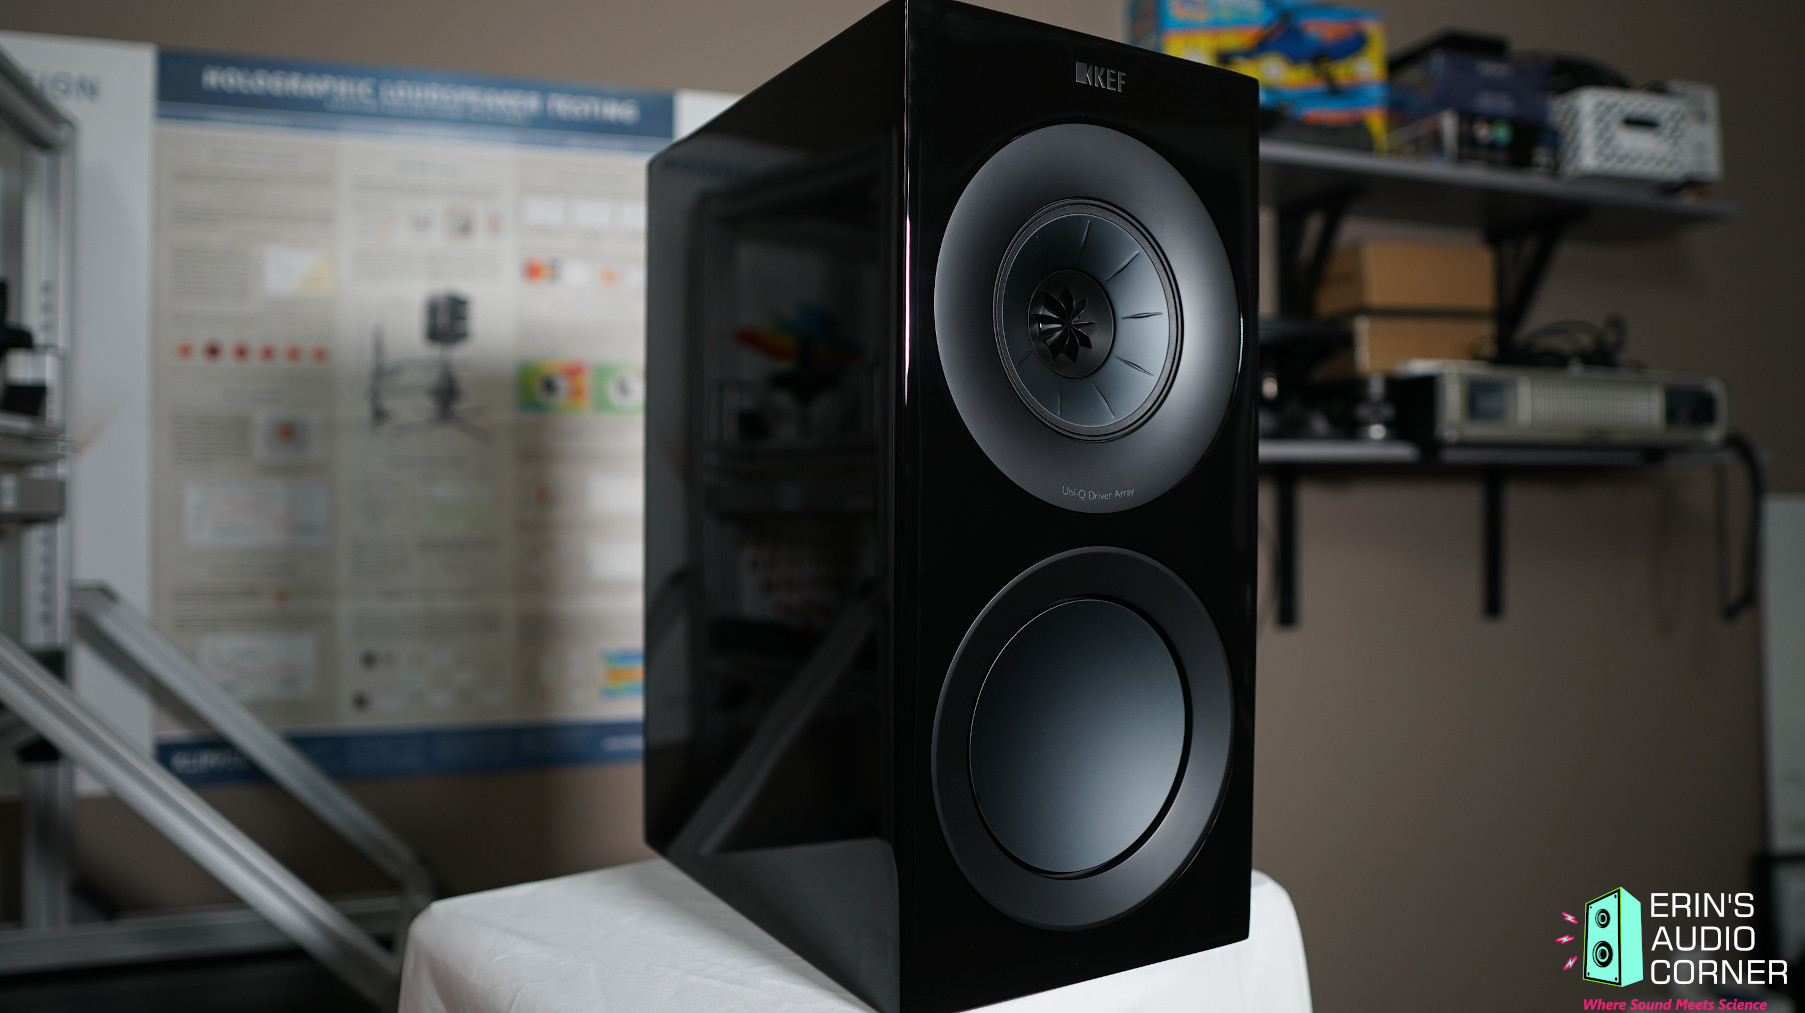
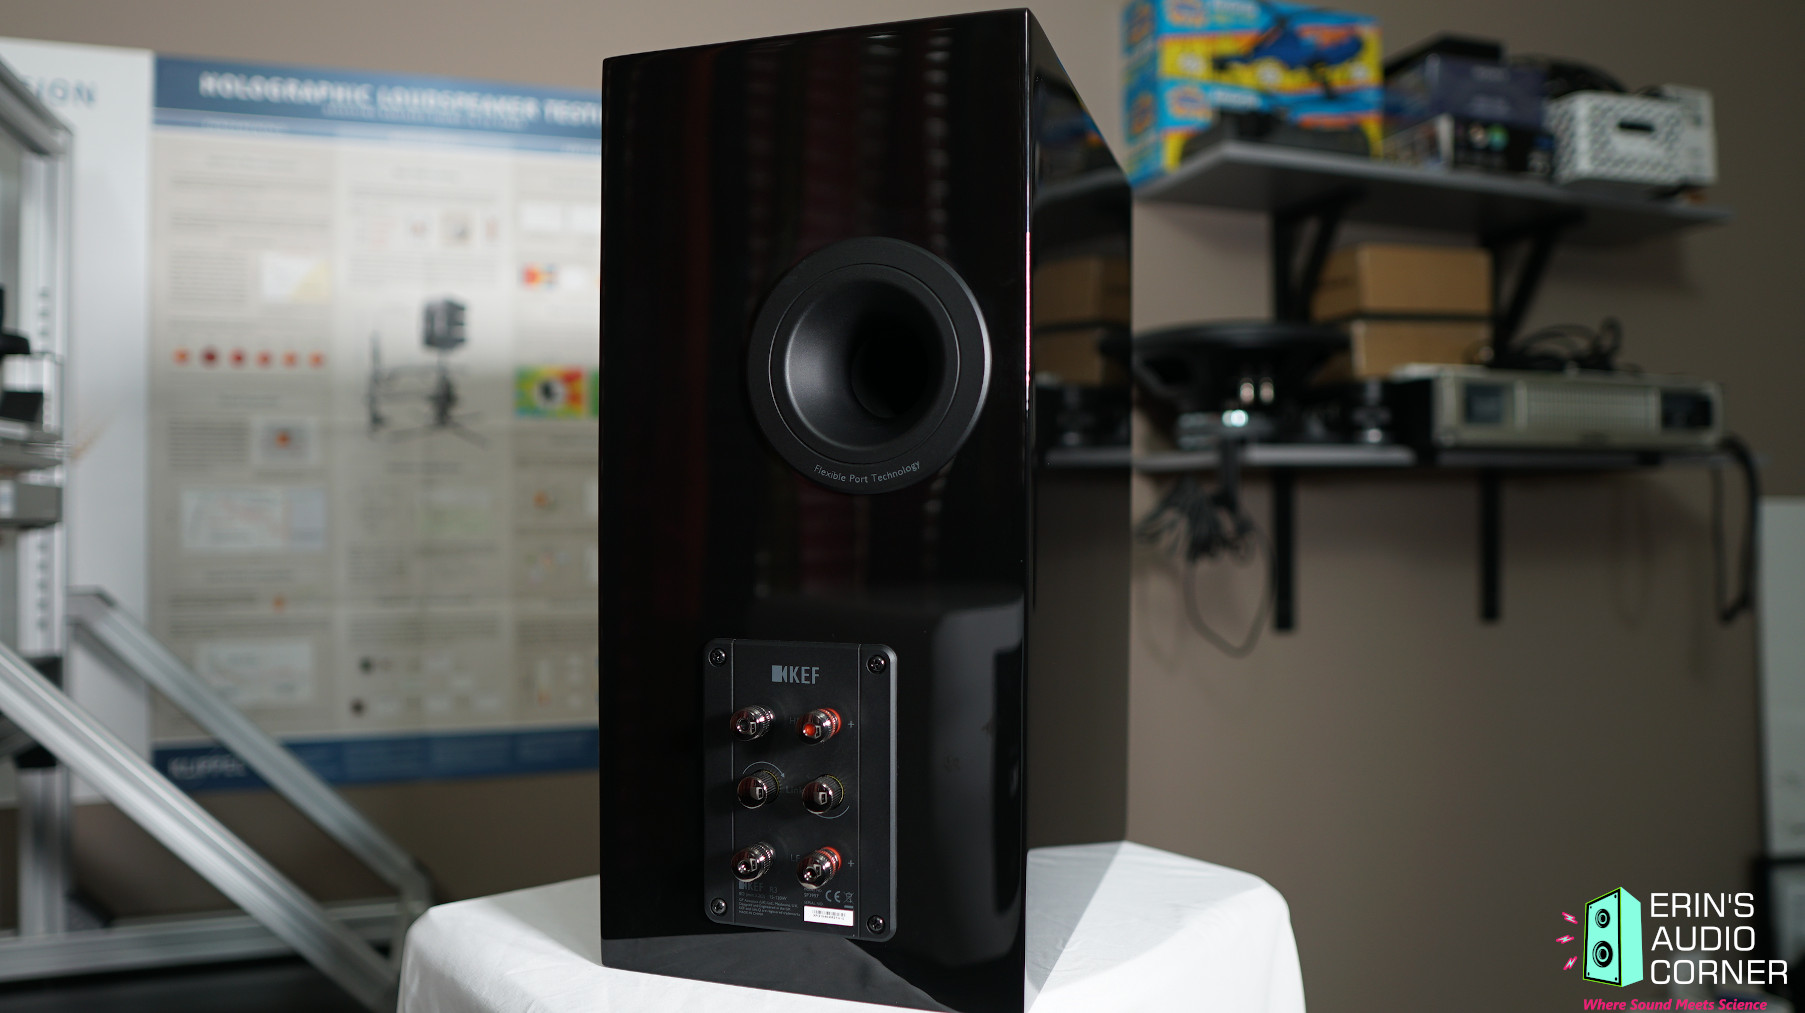
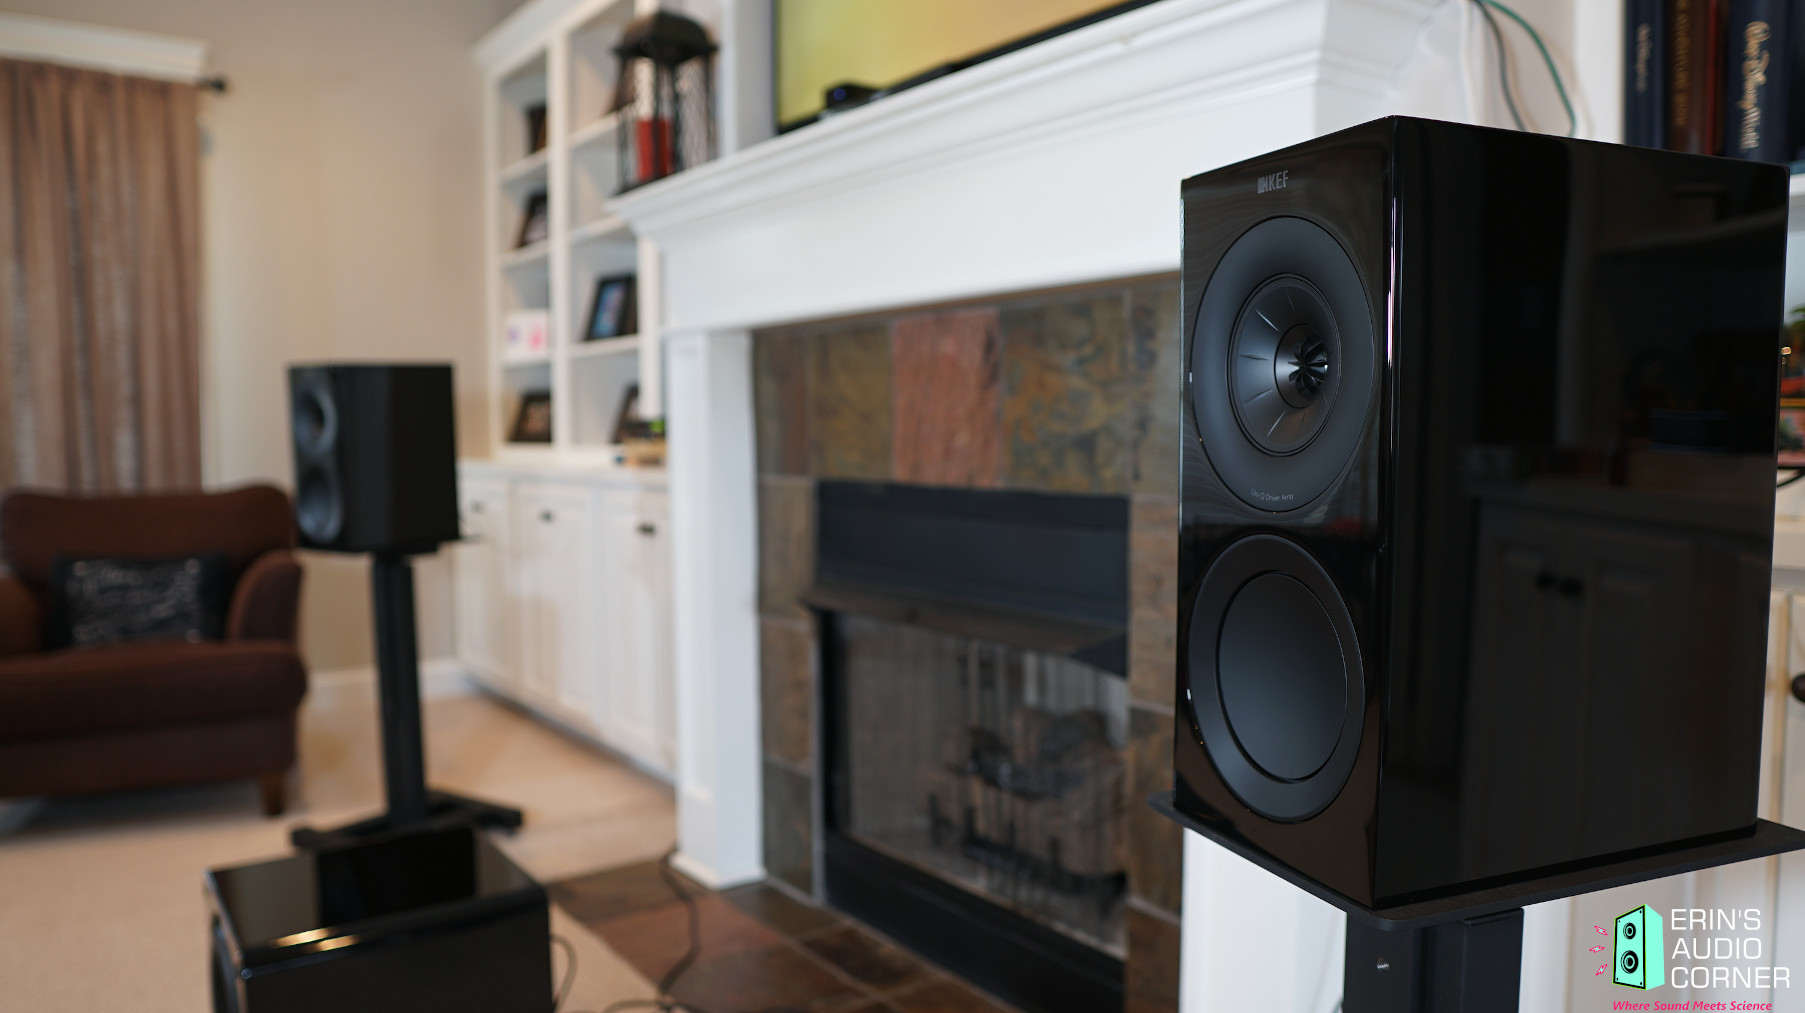
The Kef R3 is a relatively compact 3-way bookshelf speaker. It features a 6.5-inch midwoofer and a 5-inch concentric “Uni-Q” midrange/tweeter. The crossover between the midbass/midrange is 400Hz and the crossover between the midrange/tweeter is 2.9kHz. The R3 features a rear port and currently comes in three colors: gloss black, gloss white, and Walnut. The R3 comes with a removable grille as well.
Price per pair is approximately $2000 USD.
CTA-2034 (SPINORAMA) and Accompanying Data
All data collected using Klippel’s Near-Field Scanner. The Near-Field-Scanner 3D (NFS) offers a fully automated acoustic measurement of direct sound radiated from the source under test. The radiated sound is determined in any desired distance and angle in the 3D space outside the scanning surface. Directivity, sound power, SPL response and many more key figures are obtained for any kind of loudspeaker and audio system in near field applications (e.g. studio monitors, mobile devices) as well as far field applications (e.g. professional audio systems). Utilizing a minimum of measurement points, a comprehensive data set is generated containing the loudspeaker’s high resolution, free field sound radiation in the near and far field. For a detailed explanation of how the NFS works and the science behind it, please watch the below discussion with designer Christian Bellmann:
A picture of the setup in my garage:
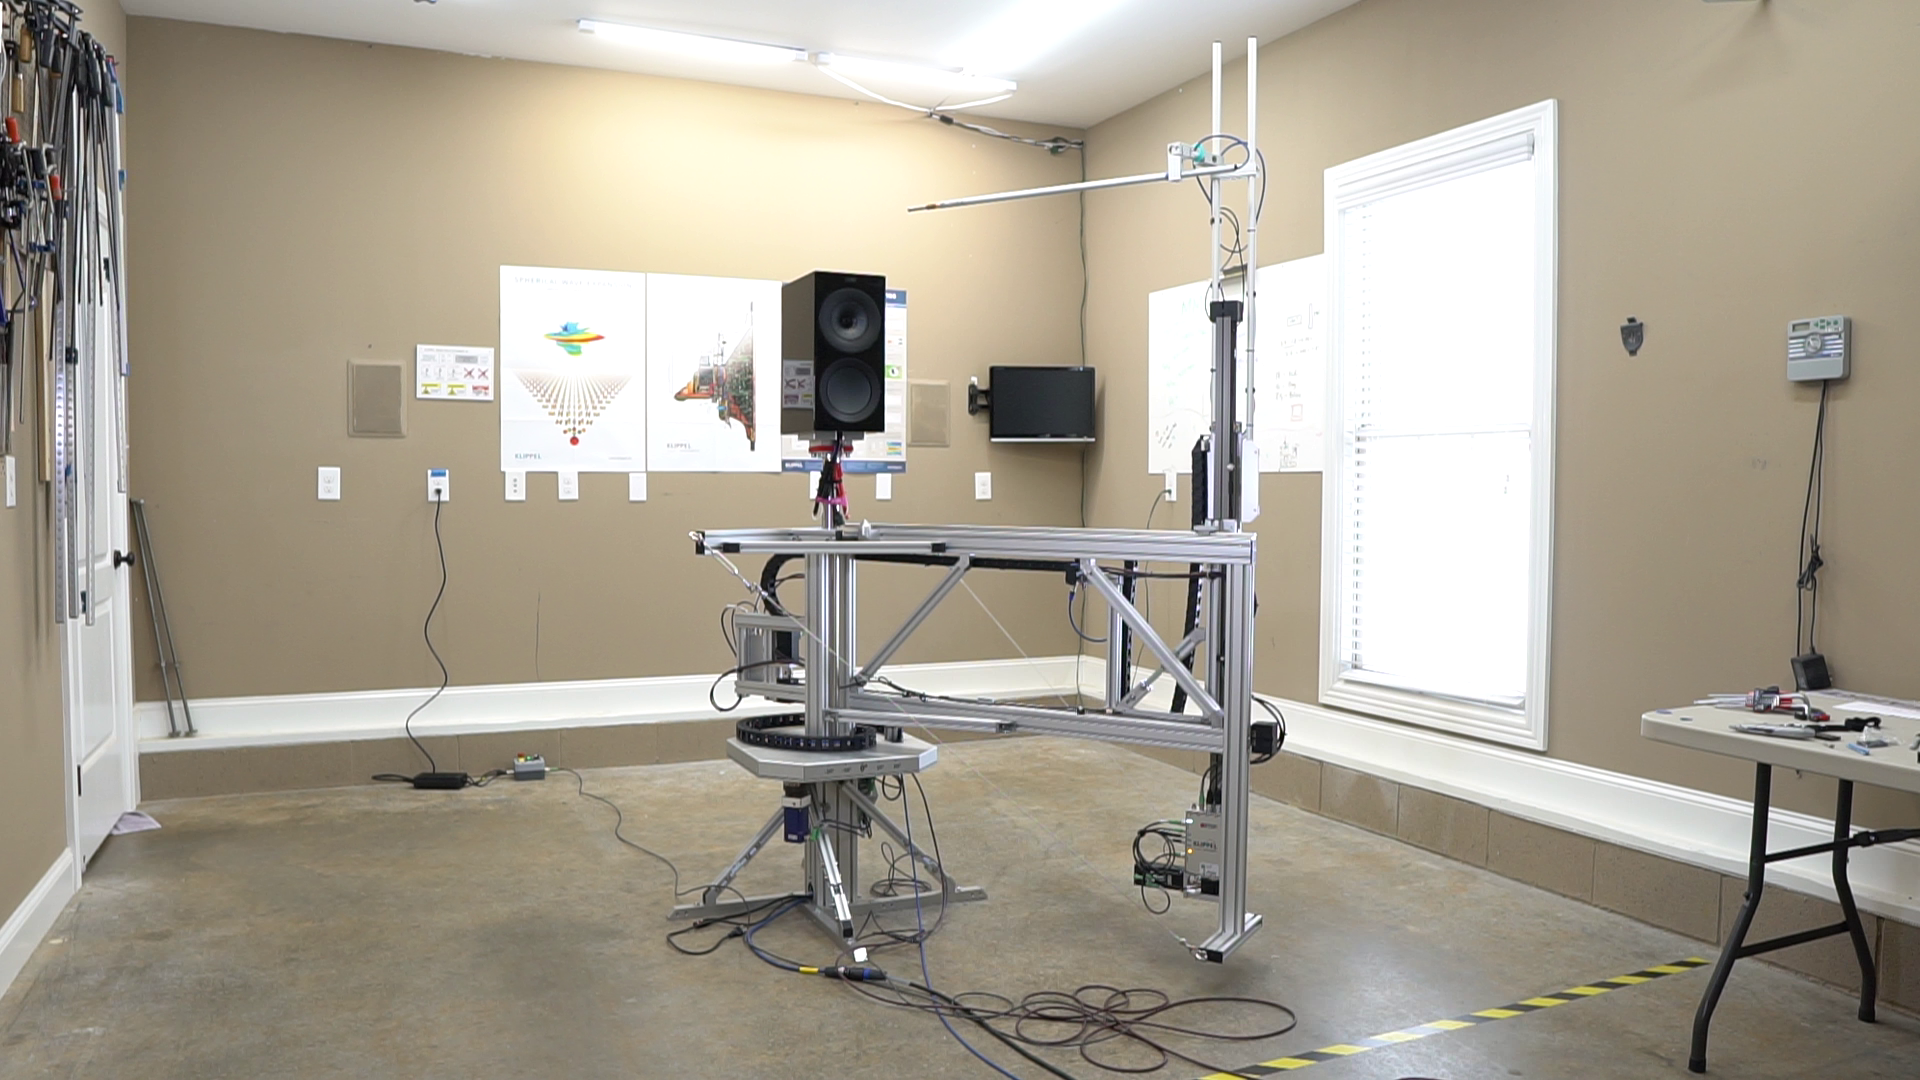
The reference plane in this test is at the tweeter/midrange. The speaker was tested in ported configuration (the port was not sealed). All testing in this review was done without grille.
Measurements are provided in a format in accordance with the Standard Method of Measurement for In-Home Loudspeakers (ANSI/CTA-2034-A R-2020). For more information, please see this link.
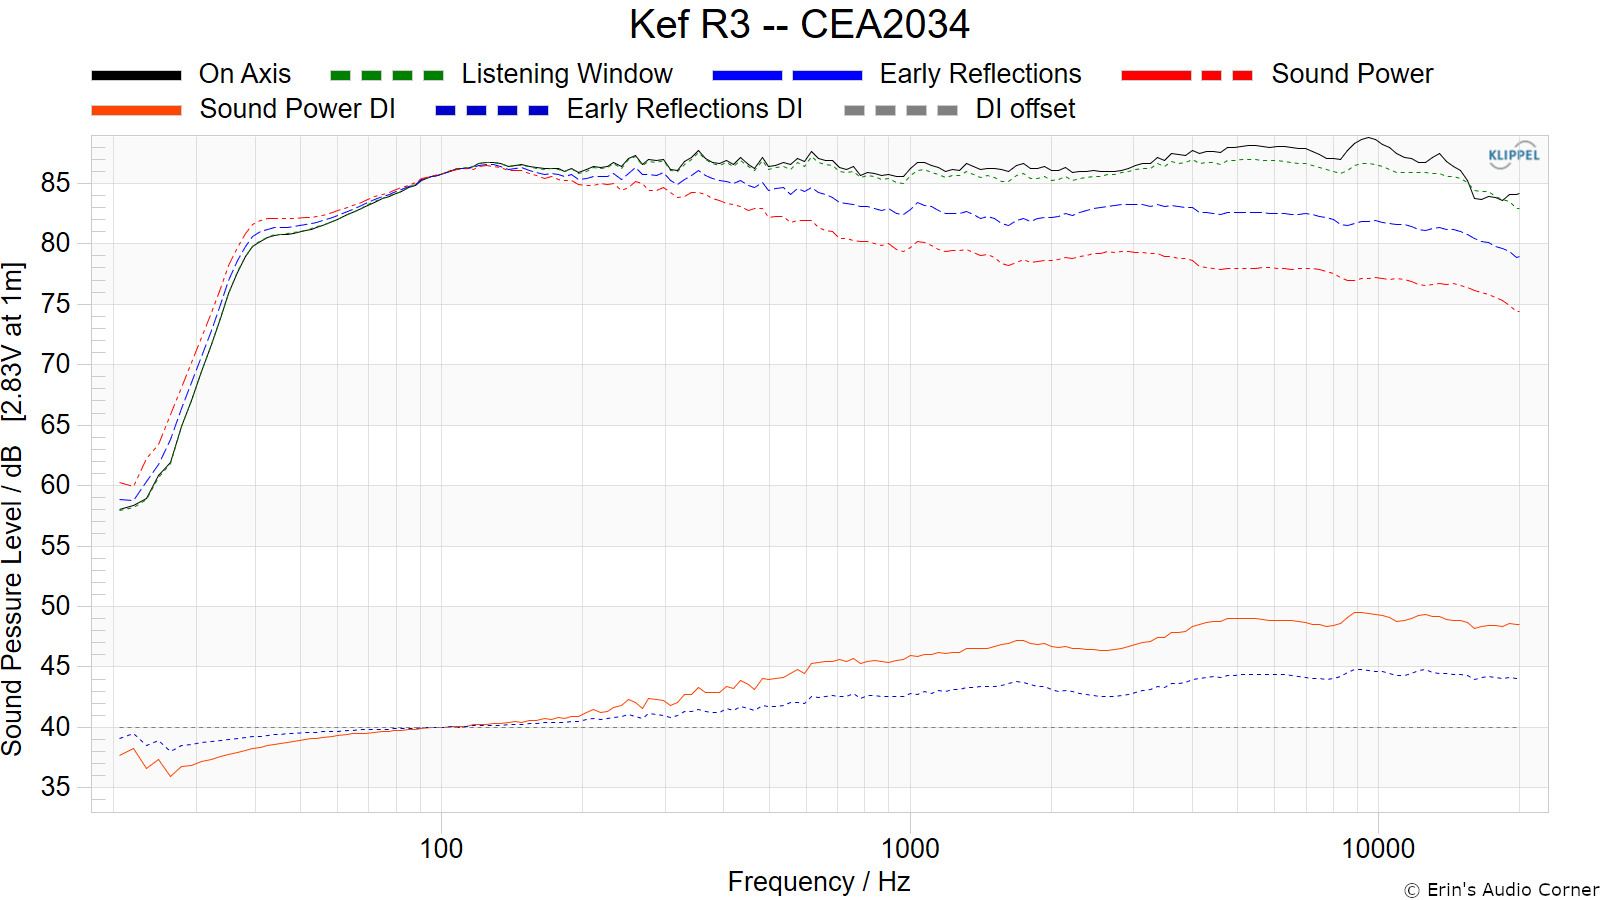
CTA-2034 / SPINORAMA:
The On-axis Frequency Response (0°) is the universal starting point and in many situations it is a fair representation of the first sound to arrive at a listener’s ears.
The Listening Window is a spatial average of the nine amplitude responses in the ±10º vertical and ±30º horizontal angular range. This encompasses those listeners who sit within a typical home theater audience, as well as those who disregard the normal rules when listening alone.
The Early Reflections curve is an estimate of all single-bounce, first-reflections, in a typical listening room.
Sound Power represents all of the sounds arriving at the listening position after any number of reflections from any direction. It is the weighted rms average of all 70 measurements, with individual measurements weighted according to the portion of the spherical surface that they represent.
Sound Power Directivity Index (SPDI): In this standard the SPDI is defined as the difference between the listening window curve and the sound power curve.
Early Reflections Directivity Index (EPDI): is defined as the difference between the listening window curve and the early reflections curve. In small rooms, early reflections figure prominently in what is measured and heard in the room so this curve may provide insights into potential sound quality.
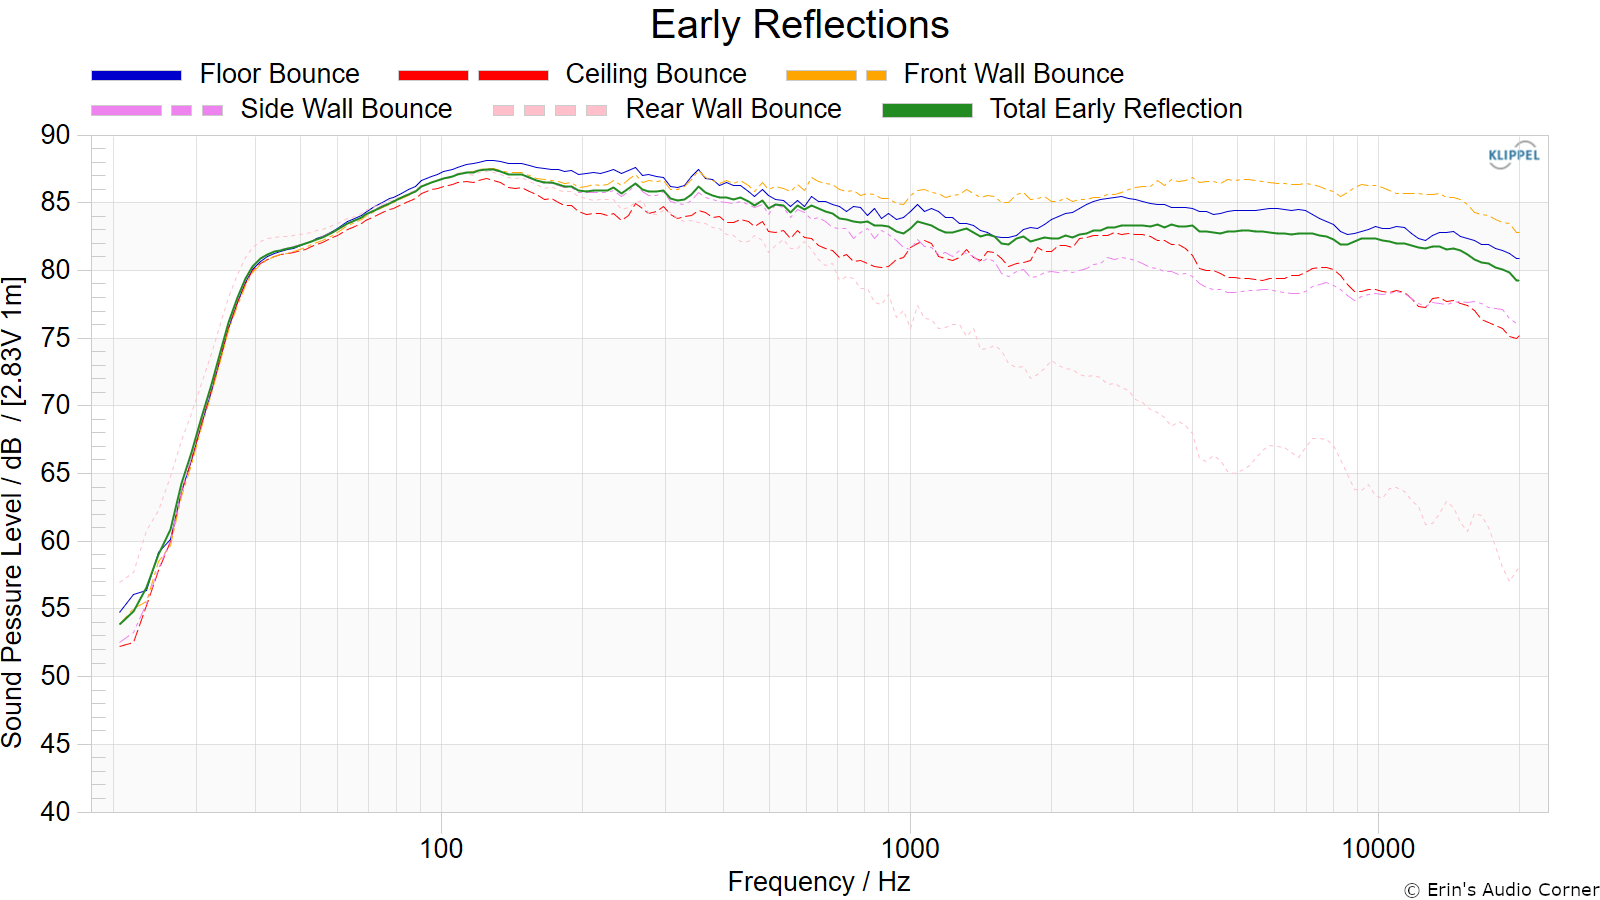
Early Reflections Breakout:
Floor bounce: average of 20º, 30º, 40º down
Ceiling bounce: average of 40º, 50º, 60º up
Front wall bounce: average of 0º, ± 10º, ± 20º, ± 30º horizontal
Side wall bounces: average of ± 40º, ± 50º, ± 60º, ± 70º, ± 80º horizontal
Rear wall bounces: average of 180º, ± 90º horizontal
Estimated In-Room Response:
In theory, with complete 360-degree anechoic data on a loudspeaker and sufficient acoustical and geometrical data on the listening room and its layout it would be possible to estimate with good precision what would be measured by an omnidirectional microphone located in the listening area of that room. By making some simplifying assumptions about the listening space, the data set described above permits a usefully accurate preview of how a given loudspeaker might perform in a typical domestic listening room. Obviously, there are no guarantees, because individual rooms can be acoustically aberrant. Sometimes rooms are excessively reflective (“live”) as happens in certain hot, humid climates, with certain styles of interior décor and in under-furnished rooms. Sometimes rooms are excessively “dead” as in other styles of décor and in some custom home theaters where acoustical treatment has been used excessively. This form of post processing is offered only as an estimate of what might happen in a domestic living space with carpet on the floor and a “normal” amount of seating, drapes and cabinetry.
For these limited circumstances it has been found that a usefully accurate Predicted In-Room (PIR) amplitude response, also known as a “room curve” is obtained by a weighted average consisting of 12 % listening window, 44 % early reflections and 44 % sound power. At very high frequencies errors can creep in because of excessive absorption, microphone directivity, and room geometry. These discrepancies are not considered to be of great importance.

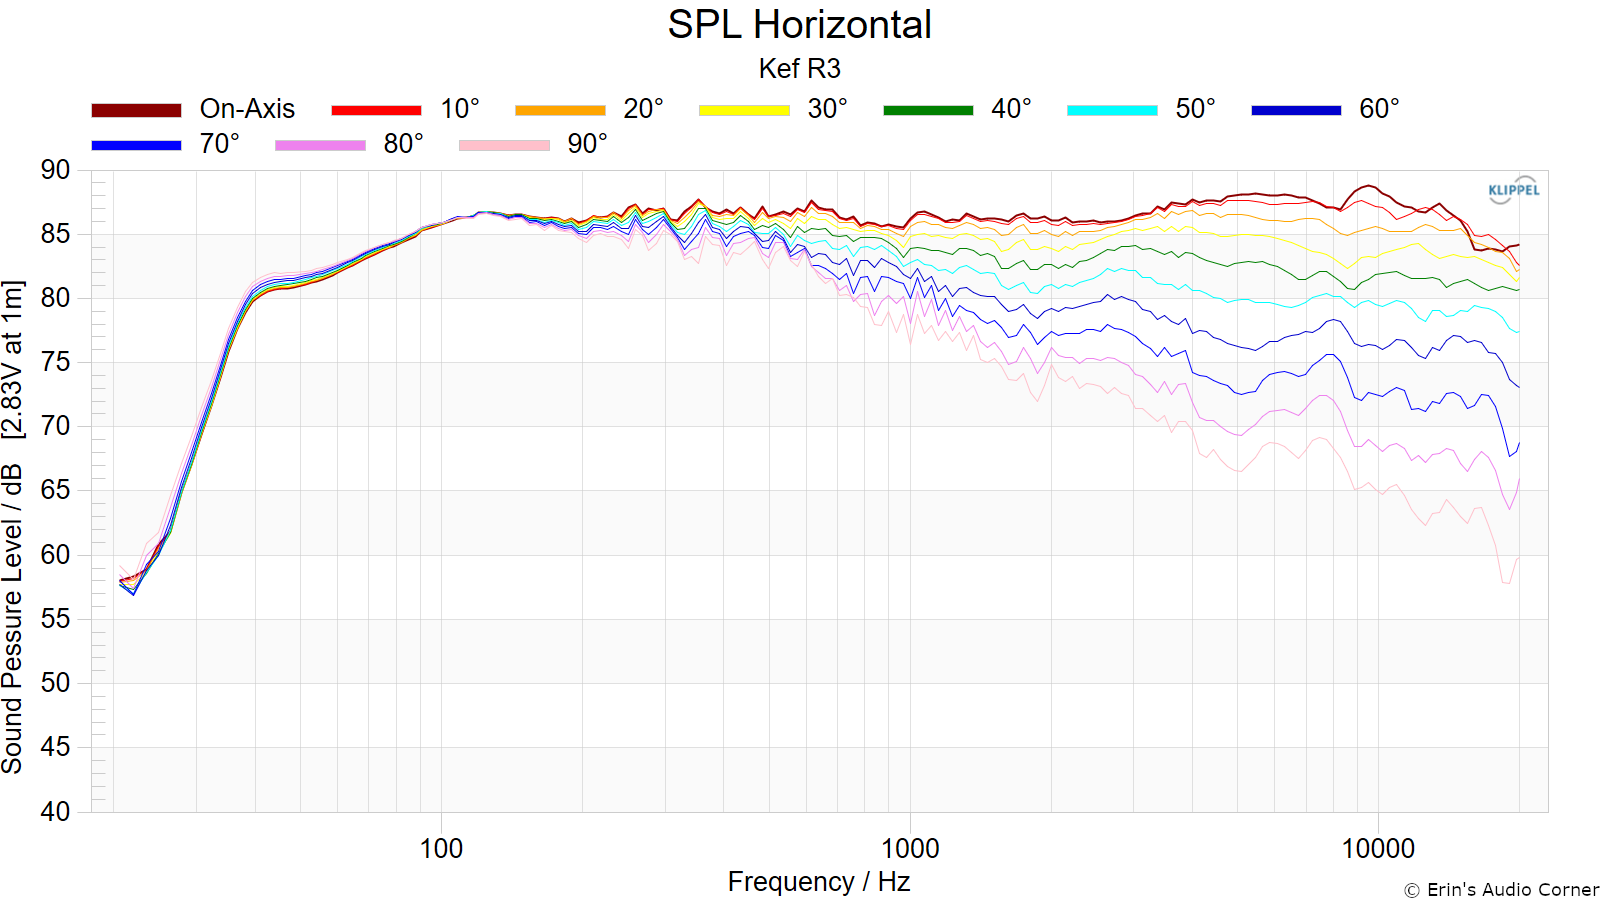
Horizontal Frequency Response (0° to ±90°):
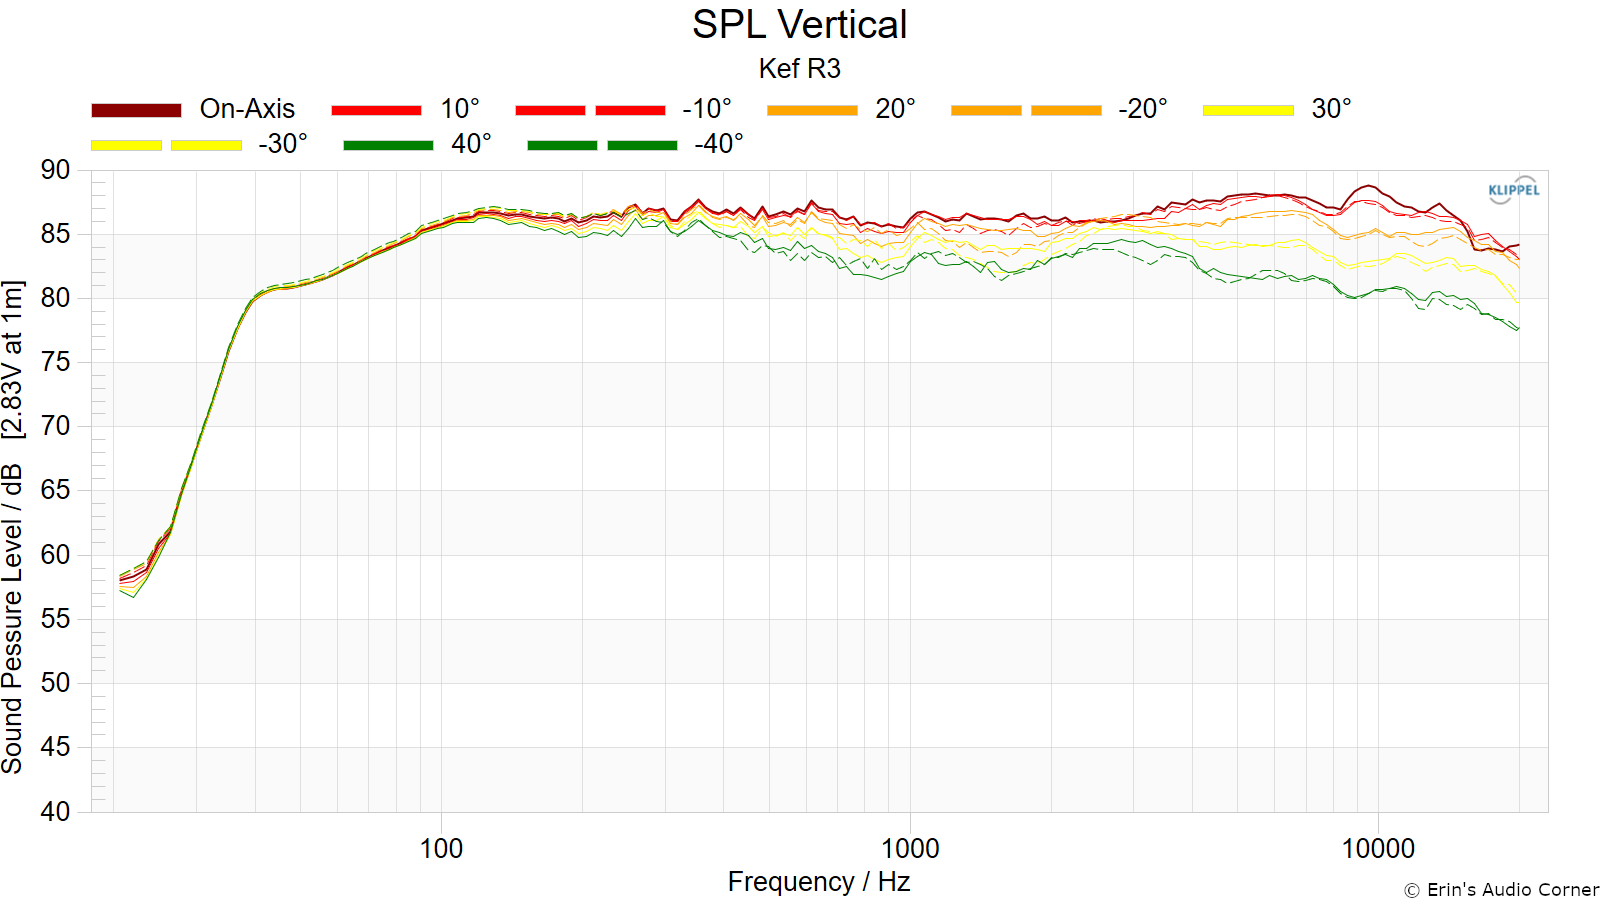
Vertical Frequency Response (0° to ±40°):
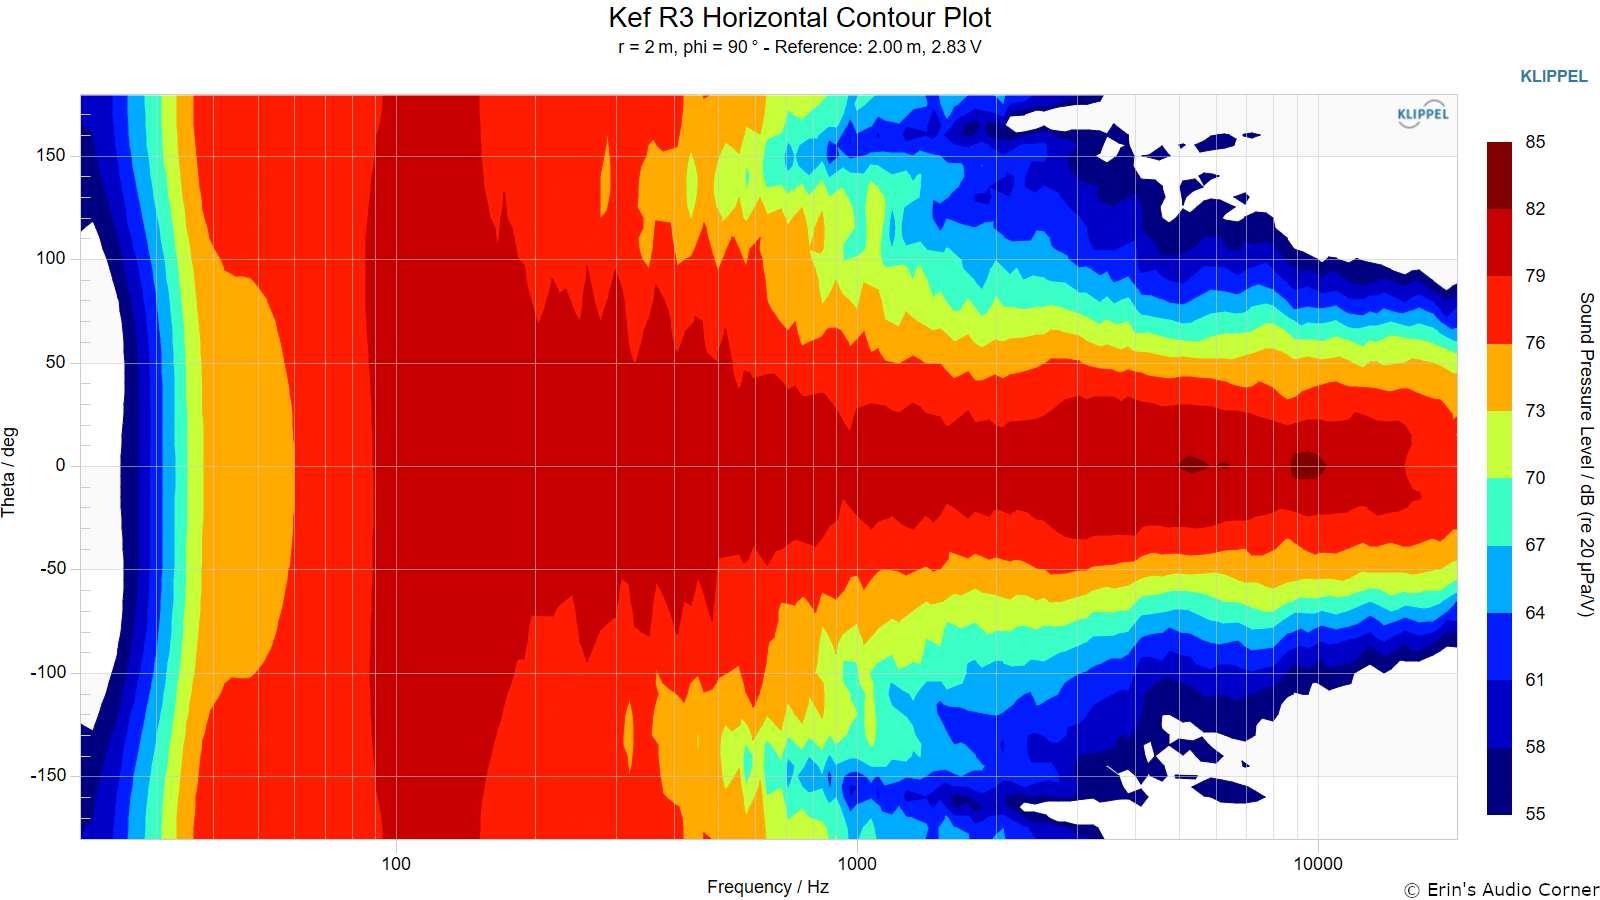
Horizontal Contour Plot (not normalized):
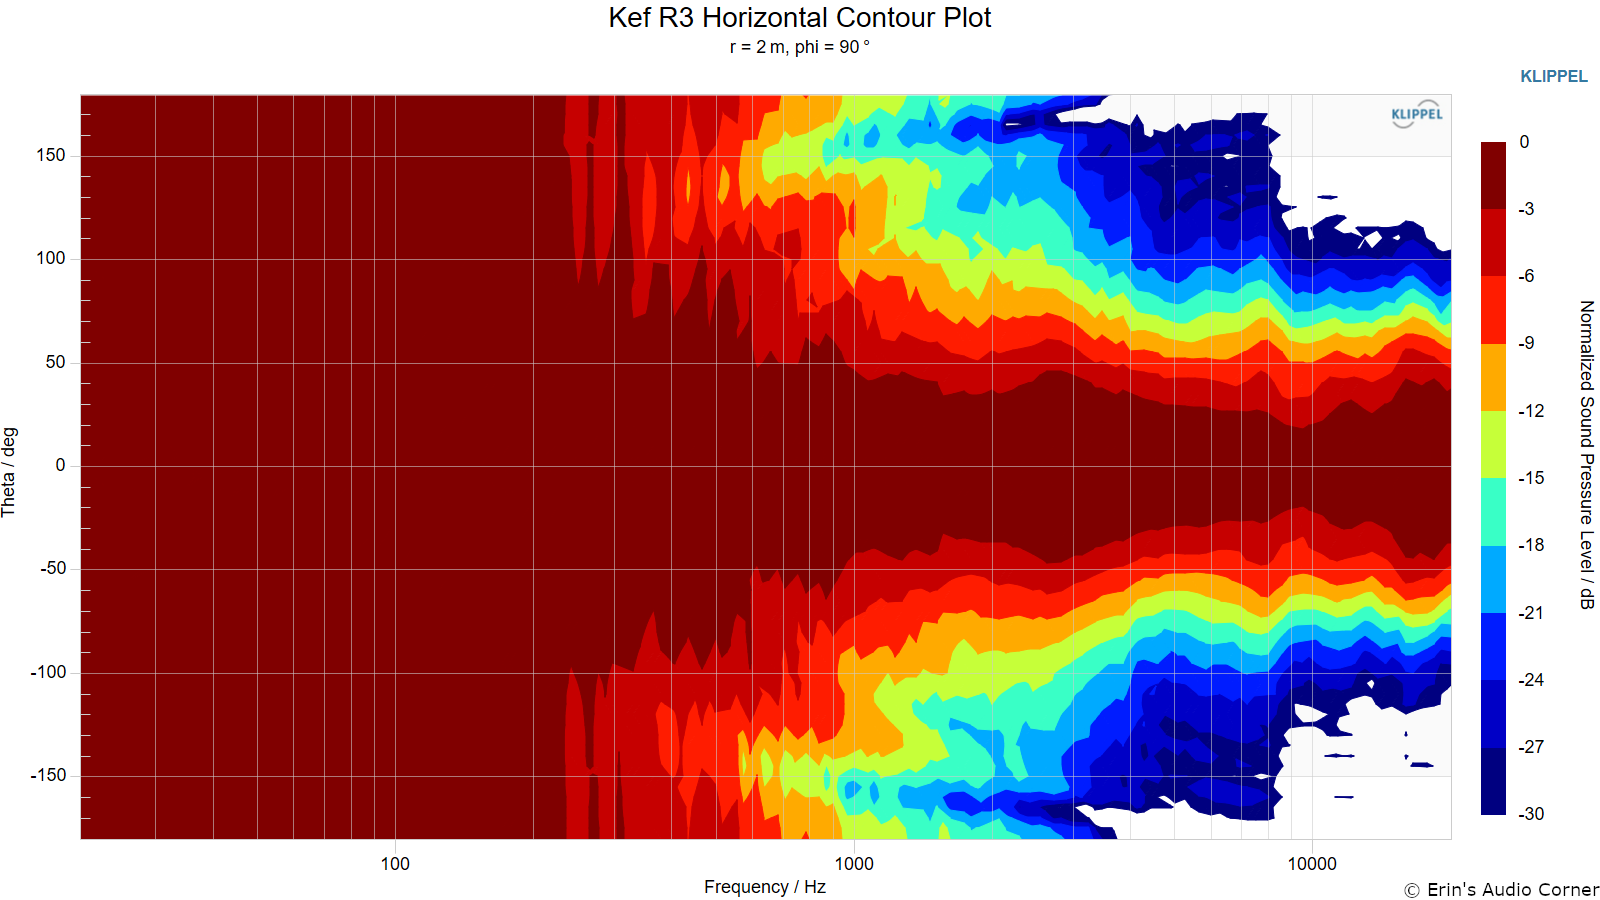
Horizontal Contour Plot (normalized):
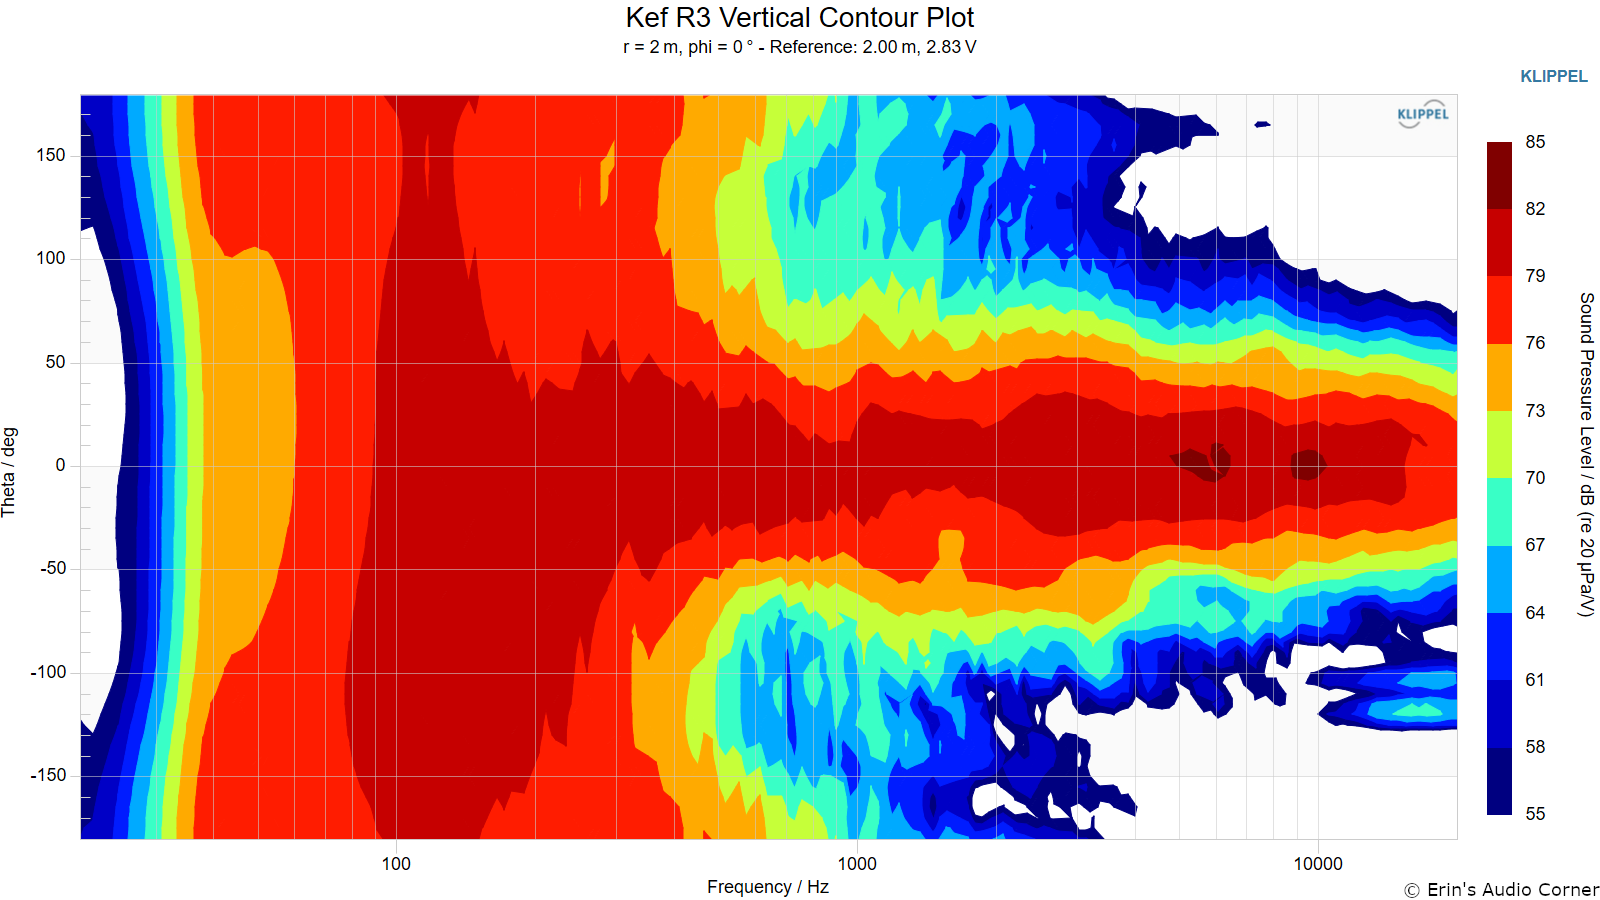
Vertical Contour Plot (not normalized):
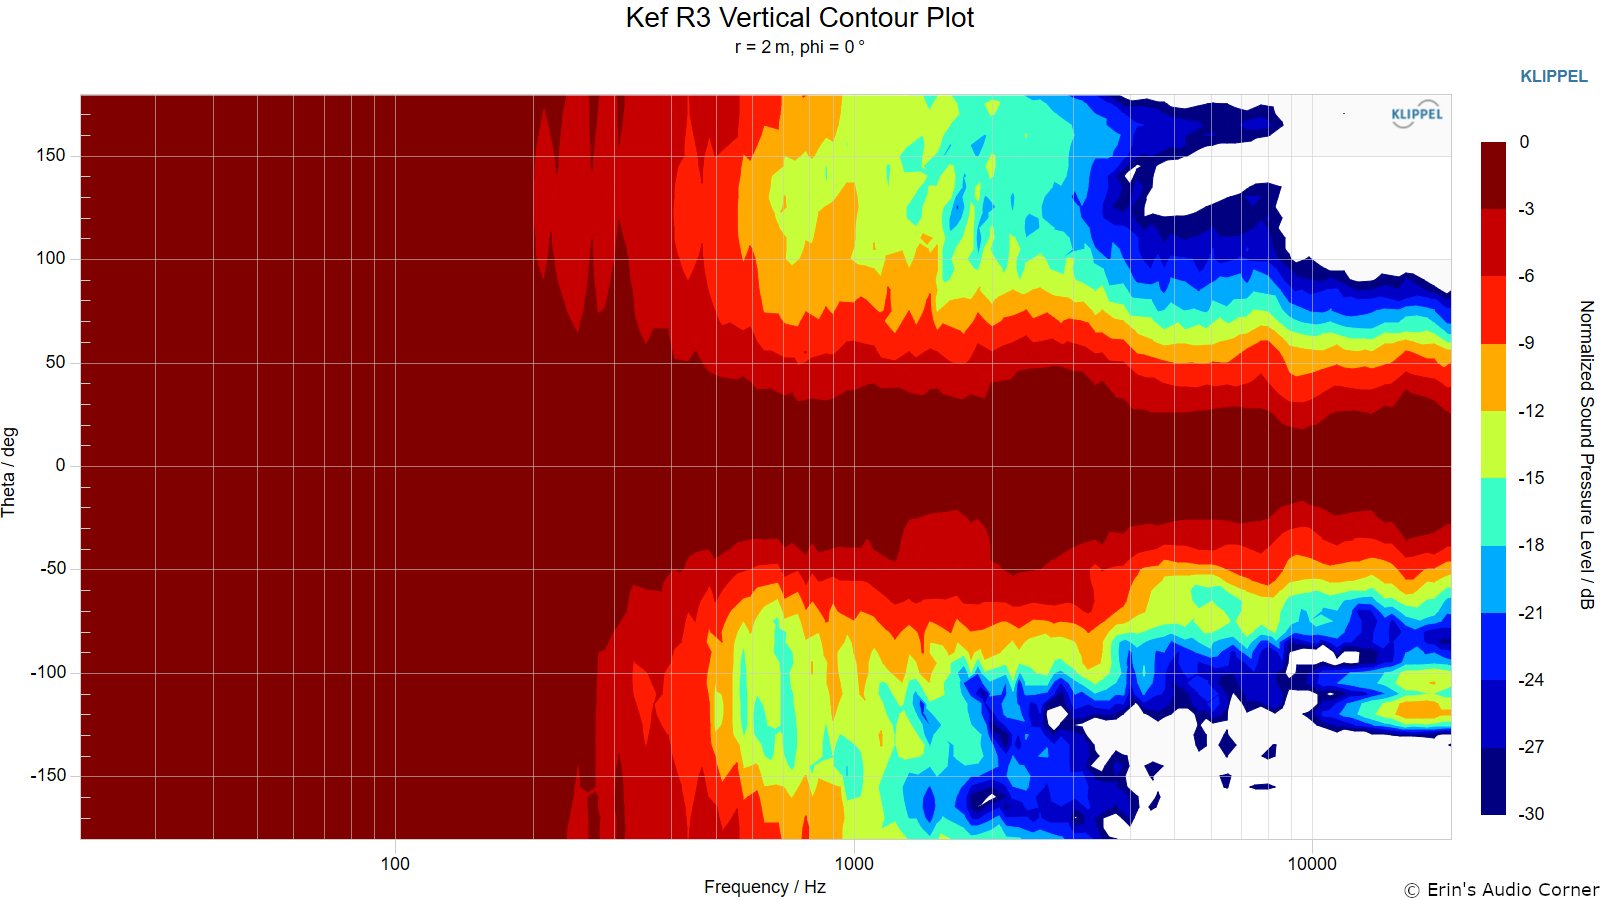
Vertical Contour Plot (normalized):
Additional Measurements
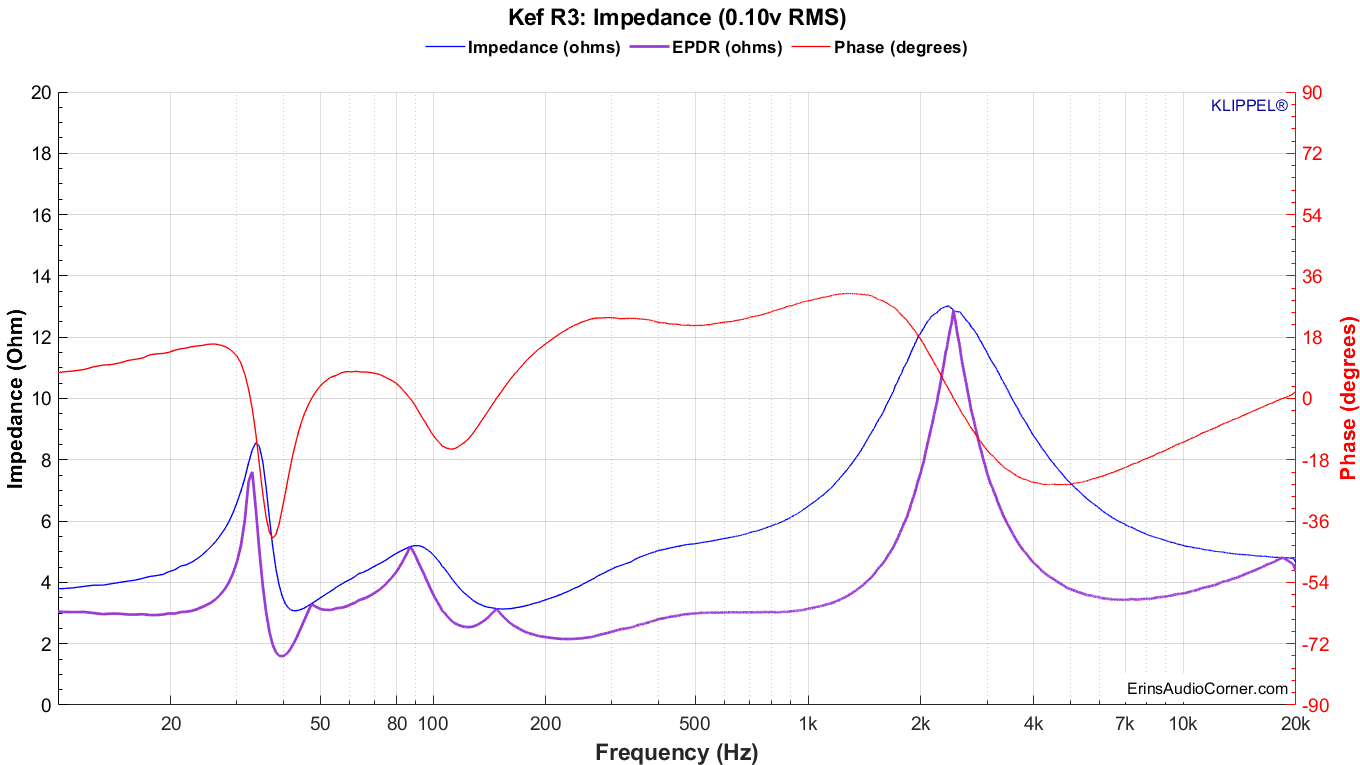
Impedance Magnitude and Phase + Equivalent Peak Dissipation Resistance (EPDR)
For those who do not know what EPDR is (ahem, myself until 2020), Keith Howard came up with this metric which he defined in a 2007 article for Stereophile as:
… simply the resistive load that would give rise to the same peak device dissipation as the speaker itself.
A note from Dr. Jack Oclee-Brown of Kef (who supplied the formula for calculating EPDR):
Just a note of caution that the EPDR derivation is based on a class-B output stage so it’s valid for typical class-AB amps but certainly not for class-A and probably has only marginal relevance for class-D amps (would love to hear from a class-D expert on this topic).
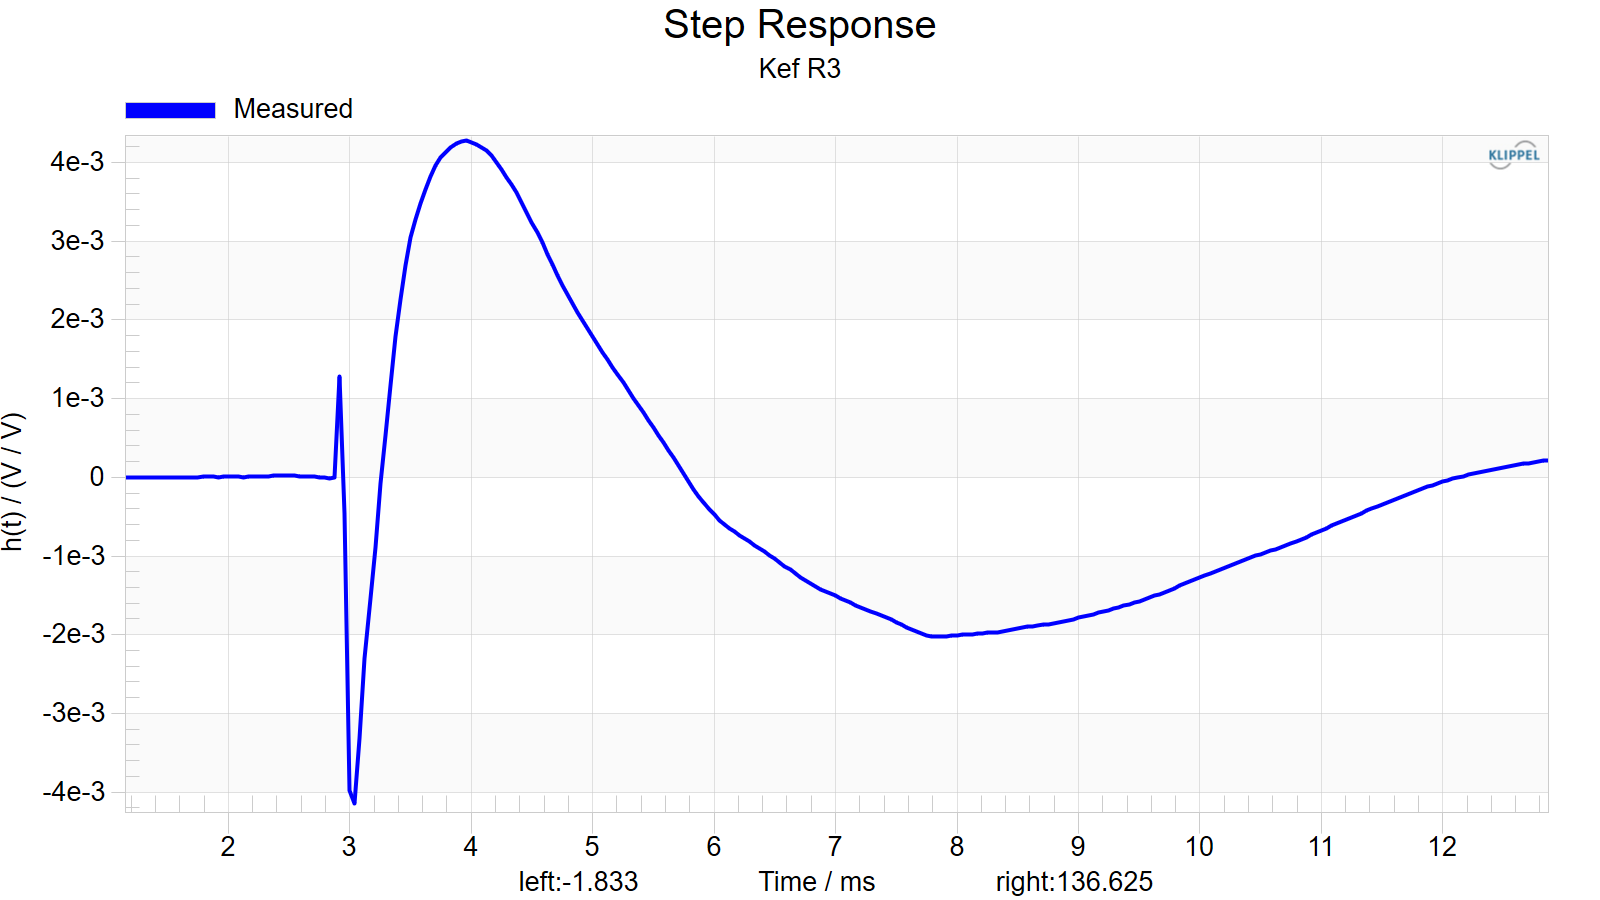
Step Response
Near-Field Response
Nearfield response of individual drive units:
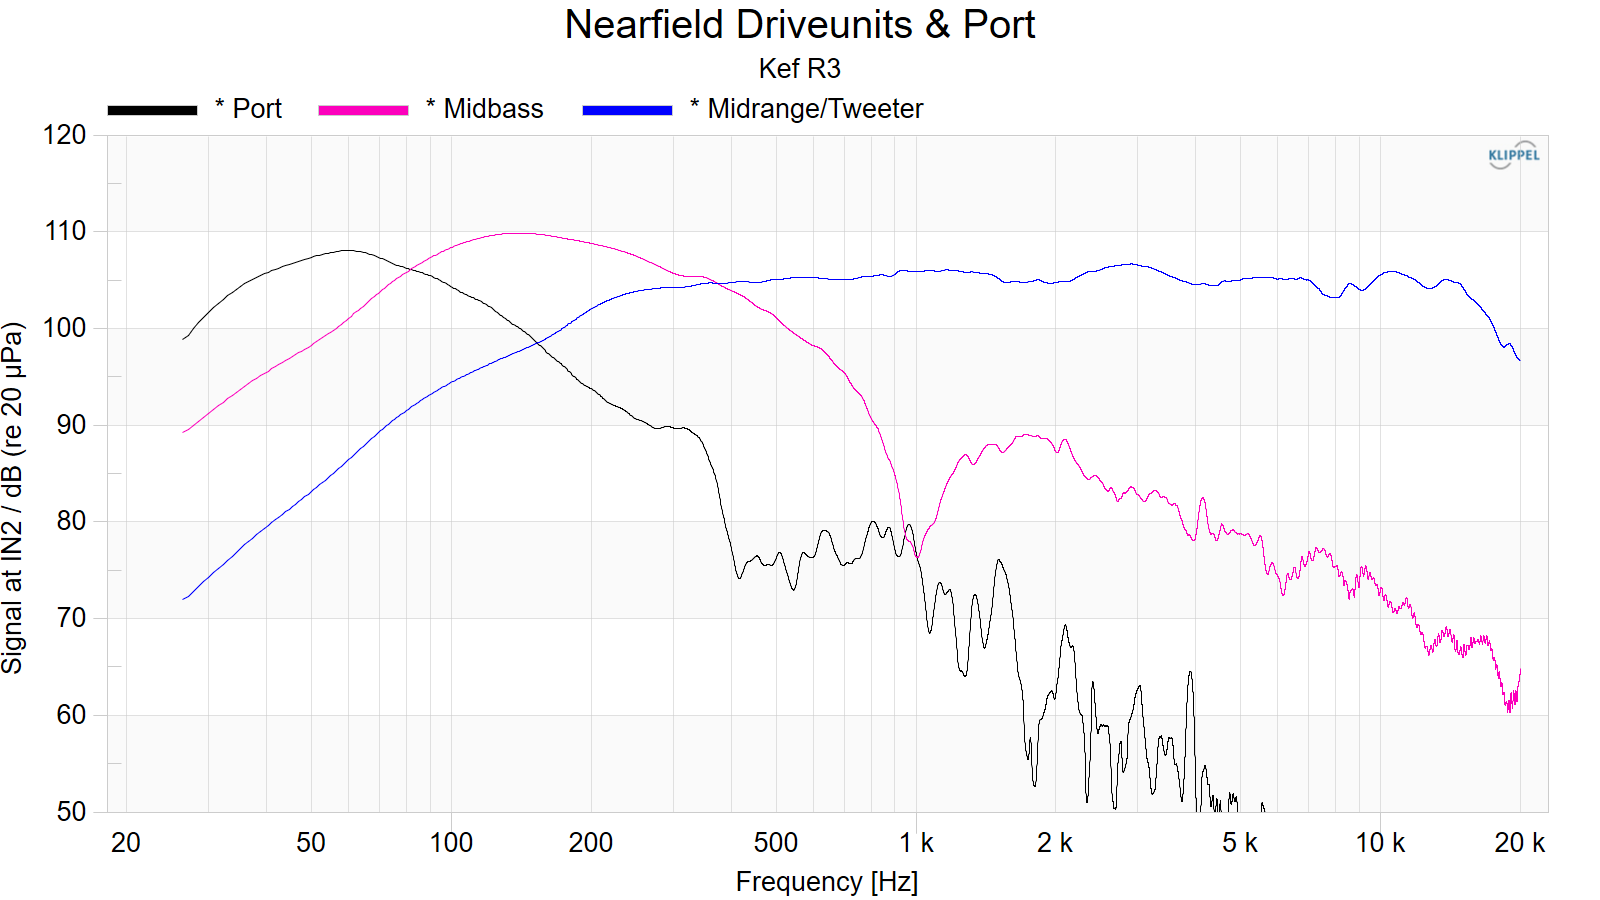
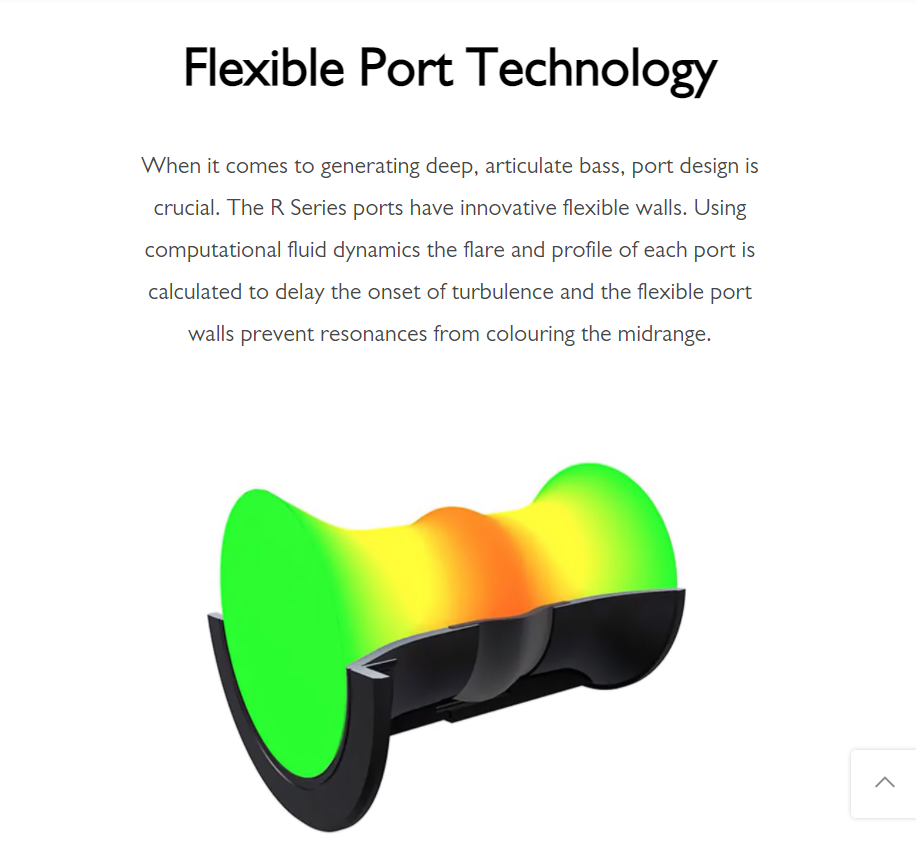
Note the lack of a strong resonance from the port. I mention this because many speakers have ports that cause resonance in the midrange. Most measurements do not provide sufficient resolution to show these issues. However, the Klippel NFS does. And in the case of the Kef R3, there are no such issues. This is attributed to the legitimate engineering of the port, dubbed by Kef as “Flexible Port Technology”, which is detailed in the graphic below.
Harmonic Distortion
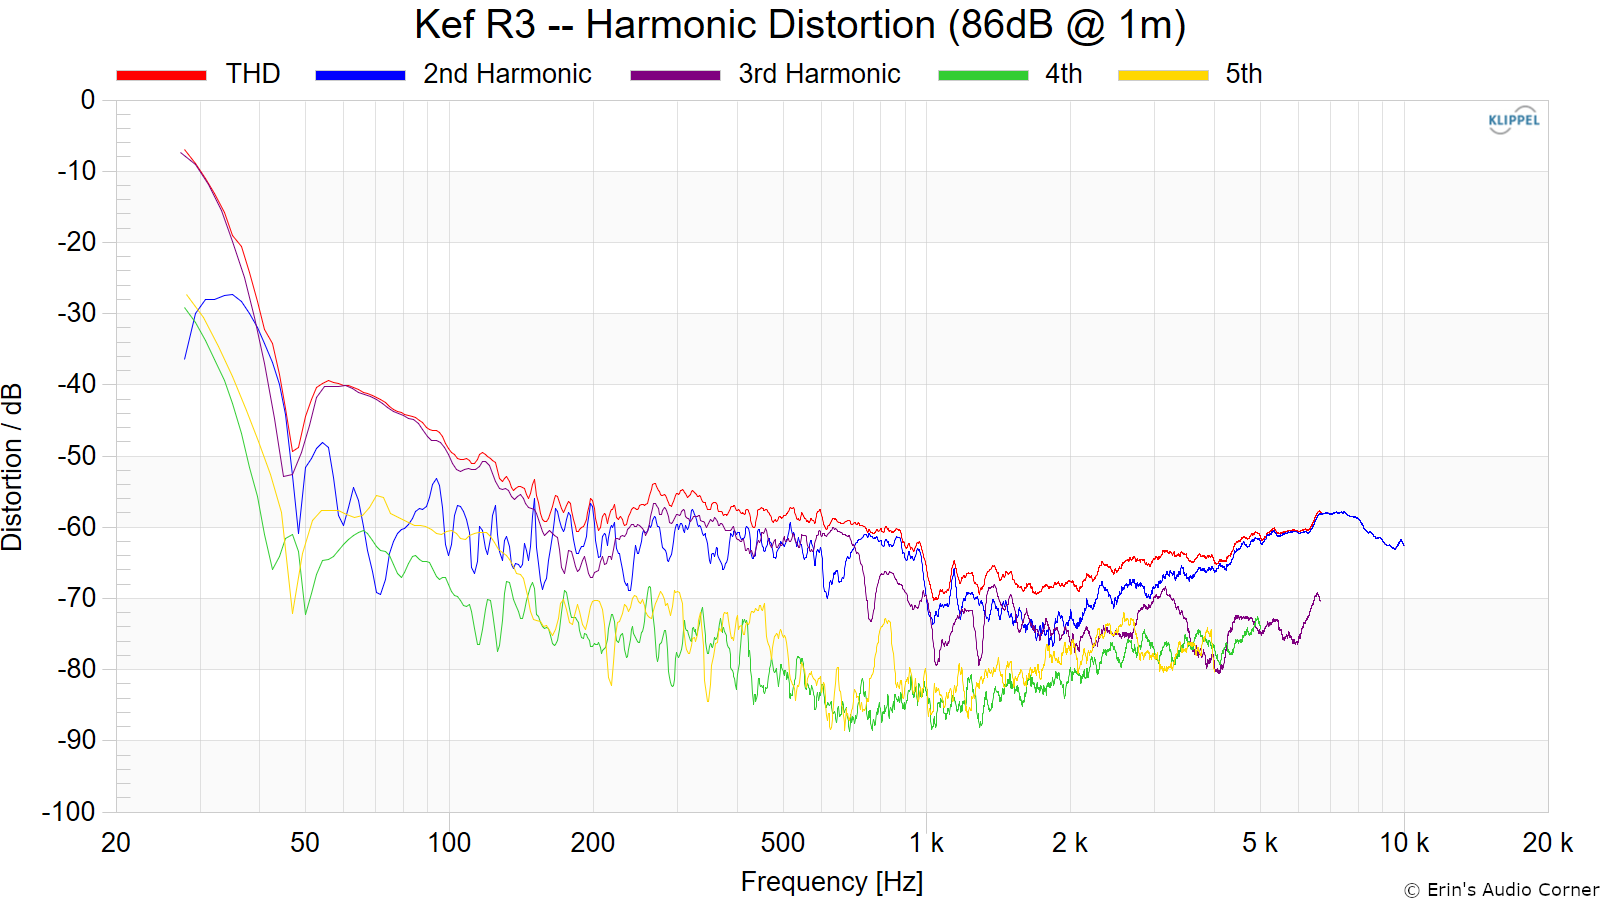
Harmonic Distortion at 86dB @ 1m:
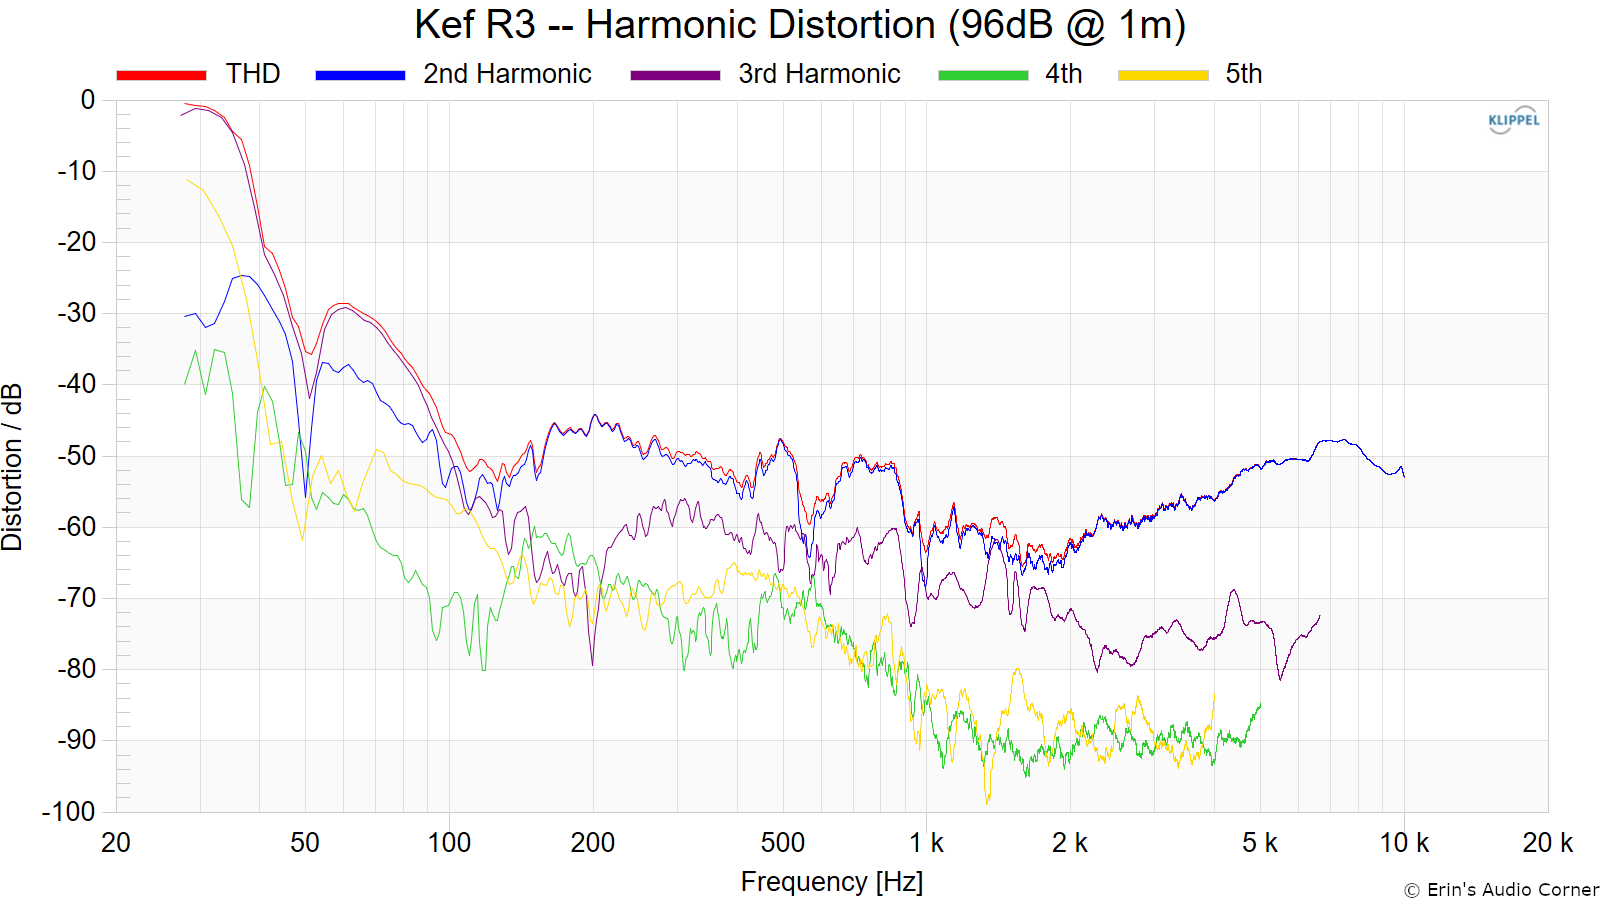
Harmonic Distortion at 96dB @ 1m:
“Globe” Plots
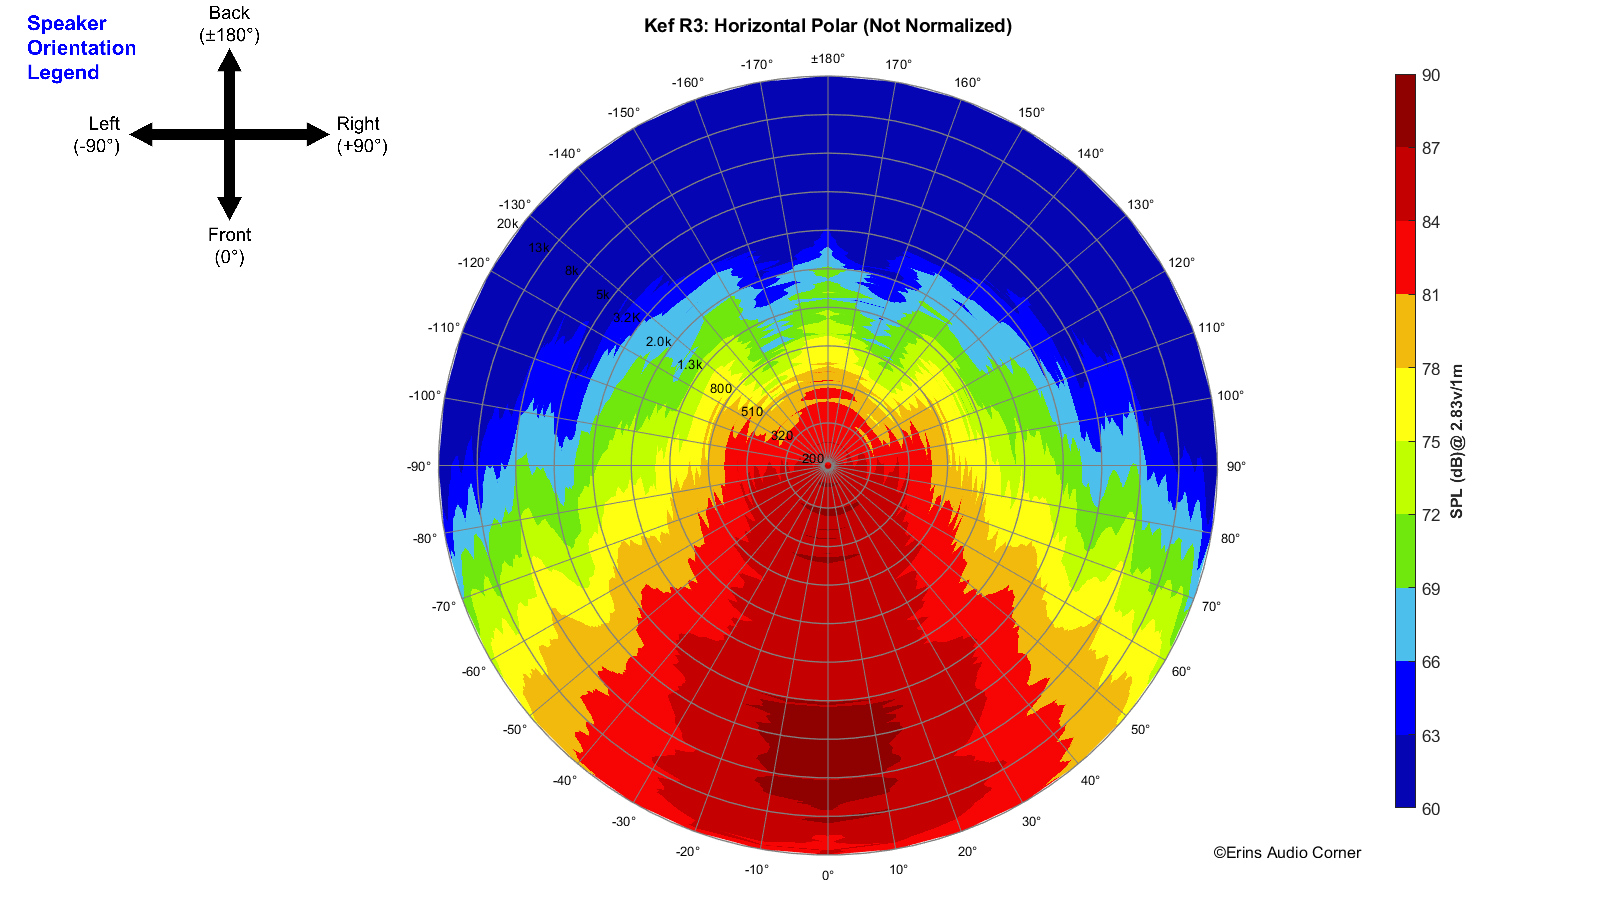
Horizontal Polar (Globe) Plot:
This represents the sound field at 2 meters - above 200Hz - per the legend in the upper left.
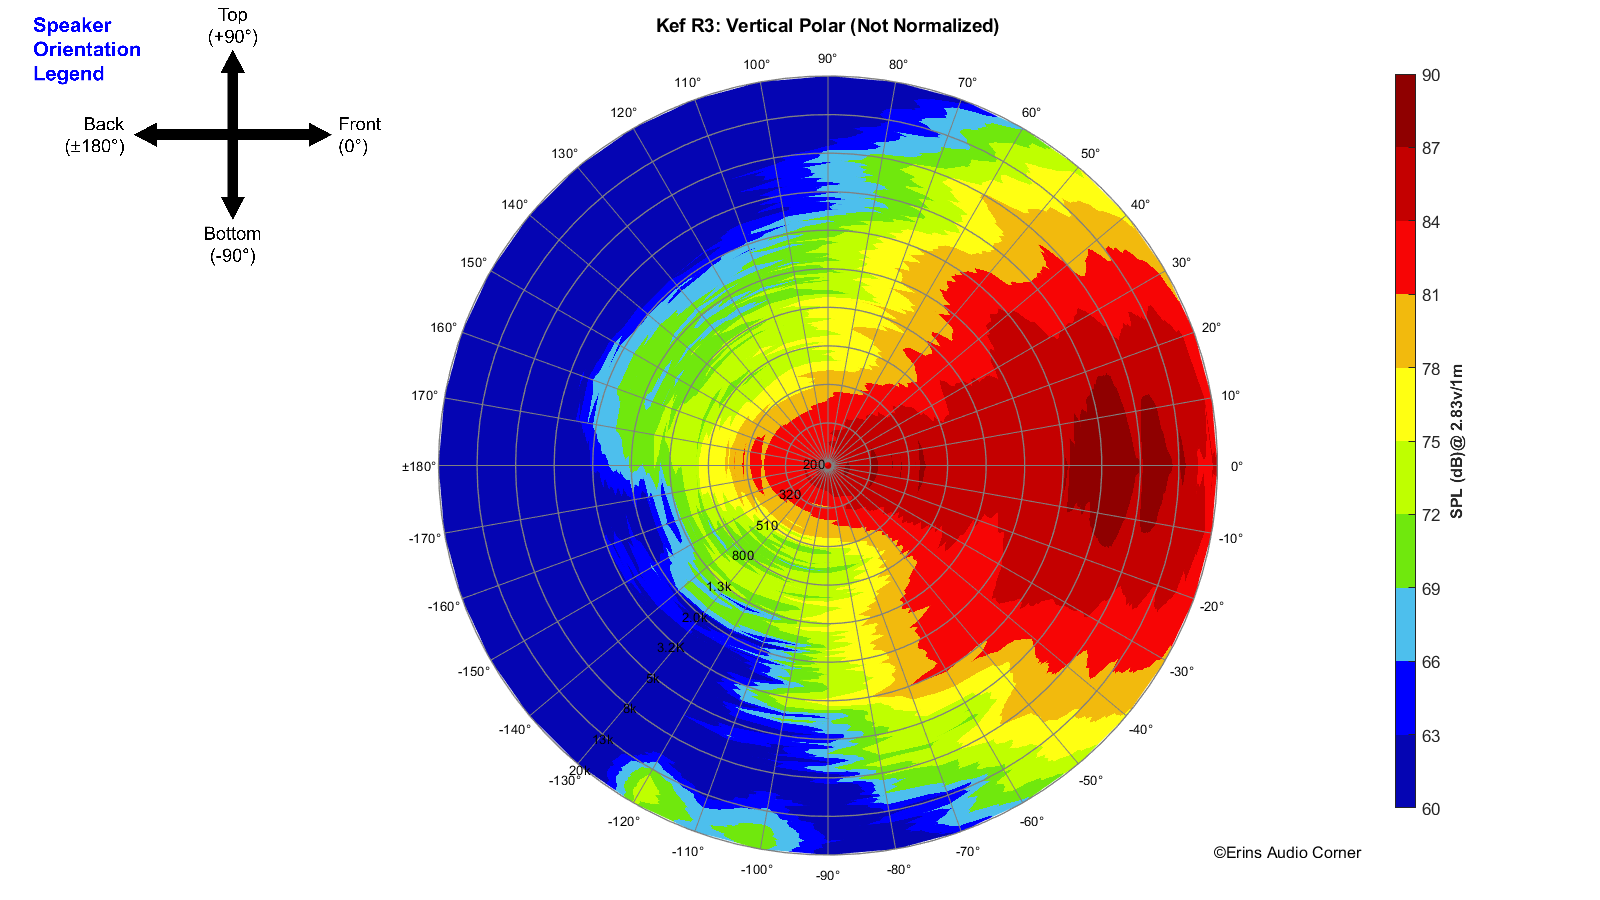
Vertical Polar (Globe) Plot:
This represents the sound field at 2 meters - above 200Hz - per the legend in the upper left.
Shadow Flare Position Impact on Frequency Response
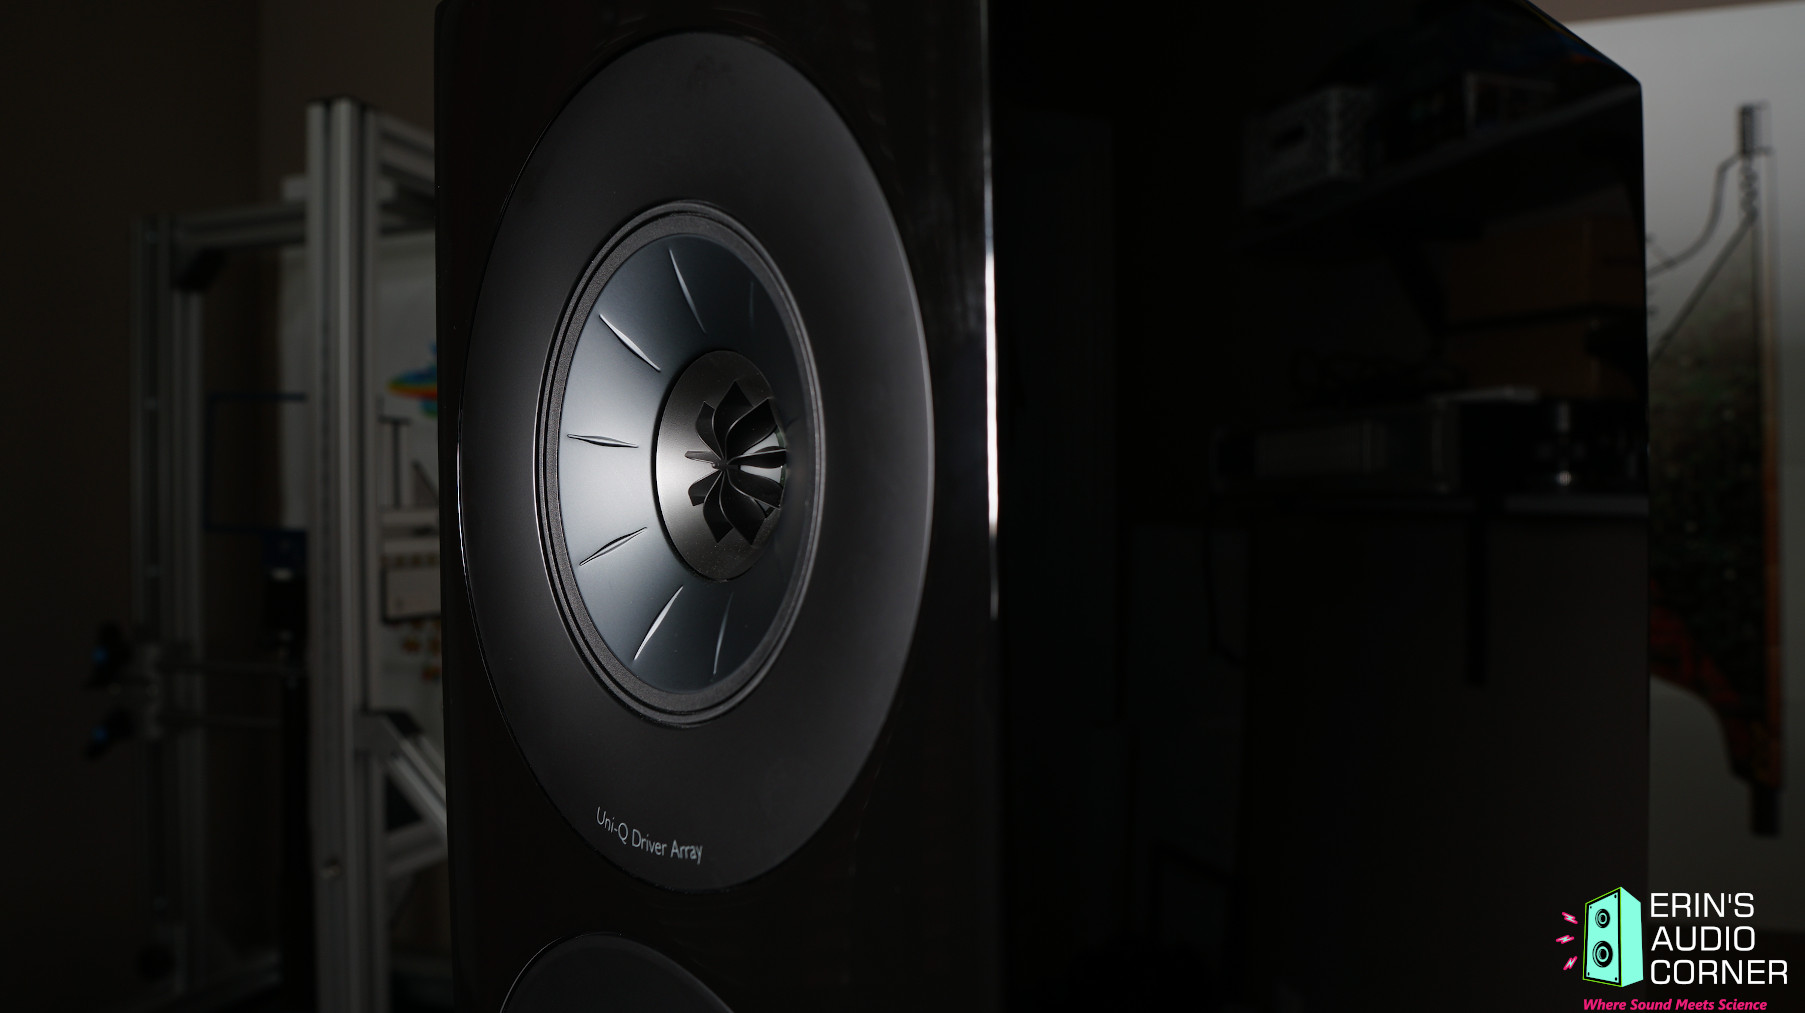
The shadow flare is the plastic trim ring that surrounds the concentric drive unit and helps provide a smooth transition from the midrange cone to the baffle.
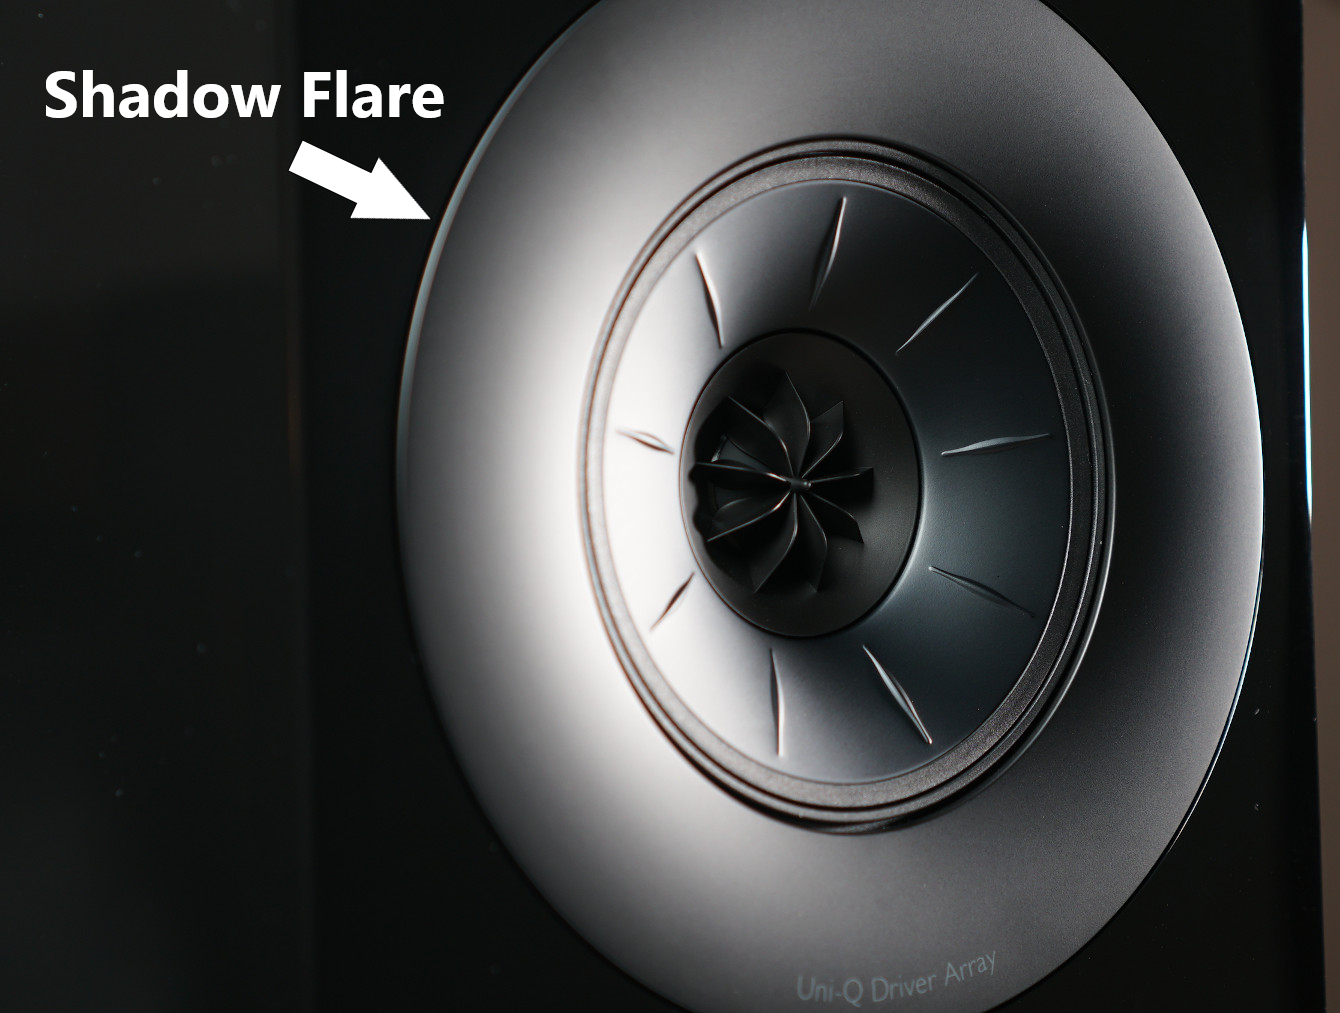
The trim ring is designed to sit flush with the midrange cone; pushed all the way in toward the drive unit. In some cases, it has been discovered that the speakers have arrived with the shadow flare positioned outward about 1mm (thus, sitting “above” of the baffle). This is believed to simply be from shipment and is an easy fix. Simply push the flare inward, going around the ring until it is properly seated (resulting in a 0.5mm lip between the flare and the speaker cutout).
Unfortunately, as has been evidence by some in-room measurements I have seen, many people are not aware that this is an issue and think nothing of it and the ill-effects of the improper positioning of the flare. Therefore, I did some investigating into the matter and have provided the results below.

As you can see, the position of the flare matters. As illustrated by the red curve, when the flare is sticking above the surface of the baffle and not pressed all the way in - to align with the midrange cone - the response dips as much as 12dB at approximately 1.3kHz! Per the blue curve, when the flare is pushed inward to align with the baffle face - but still not pushed all the way in - the response dips about 5dB at 1.1kHz. When the flare is pushed all the way in (black curve), the 1-2kHz region dip is resolved and instead you have a less severe dip centered around 700Hz.
The bottom line is If the shadow flare isn’t pushed all the way in there is a dip in response. One would think that flush with the baffle would be the way to go. But nope. And when you look more closely at the flare/midrange transition point it makes sense why. The shadow flare pushed all the way in (leaving a small lip between the flare and the speaker cutout) makes the flare flush with the surround edge. Any position out from that - like flush with the baffle - leaves a small gap and causes the response to dip ~1kHz. The further out the shadow flare, the more drastic the dip. You want the shadow flare to meet the drive unit, not the baffle. So, make sure the trim ring is pressed in and not sticking out above the baffle.
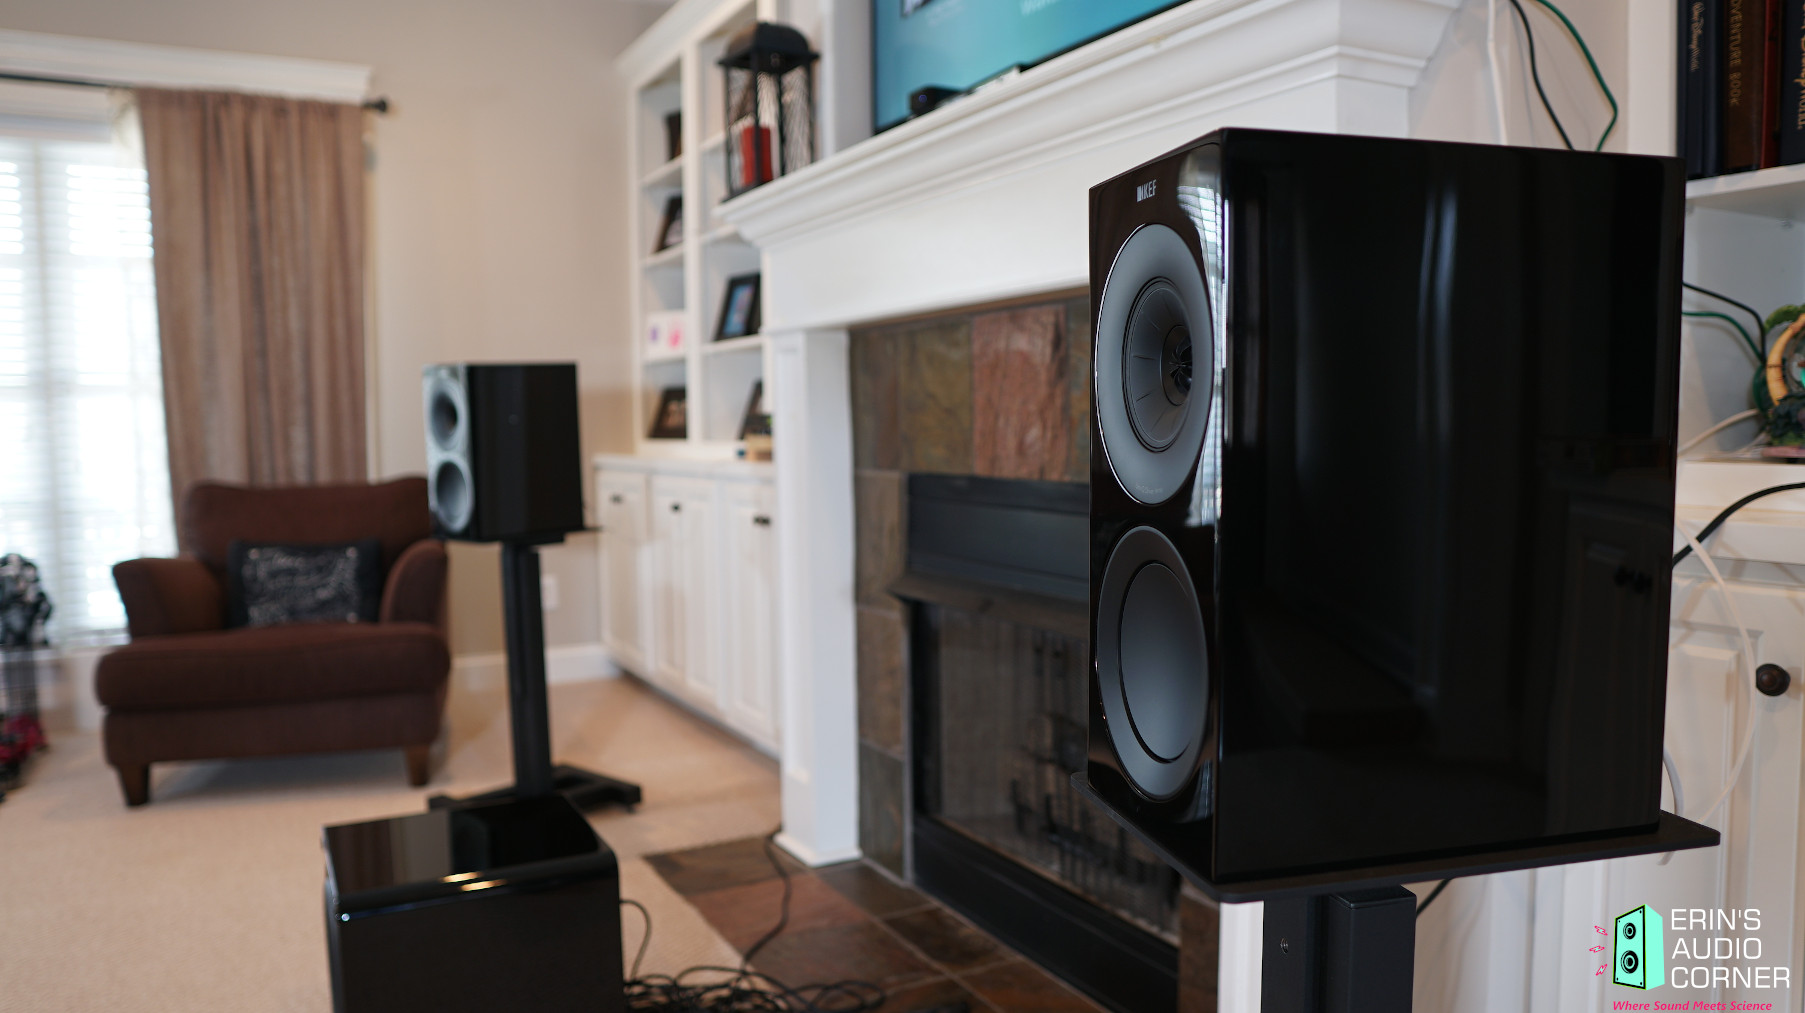
In-Room Measurements from the Listening Position
Below is a photograph of the speakers set up in my living room. The speakers were placed approximately 1.2m from the front wall (not the cabinets; but the actual wall). The listening position was approximately 4 meters from the speakers.
Below is the actual measured in-room response (with no DSP correction). This is a spatial average taken over approximately 1 cubic foot. As you can see, the actual in-room response aligns quite well with the prediction generated from the SPIN data. Pretty cool to see how anechoic measurements can reliably predict the actual in-room response. I feel many others often overlook this powerful benefit of the SPIN data.
Black = Predicted In-Room Response from SPIN data
Teal = Actual In-Room Measured Response from Main Listening Position
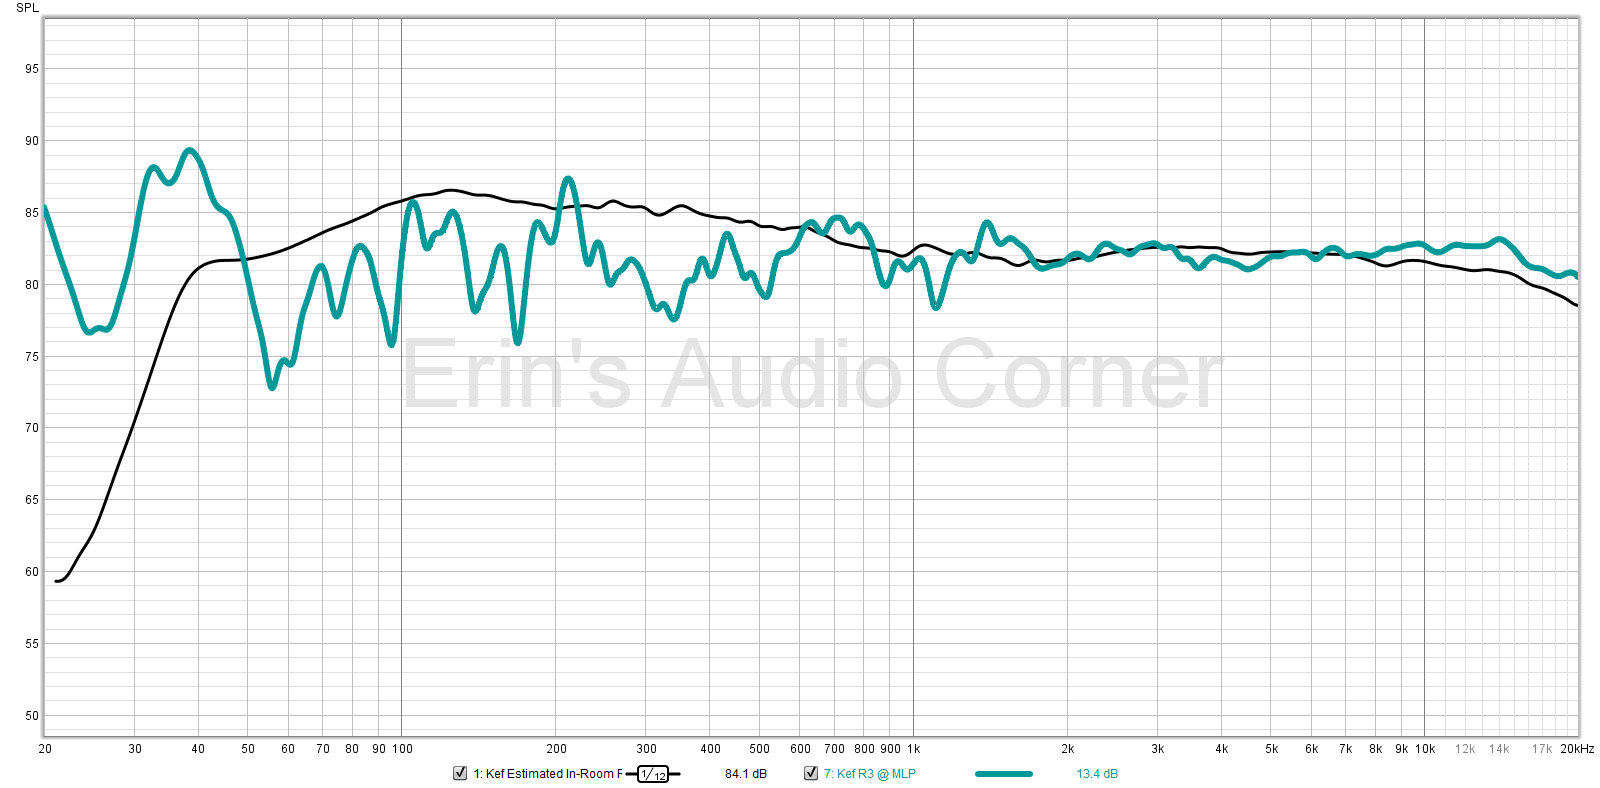
The prediction is quite accurate down to approximately 500Hz. Below this we see more deviation from the prediction. This is expected. The room takes over as you enter mid-to-low frequencies. Aside from the room dimensions, my couch, the back wall behind where I sit, the end table and the lamp near the listening position all influence the measured response. The dip from 150-400Hz is caused by the rear wall and/or couch as when the microphone is moved into the center of the room the dip fills in. Overall, what we see here is that the anechoic data can be conveniently used to predict the actual response one would expect to see in their own room.
Parting / Random Thoughts
I encourage you to watch my YouTube review for more details but a quick few notes:
- I love this black on black colorway.
- As I mentioned above, there is no coloration or resonance caused by the port. I note this because many of the speakers I have tested have midrange resonances caused by the port or passive radiator. There is no hint of that at all in this speaker. A welcomed change.
- The data does not indicate any resonances from anything. It is quite a neutral response, aside from the lifted treble on-axis. Moving to about ±10° horizontally and vertically, the treble is slightly reduced to provide a more neutral signature. For that reason, I would encourage you to experiment with toe-in and placement. You may find you like being on-axis or you may find you prefer the speakers toed in or out slightly. However, I would not go beyond ±20° as the response begins to drop above 8kHz.
- Running these speakers full-range (20Hz to 20kHz), they have nice kickdrum but not quite enough. The harmonics of the kickdrum, however, are quite nice and give a nice fullness to the kicks, even though the fundamental notes (50-60Hz) need help.
- Along that same token, I find these speakers to not do well in a “dead” room. They did much better in my living room than they did in my home theater, where the latter has copious sound absorption throughout.
- At approximately 4m listening distance, I found the max SPL to be about 95dB. Exceeding this resulted in an unpleasant sound for a variety of music. 95dB in-room at 4m is pretty loud and when you pair these speakers with a subwoofer, the max SPL is increased a bit more.
- In John Mayer’s “Free Fallin” (a live Tom Petty cover), I loved the timbre of his voice. And the air of the sound produced by the audience.
- The layering of these speakers is unmatched, to date. The soundstage isn’t terribly wide (I prefer a wider soundstage). However, the layering and the overall depth of the soundstage is incredible. The soundstage extends deep from front to back (with the right source music, of course). It is one of my favorite things about these speakers. A good example of this is in Fleetwood Mac’s “The Chain” as well as Phillip Bailey’s “Easy Lover” (at the 3:00 mark, where Phil Collins gets down on the drums).
- 2.5kHz sounded harsh to me and I couldn’t tell for sure if it was the speaker or the room. The data does not indicate it being the speaker itself. And in that same vein, the only thing in the data that might make sense as to a culprit is the expansion of directivity around this point. This could simply be coincidence.
- While using the speakers full-range is OK, I found that when I added a subwoofer (SVS SB-2000 Pro and SB-3000, separately), the entire sound became immensely more enveloping. Somehow, it even seems to increase the overall sense of “space” these speakers provide with the right recording. For that reason, I do suggest a subwoofer with these speakers. I suggest a crossover in the neighborhood of 60-80Hz. I’ve had good luck with the SVS subwoofers I’m currently reviewing and with their built-in DSP, I was able to resolve a couple room modes easily and take the system to a new level of fidelity.
- I used these speakers with the Parasound NewClassic 200 Integrated Amplifier. This integrated amplifier has 110w @ 4 and 8 ohms and was adequate to provide the output levels I needed at 4 meters listening distance. However, if you have a seating distance of more than 4m and want to listen at louder than - say - 95dB, I would suggest more power. I was also able to use the crossover within the Parasound to split the signal between the speakers and the SVS subwoofer.
- Make sure to push the trim rings all the way in.
As stated in the Foreword, this written review is purposely a cliff’s notes version. For more details about the performance (objectively and subjectively) please watch the YouTube video.
Support the Cause
If you like what you see here and want to help support the cause there are a few ways you can do so:
- Join my Patreon here.
- Contribute via PayPal here.
- Using my Amazon affiliate link below as it helps me gain a small commission at no additional cost to you.
Your support helps me pay for new items to test, hardware, miscellaneous items and costs of the site’s server space and bandwidth. All of which I otherwise pay out of pocket. So, if you can help chip in a few bucks, know that it is very much appreciated.
You can also join my Facebook and YouTube pages if you’d like to follow along with updates.
You can also join my Facebook and YouTube pages if you’d like to follow along with updates.