Foreword / YouTube Video Review
I was loaned these by the manufacturer to review. I was not paid nor did I receive any other form of compensation for this review.
All my reviews are done on my own time with great care to give you all the best set of data and information I can provide in order to help you make a well-informed purchase decision. I offer this for free to all who are interested. In return, if you want to support this site please see the bottom of this review for ways you can help. It is greatly appreciated.
If, after reading this review, you decide you’d like to buy this speaker then please consider using my affiliate link below. I earn a small commission from it at no additional cost to you:
Crutchfield Purchase Link
The review on this website is a brief overview and summary of the objective performance of this speaker. It is not intended to be a deep dive. Moreso, this is information for those who prefer “just the facts” and prefer to have the data without the filler.
- Product info:
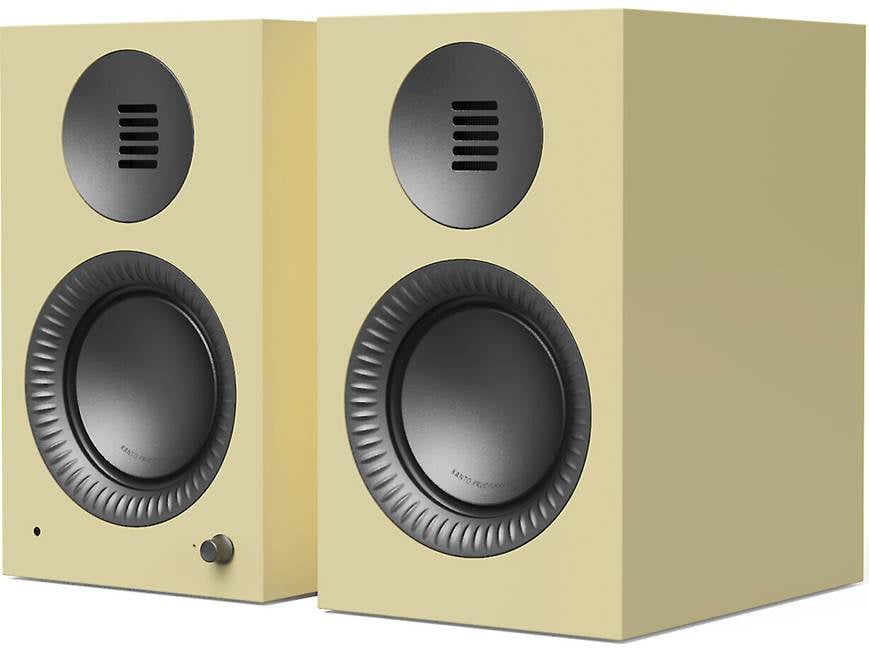
- Air Motion Transformer (AMT) folded ribbon tweeter
- 5-1/4" aluminum woofer
- bass-reflex (ported) cabinet
- frequency response: 50-22,000 Hz
- built-in 130-watt Class D amplifier with DSP
- Bluetooth® 5.4 with high-quality aptX™ Adaptive audio coding for greater sonic detail with compatible devices
- high-resolution 24-bit/96kHz DAC
- low-pass filter sends frequencies below 80 Hz to a connected subwoofer
- remote control included
- Connections:
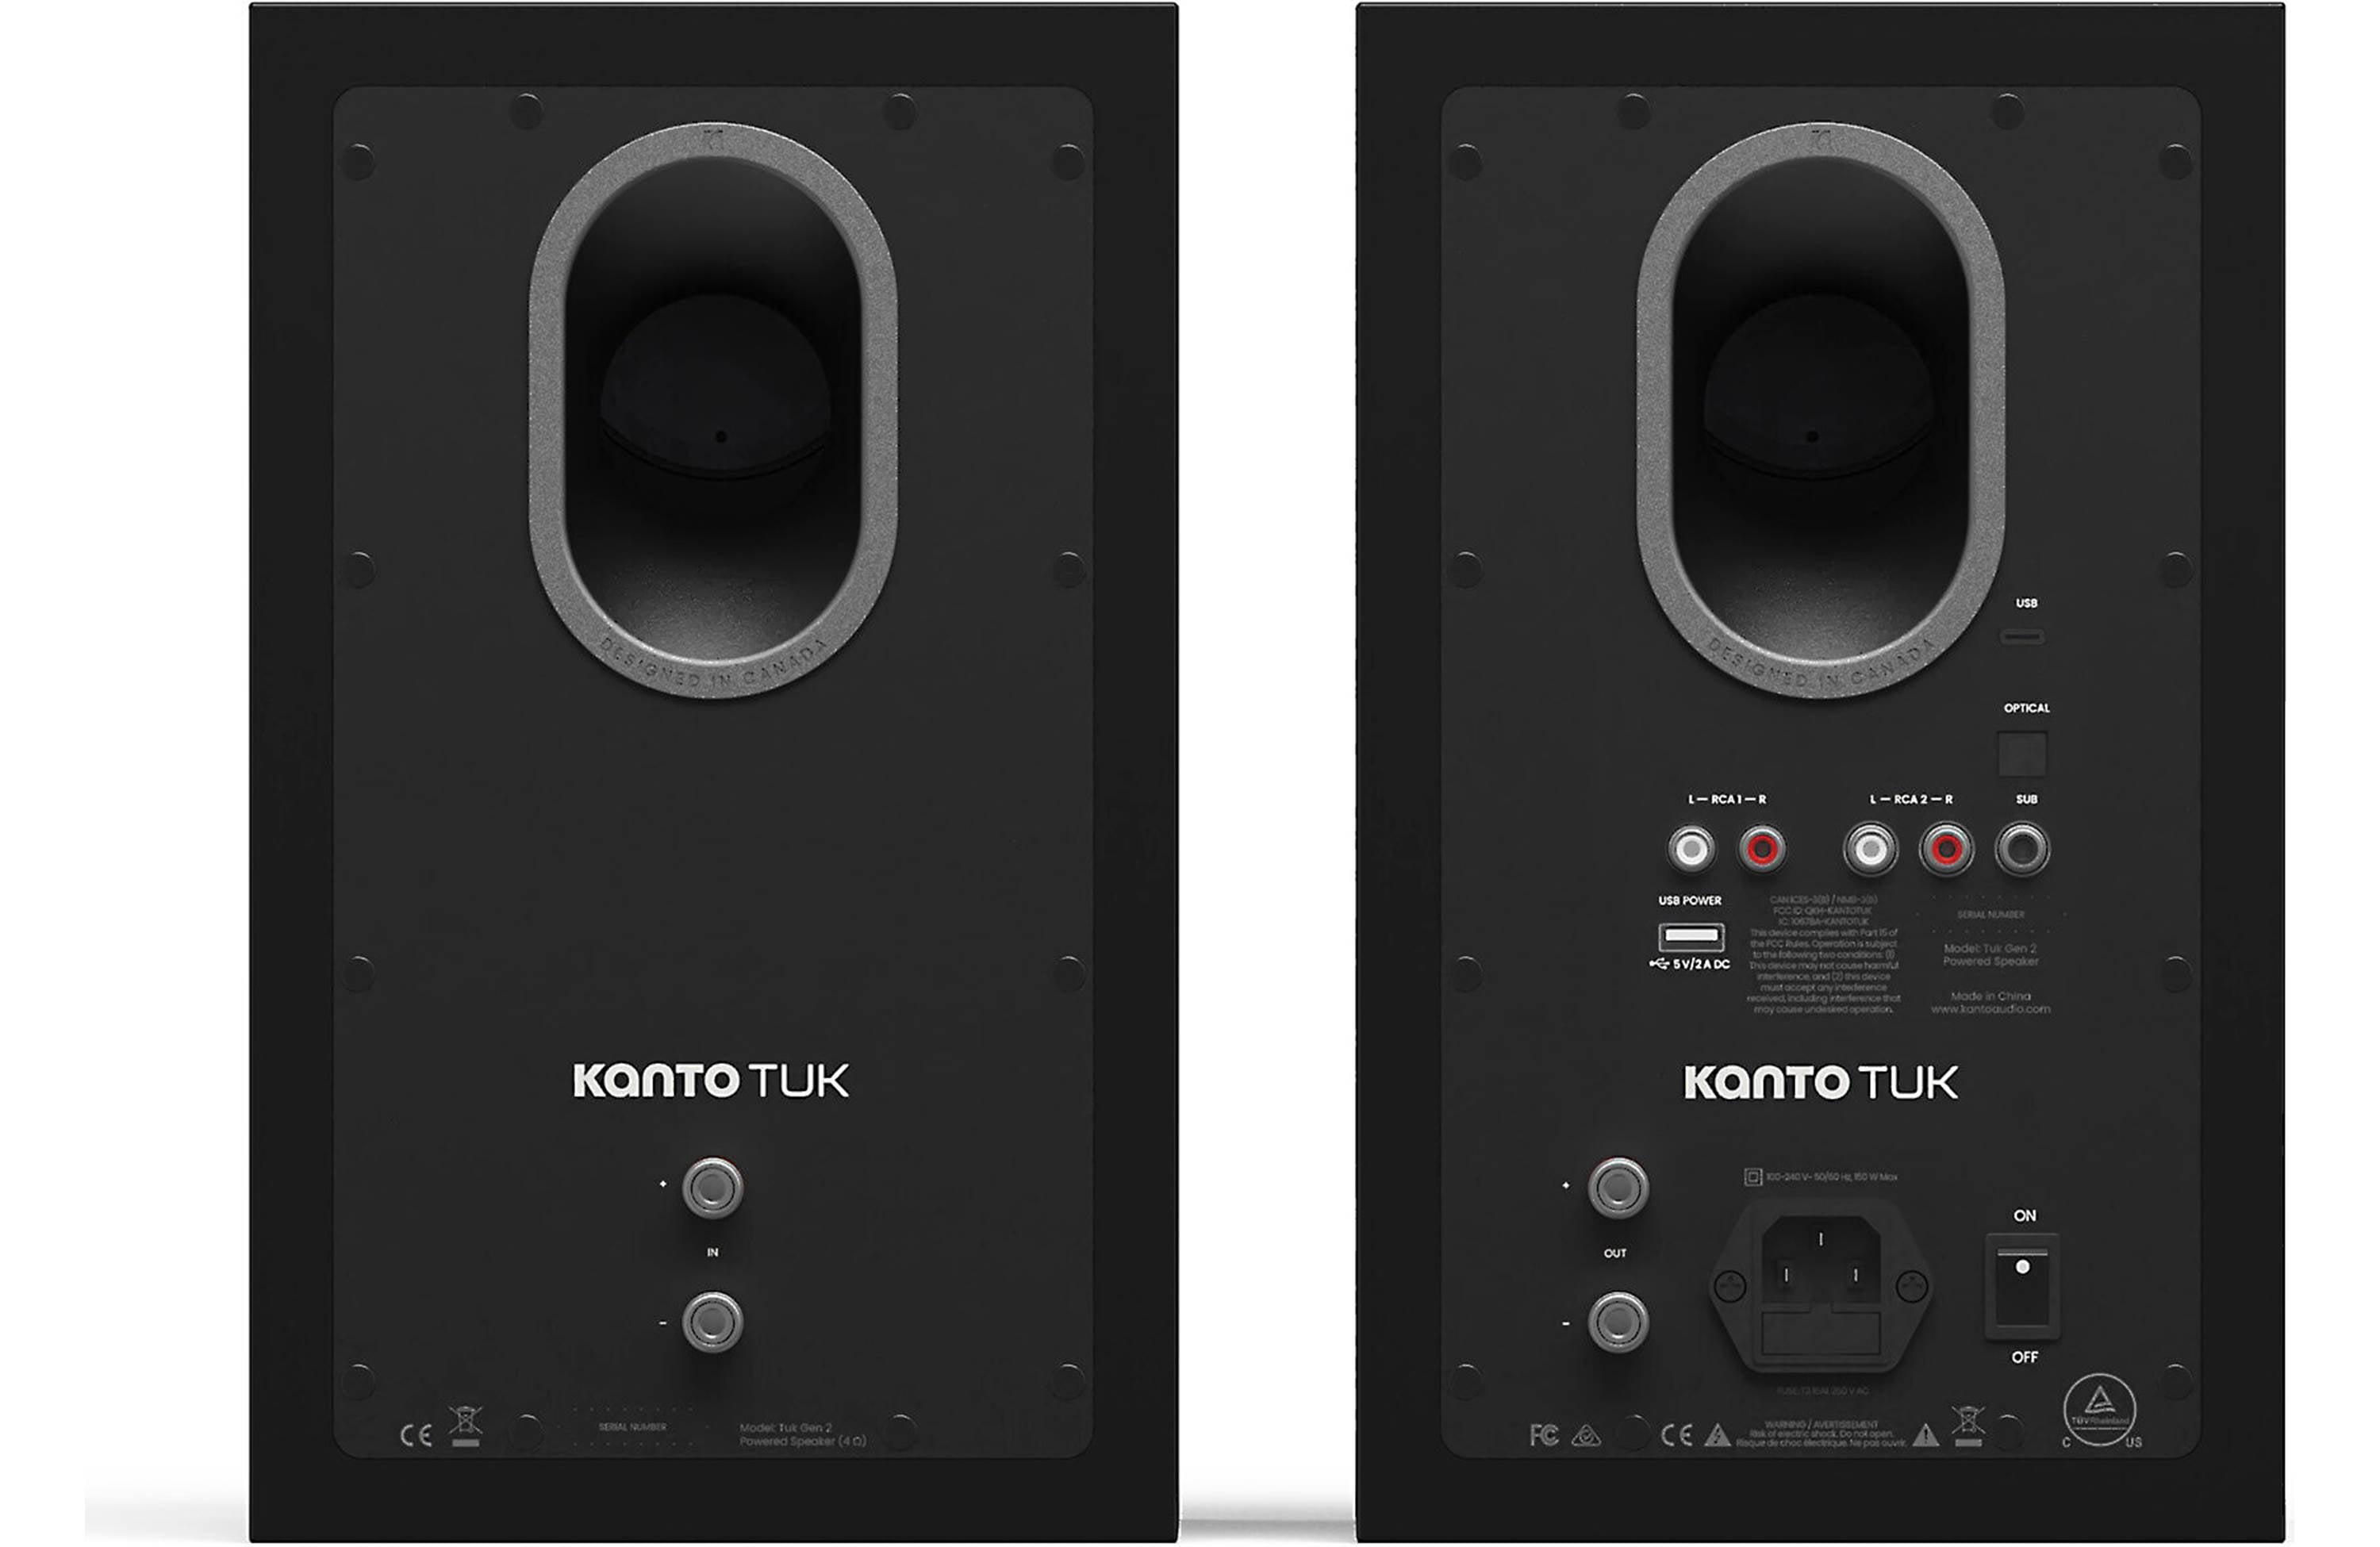
- Toslink digital optical input
- 2 stereo RCA inputs (3.5mm-to-RCA cable included)
- mono RCA subwoofer output
- USB-C input for connecting a computer
- USB Type-A charging port (5V/2A)
- 15’ speaker cable included (required for connection between speakers)
- Other info:
- dimensions: 7.2"W x 12"H x 10"D
- weight: 12.4 lbs. (active speaker), 11.4 lbs. (passive speaker)
As of this writing MSRP is $899-999/pair depending on color/finish.
CTA-2034 (SPINORAMA) and Accompanying Data
All data collected using Klippel’s Near-Field Scanner. The Near-Field-Scanner 3D (NFS) offers a fully automated acoustic measurement of direct sound radiated from the source under test. The radiated sound is determined in any desired distance and angle in the 3D space outside the scanning surface. Directivity, sound power, SPL response and many more key figures are obtained for any kind of loudspeaker and audio system in near field applications (e.g. studio monitors, mobile devices) as well as far field applications (e.g. professional audio systems). Utilizing a minimum of measurement points, a comprehensive data set is generated containing the loudspeaker’s high resolution, free field sound radiation in the near and far field. For a detailed explanation of how the NFS works and the science behind it, please watch the below discussion with designer Christian Bellmann:
IMPORTANT SETUP INFO: This speaker was measured with the reference point at the tweeter. Speaker was broken in. DSP settings were “default” with no EQ or other settings enabled. However, I do provide DSP tonal-balance adjustment results at the end of this review.
Measurements are provided in a format in accordance with the Standard Method of Measurement for In-Home Loudspeakers (ANSI/CTA-2034-A R-2020). For more information, please see this link.
CTA-2034 / SPINORAMA:
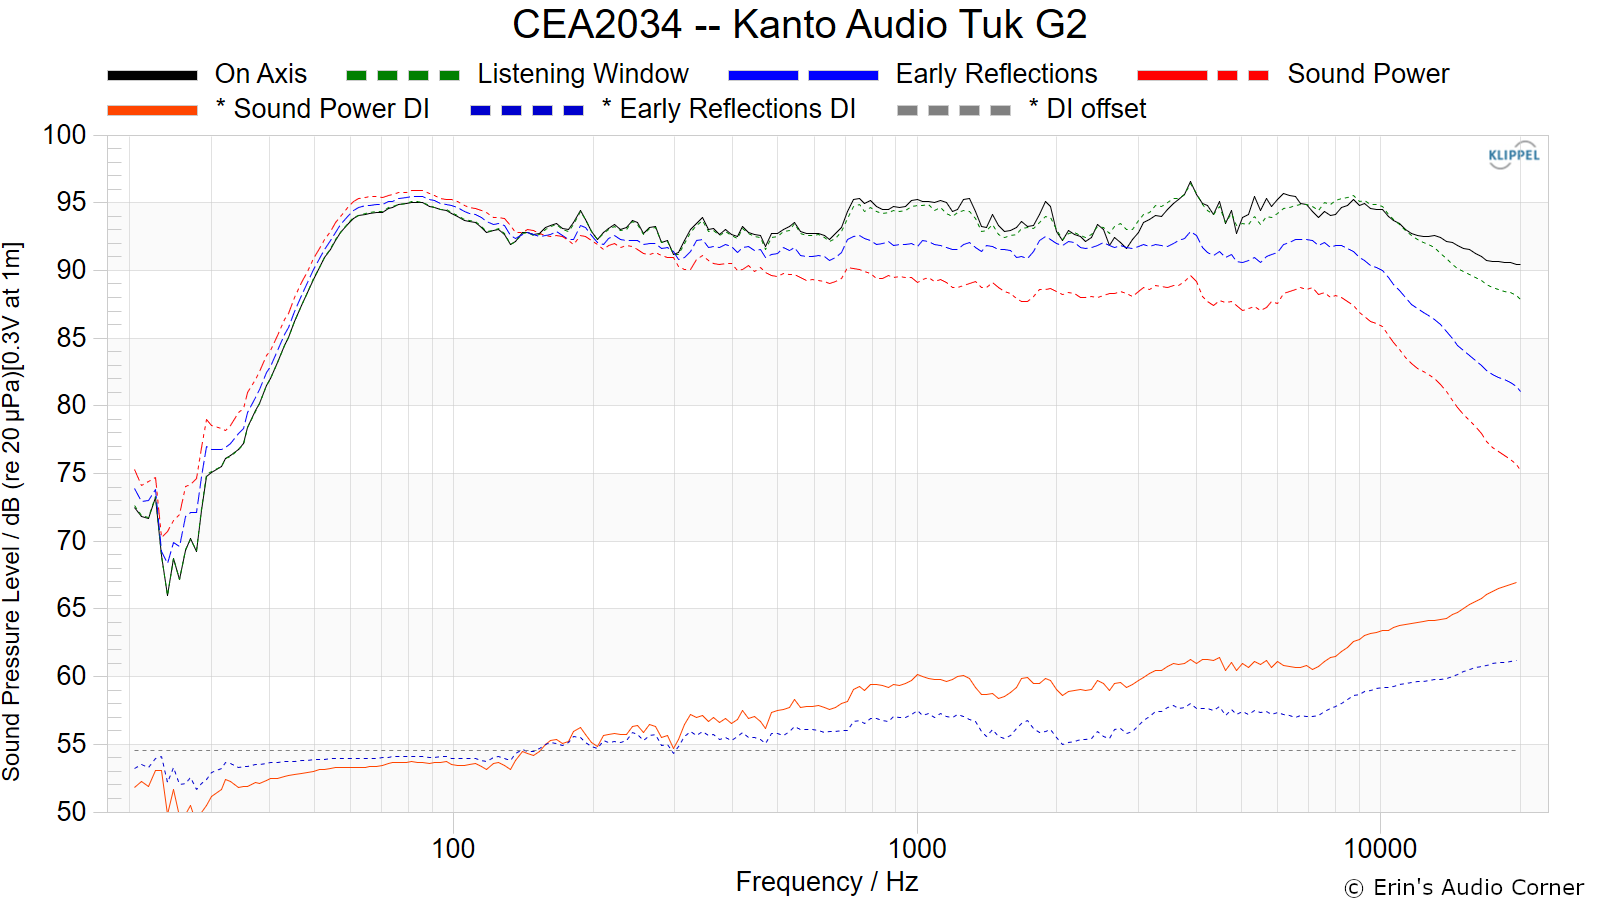
The On-axis Frequency Response (0°) is the universal starting point and in many situations it is a fair representation of the first sound to arrive at a listener’s ears.
The Listening Window is a spatial average of the nine amplitude responses in the ±10º vertical and ±30º horizontal angular range. This encompasses those listeners who sit within a typical home theater audience, as well as those who disregard the normal rules when listening alone.
The Early Reflections curve is an estimate of all single-bounce, first-reflections, in a typical listening room.
Sound Power represents all of the sounds arriving at the listening position after any number of reflections from any direction. It is the weighted rms average of all 70 measurements, with individual measurements weighted according to the portion of the spherical surface that they represent.
Sound Power Directivity Index (SPDI): In this standard the SPDI is defined as the difference between the listening window curve and the sound power curve.
Early Reflections Directivity Index (EPDI): is defined as the difference between the listening window curve and the early reflections curve. In small rooms, early reflections figure prominently in what is measured and heard in the room so this curve may provide insights into potential sound quality.
Early Reflections Breakout:
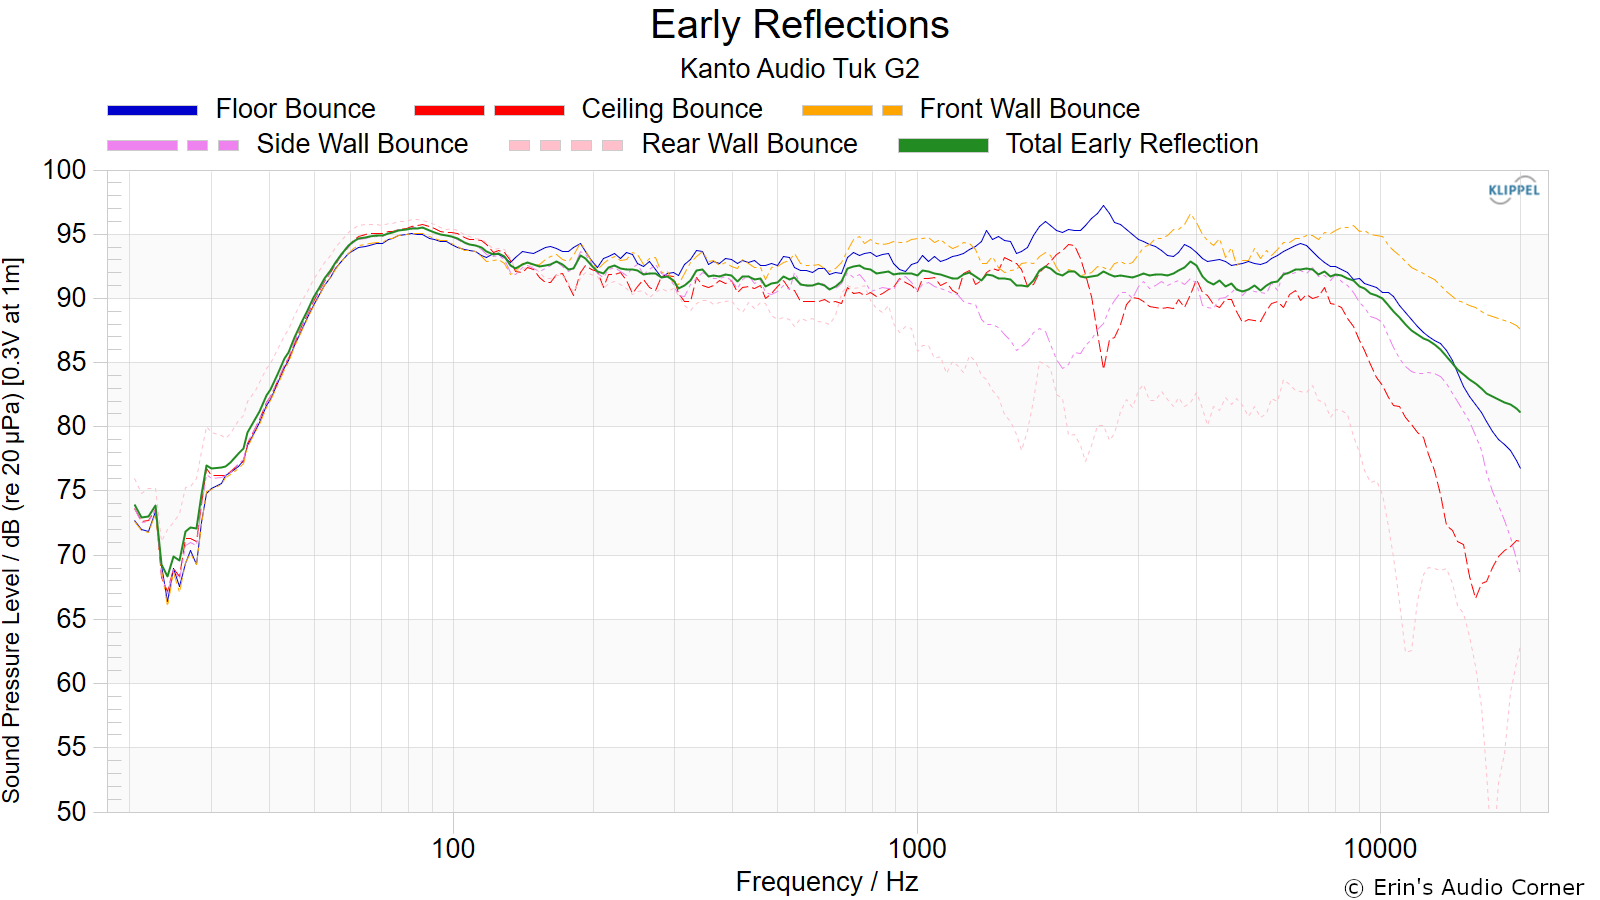
Floor bounce: average of 20º, 30º, 40º down
Ceiling bounce: average of 40º, 50º, 60º up
Front wall bounce: average of 0º, ± 10º, ± 20º, ± 30º horizontal
Side wall bounces: average of ± 40º, ± 50º, ± 60º, ± 70º, ± 80º horizontal
Rear wall bounces: average of 180º, ± 90º horizontal
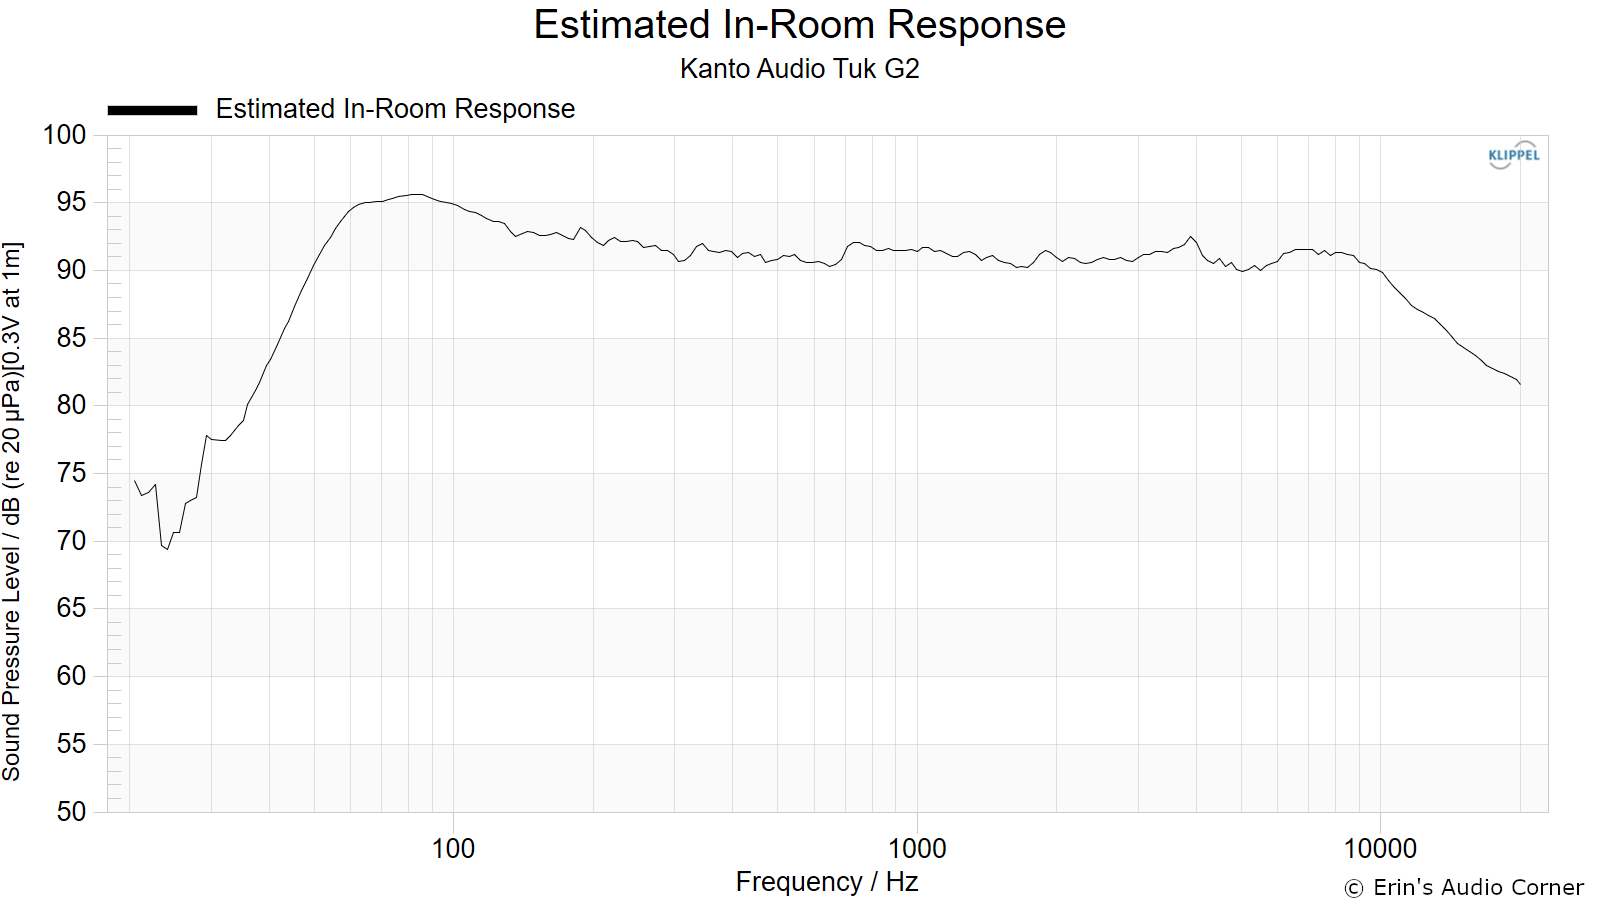
Estimated In-Room Response:
In theory, with complete 360-degree anechoic data on a loudspeaker and sufficient acoustical and geometrical data on the listening room and its layout it would be possible to estimate with good precision what would be measured by an omnidirectional microphone located in the listening area of that room. By making some simplifying assumptions about the listening space, the data set described above permits a usefully accurate preview of how a given loudspeaker might perform in a typical domestic listening room. Obviously, there are no guarantees, because individual rooms can be acoustically aberrant. Sometimes rooms are excessively reflective (“live”) as happens in certain hot, humid climates, with certain styles of interior décor and in under-furnished rooms. Sometimes rooms are excessively “dead” as in other styles of décor and in some custom home theaters where acoustical treatment has been used excessively. This form of post processing is offered only as an estimate of what might happen in a domestic living space with carpet on the floor and a “normal” amount of seating, drapes and cabinetry.
For these limited circumstances it has been found that a usefully accurate Predicted In-Room (PIR) amplitude response, also known as a “room curve” is obtained by a weighted average consisting of 12 % listening window, 44 % early reflections and 44 % sound power. At very high frequencies errors can creep in because of excessive absorption, microphone directivity, and room geometry. These discrepancies are not considered to be of great importance.
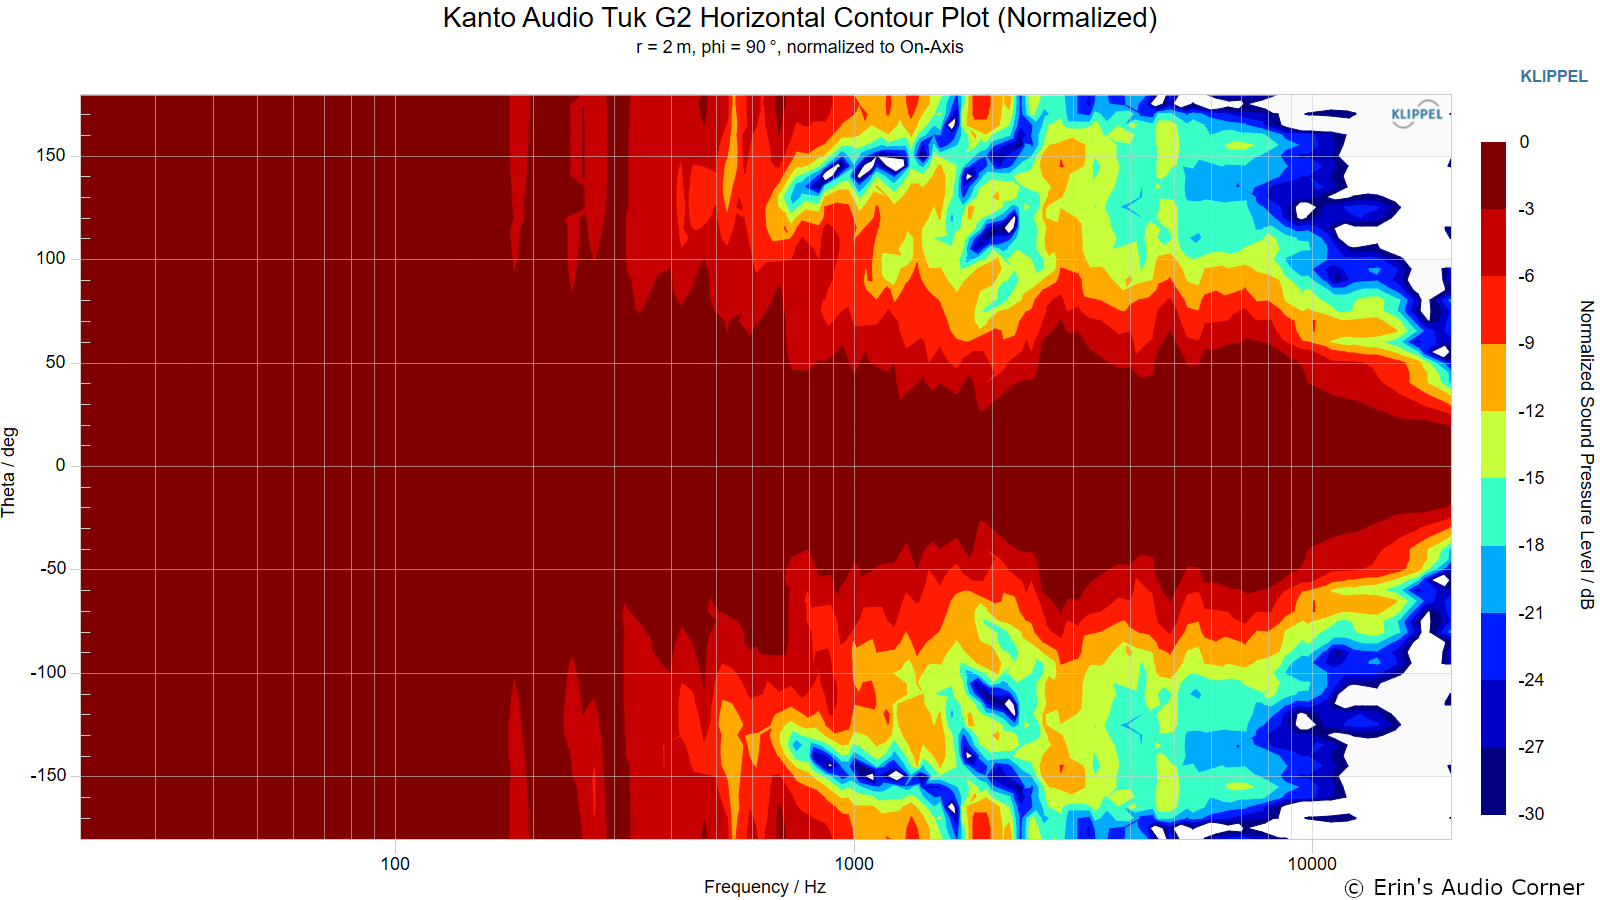
Horizontal Contour Plot (normalized):
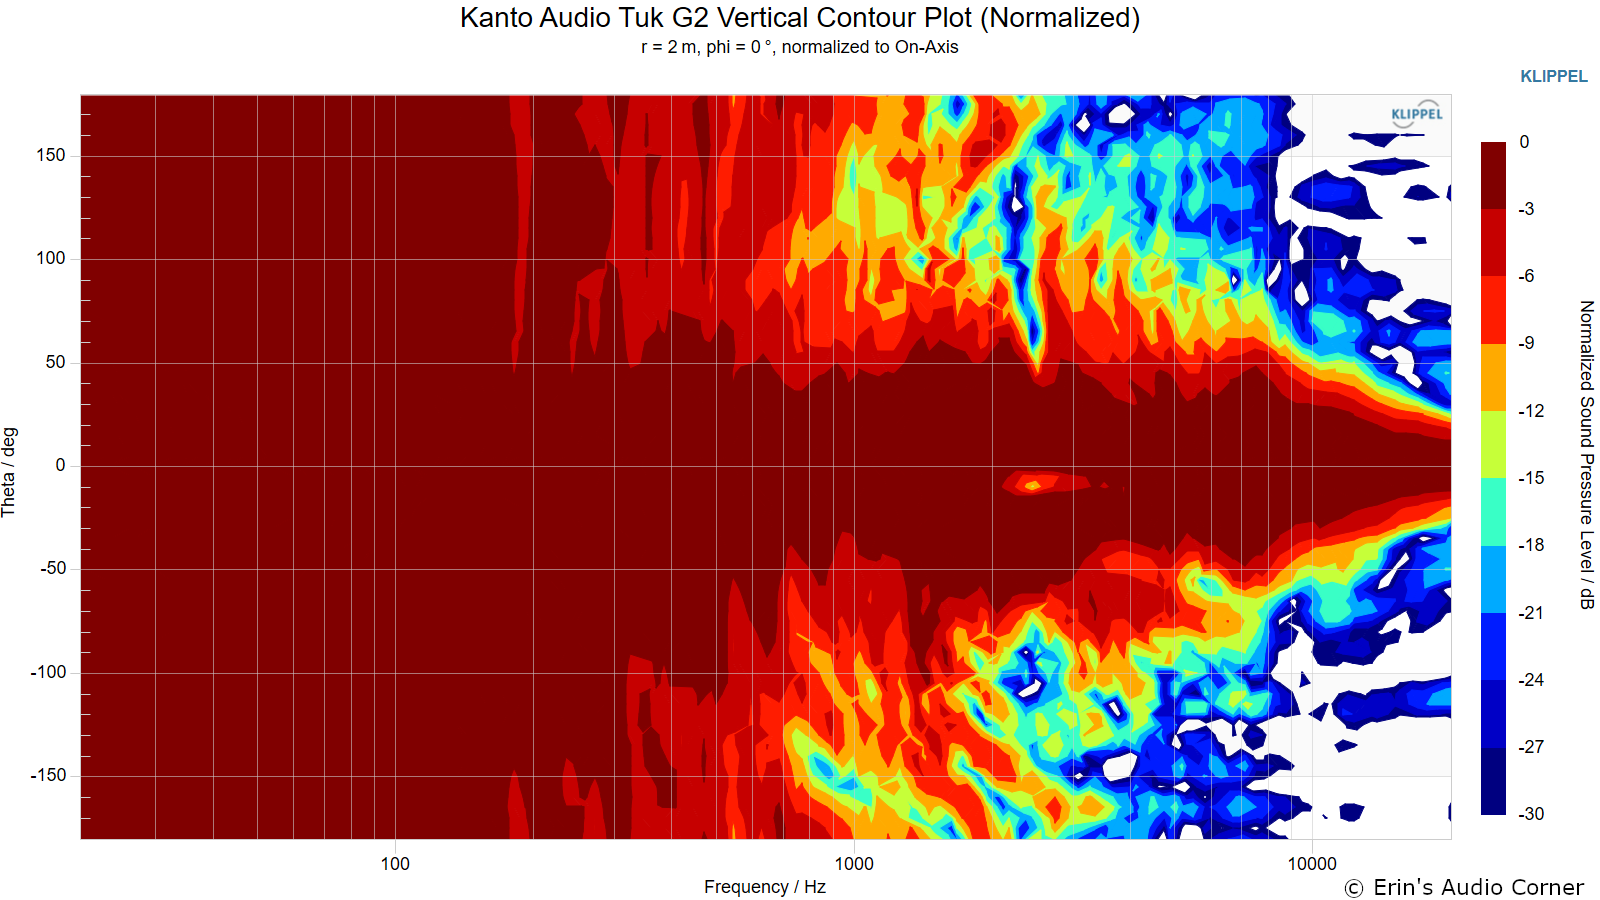
Vertical Contour Plot (normalized):
Additional Measurements
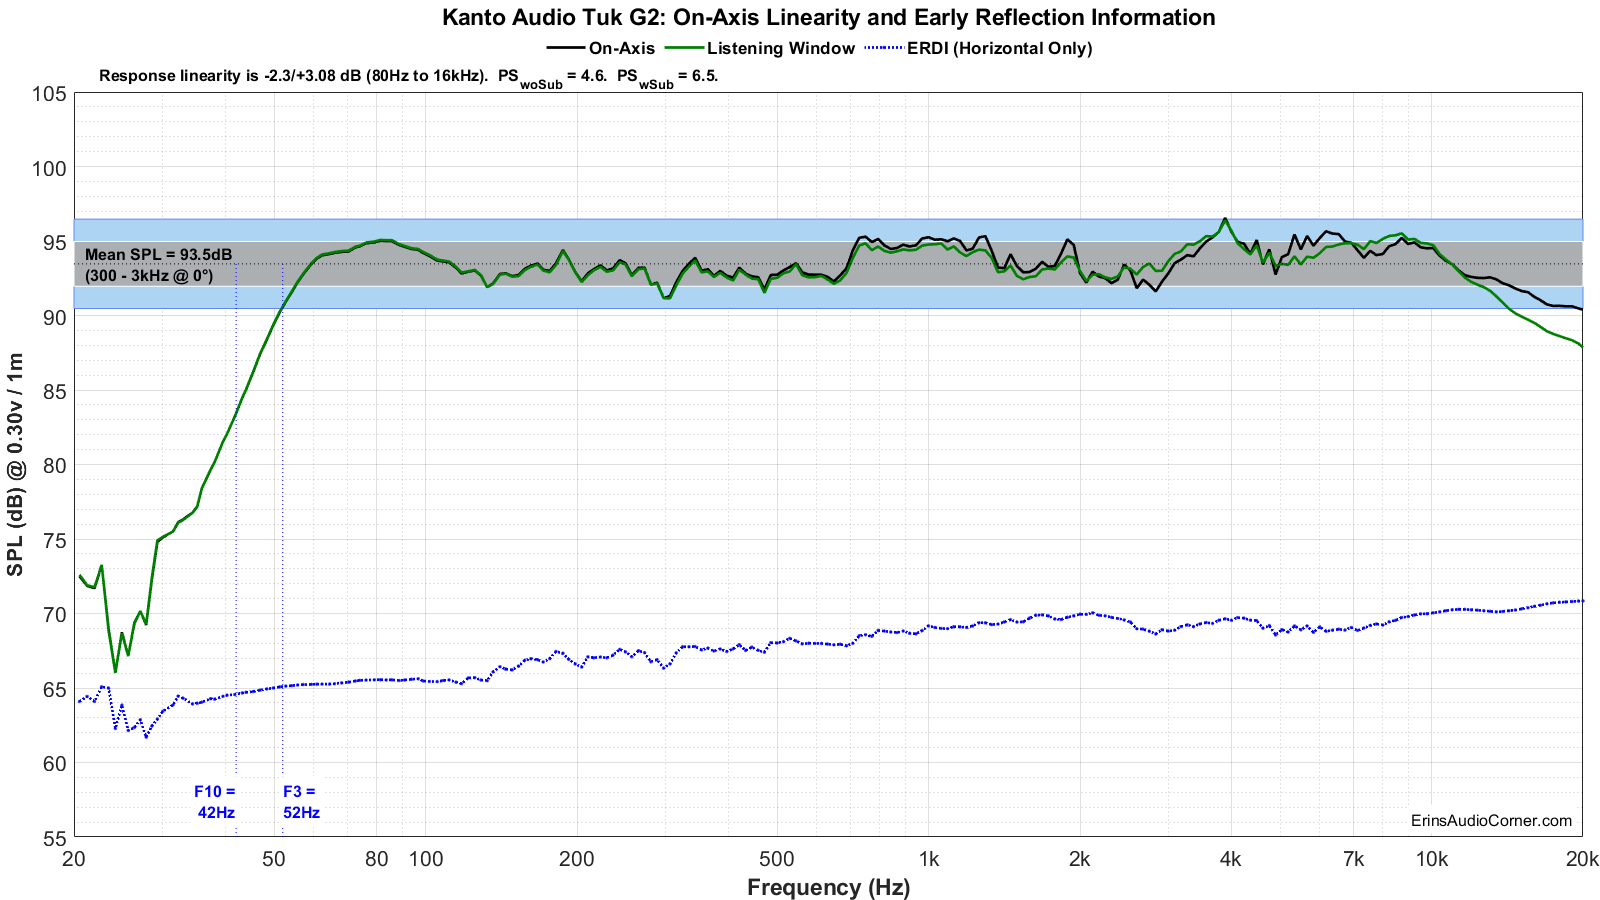
Response Linearity
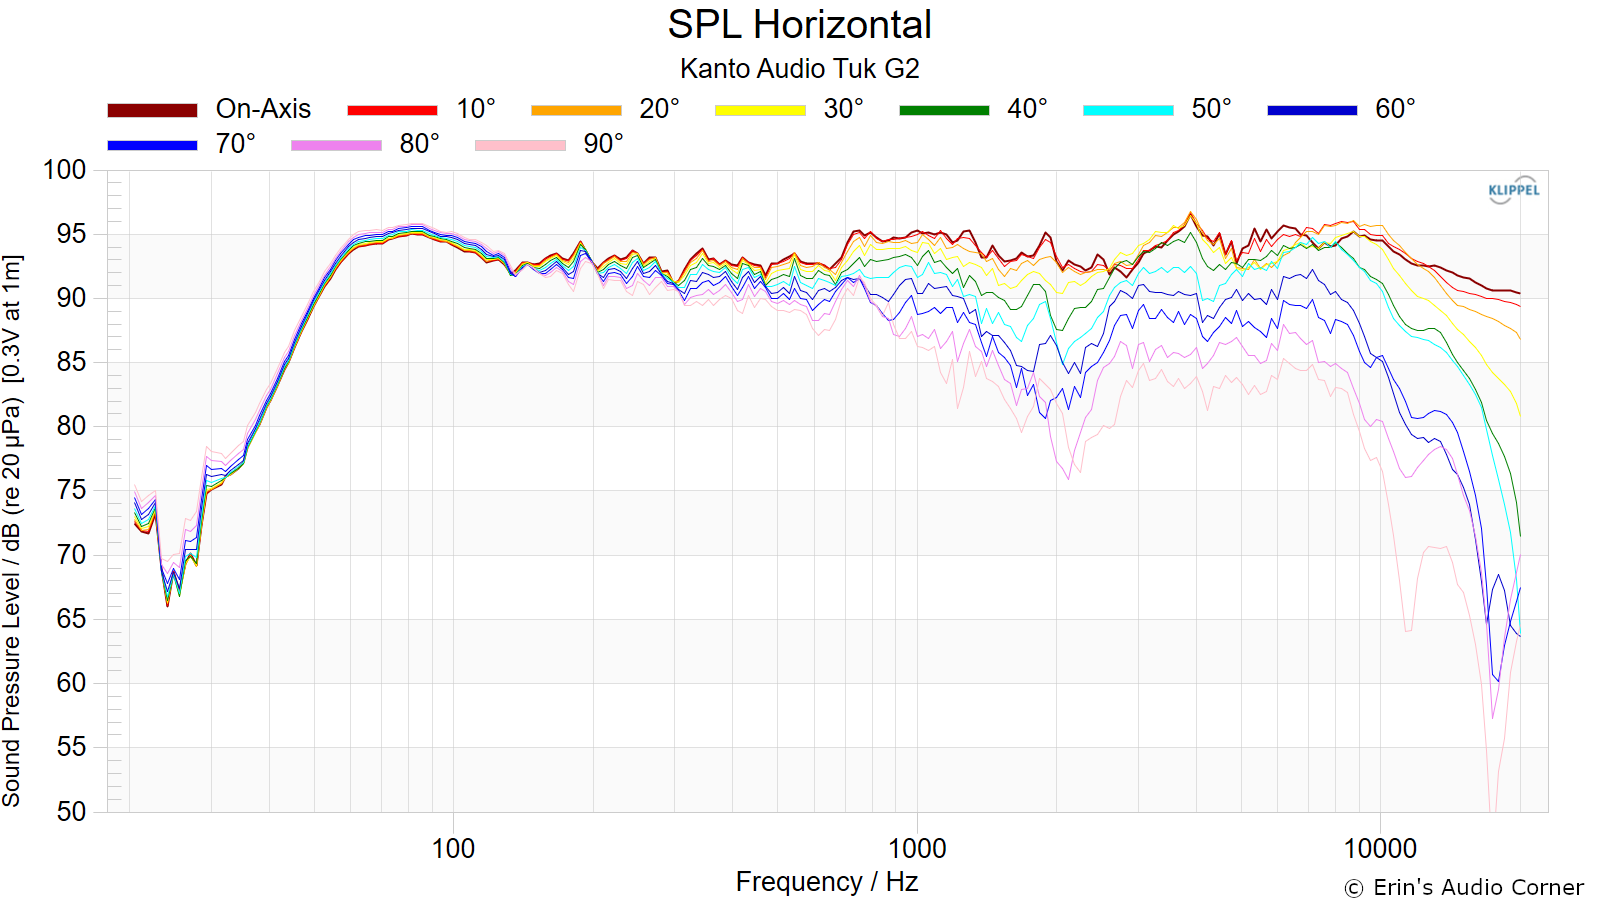
Horizontal Frequency Response:
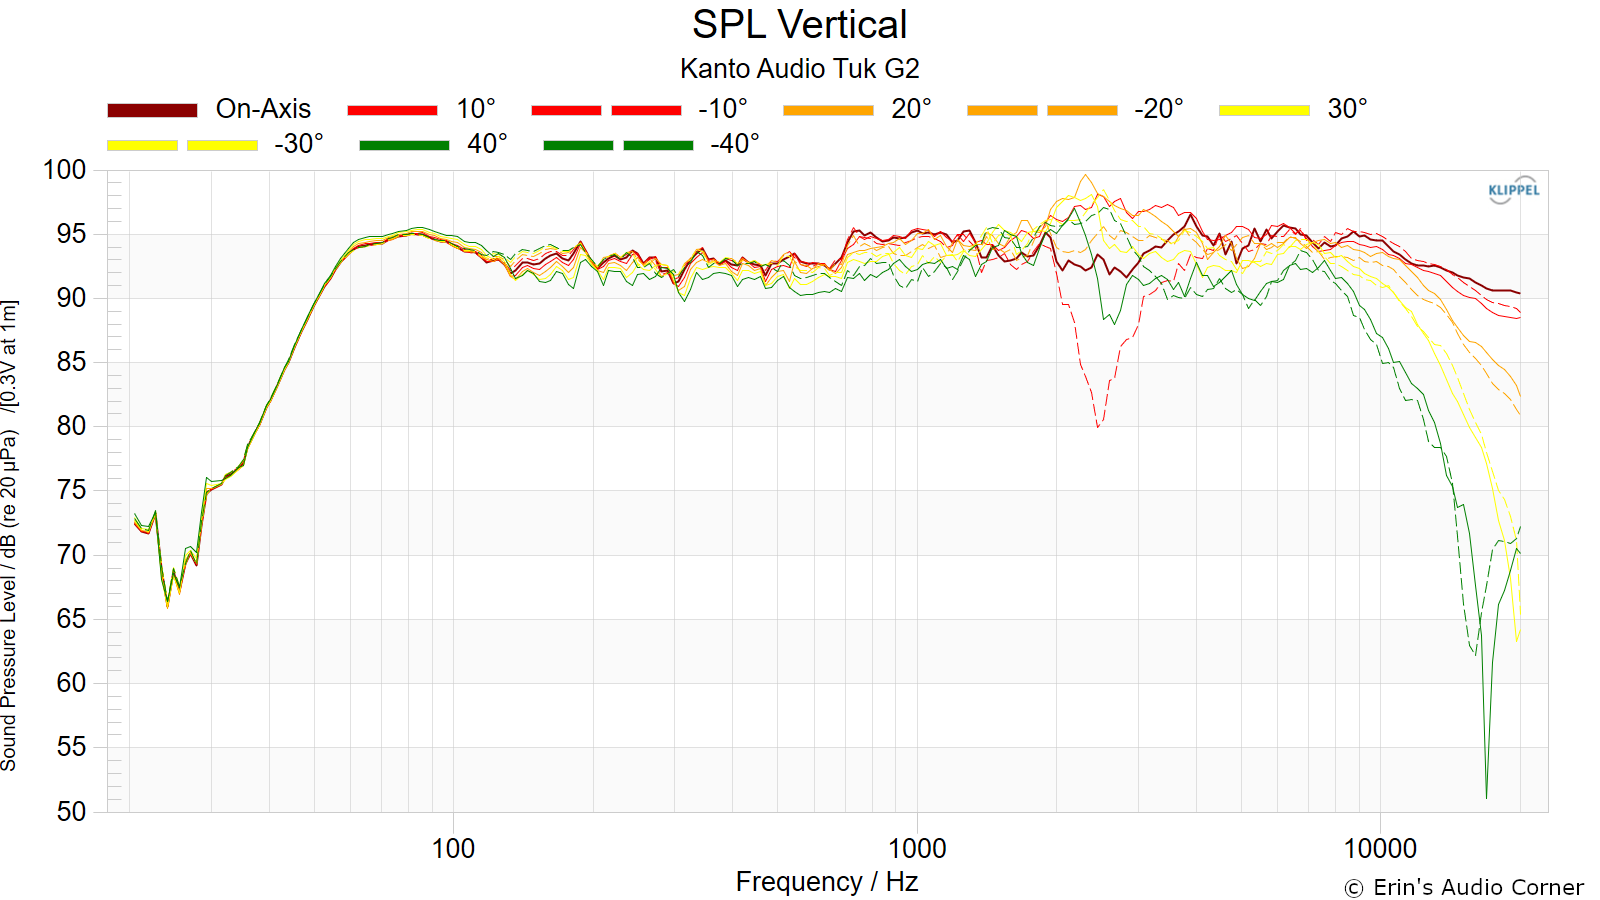
Vertical Frequency Response:
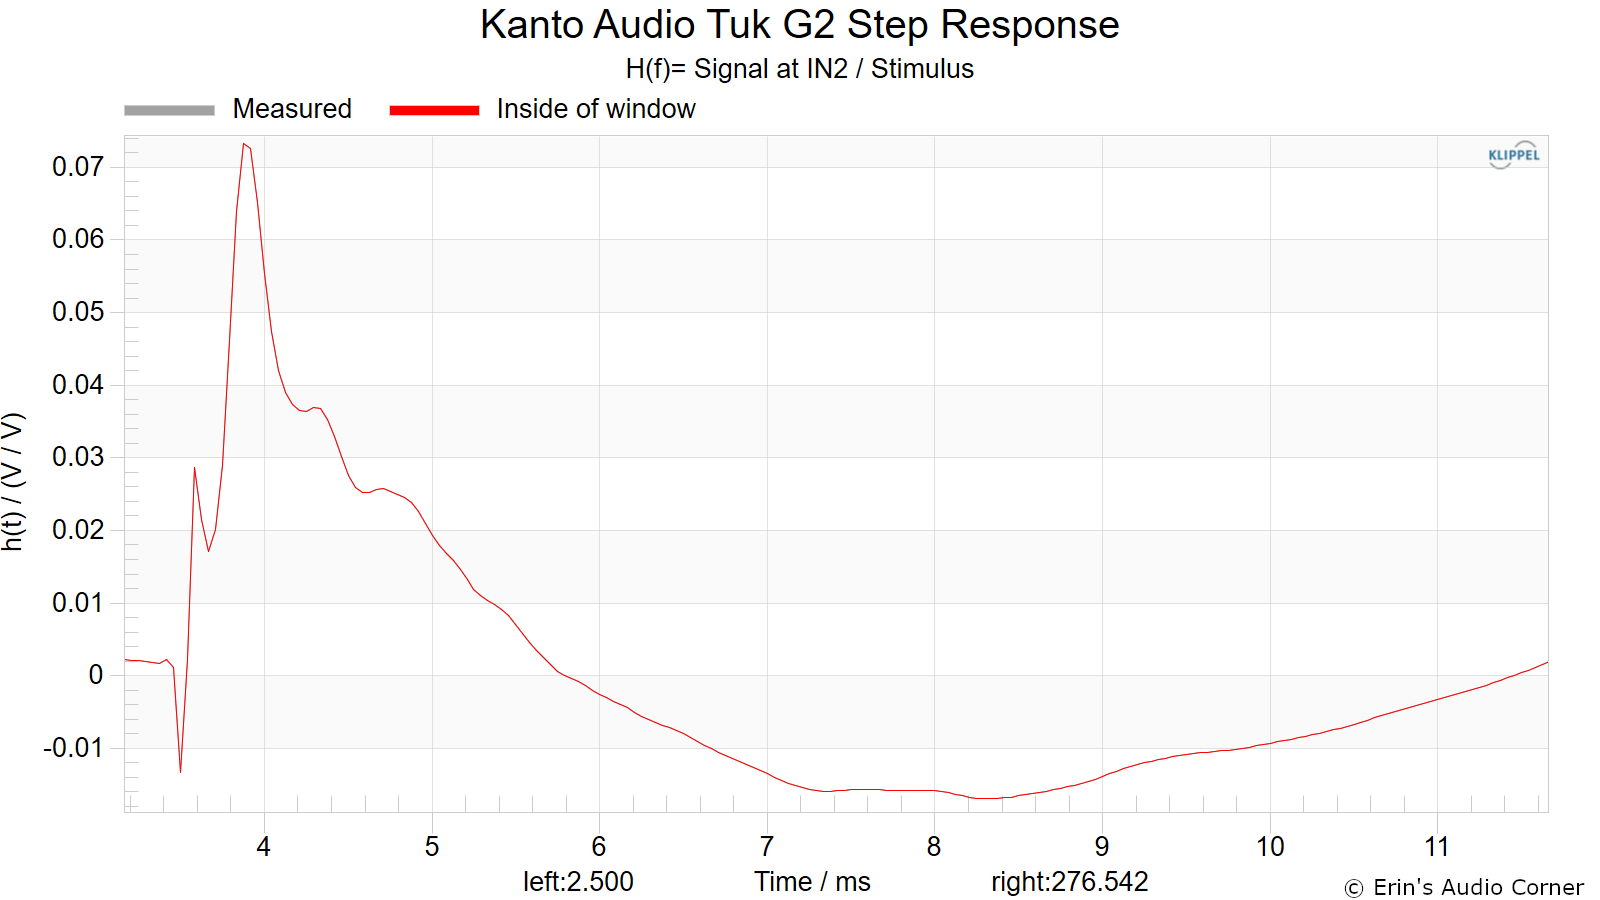
Step Response
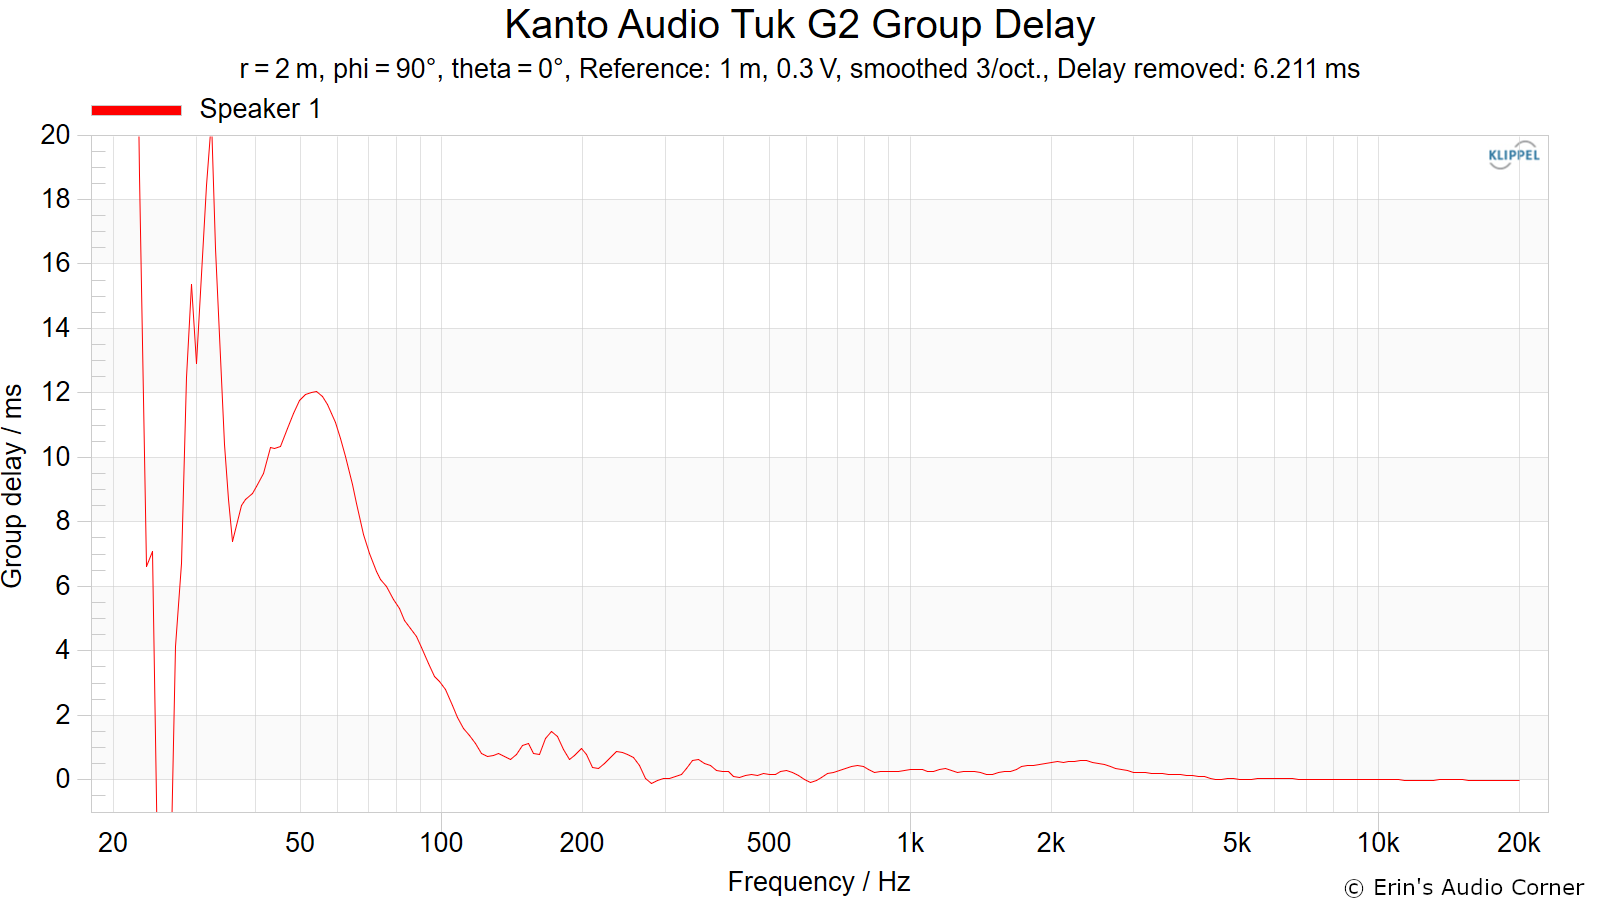
Group Delay
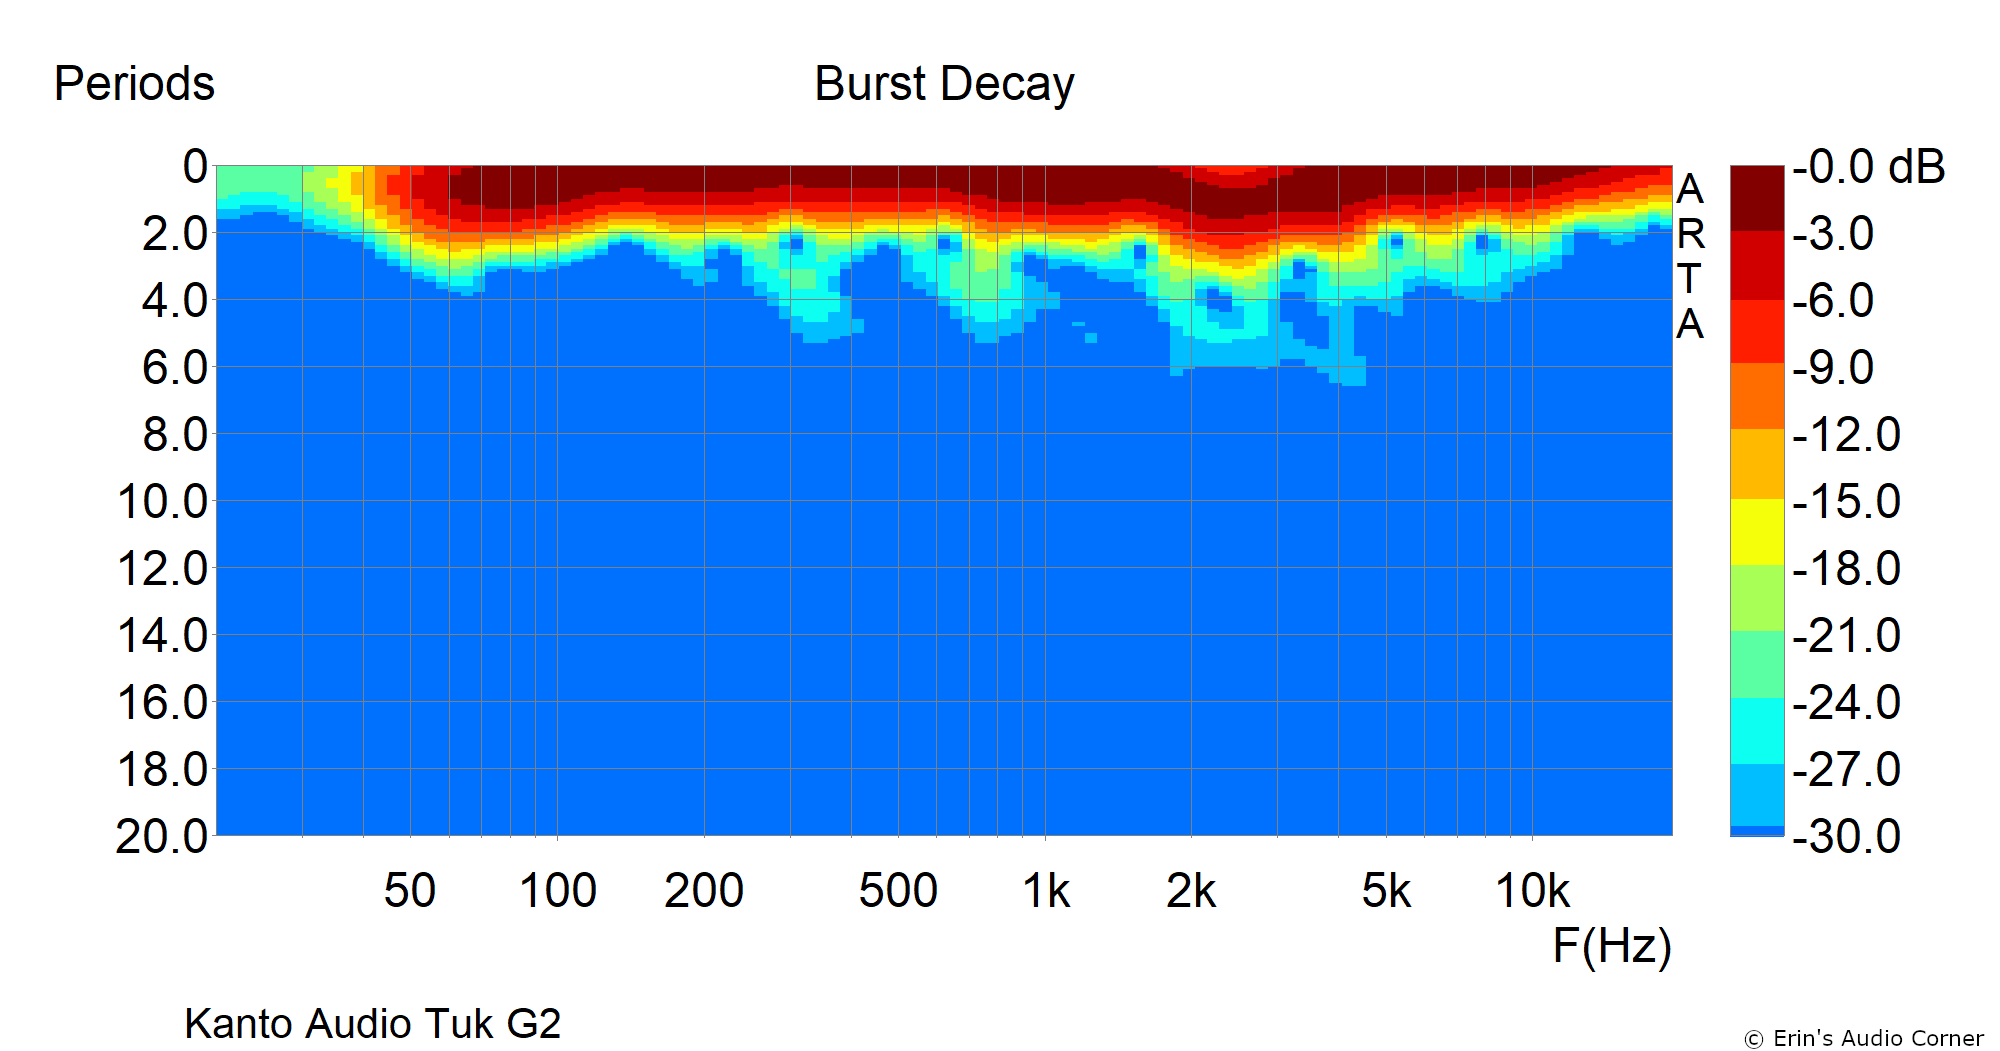
Burst Decay
This data is full anechoic where most spectral decay type graphics are created using quasi-anechoic data. For more information on the differences between Burst Decay and Cumulative Spectral Decay (CSD) graphics please see Section 6.5 of the ARTA User Manual linked below. I would like to extend a professional "thank you" to Ivo Mateljan for this software.
Harmonic Distortion
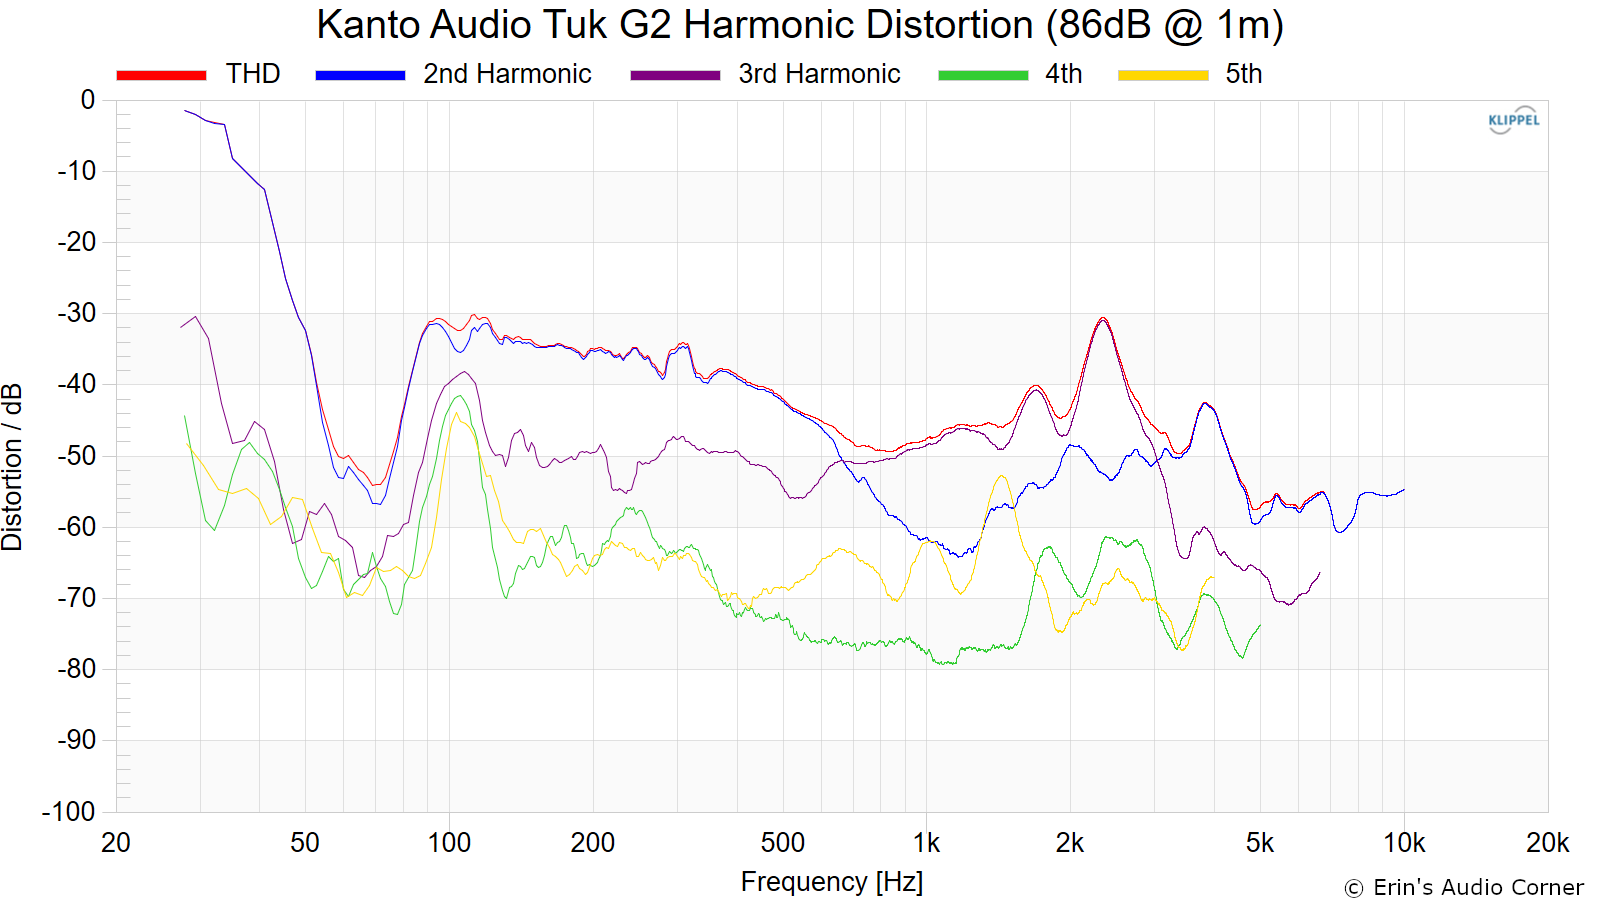
Harmonic Distortion at 86dB @ 1m:
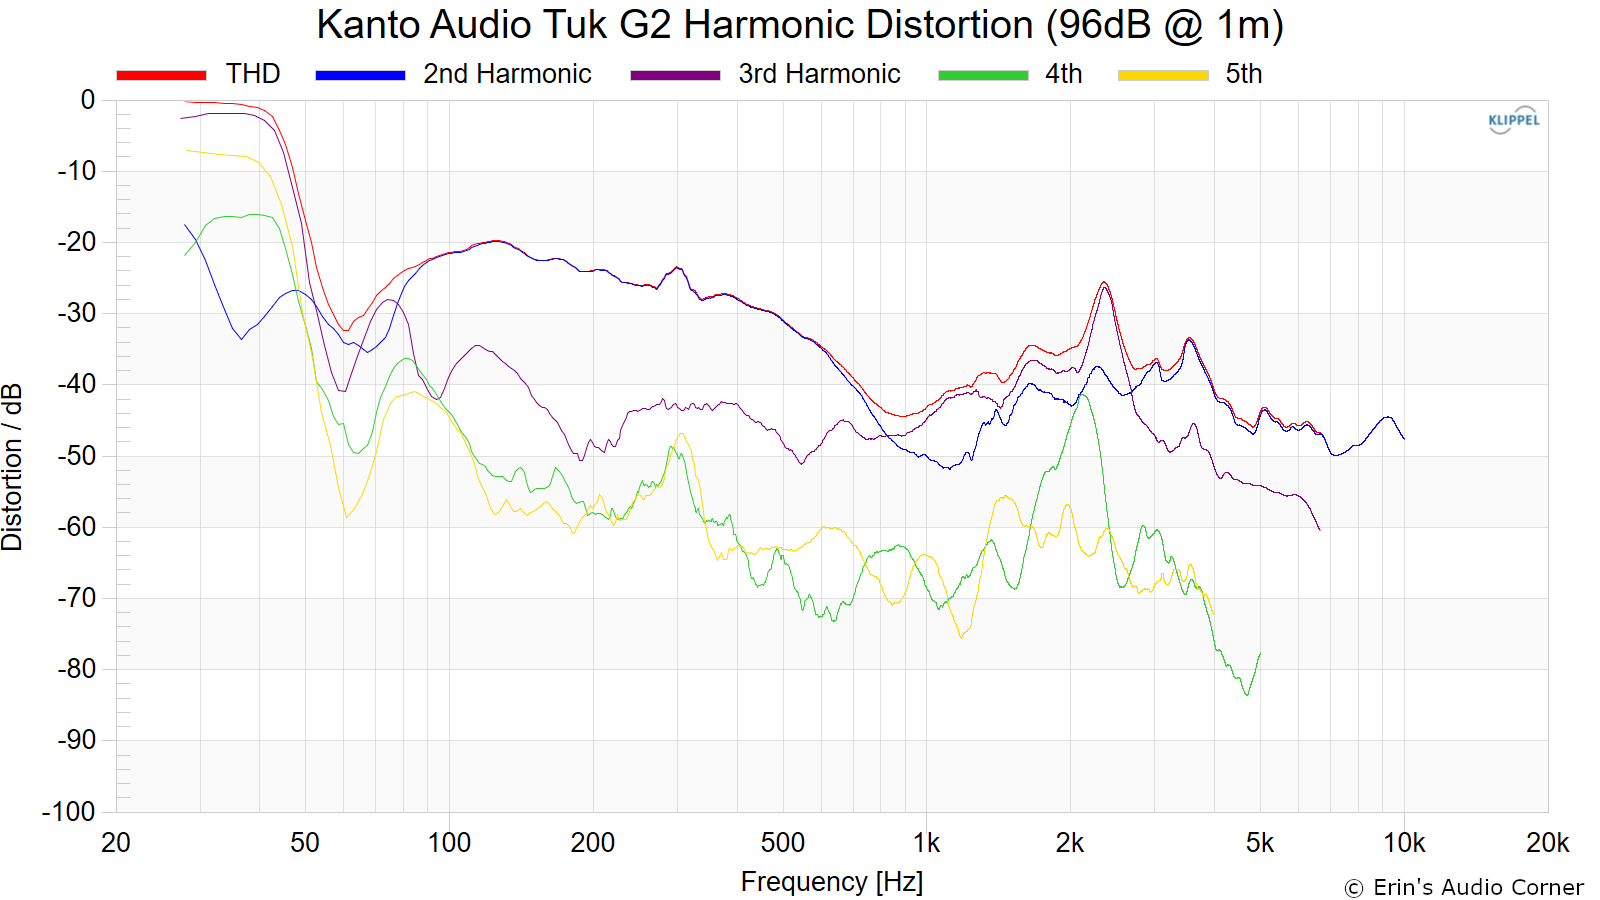
Harmonic Distortion at 96dB @ 1m:
Dynamic Range (Instantaneous Compression Test)
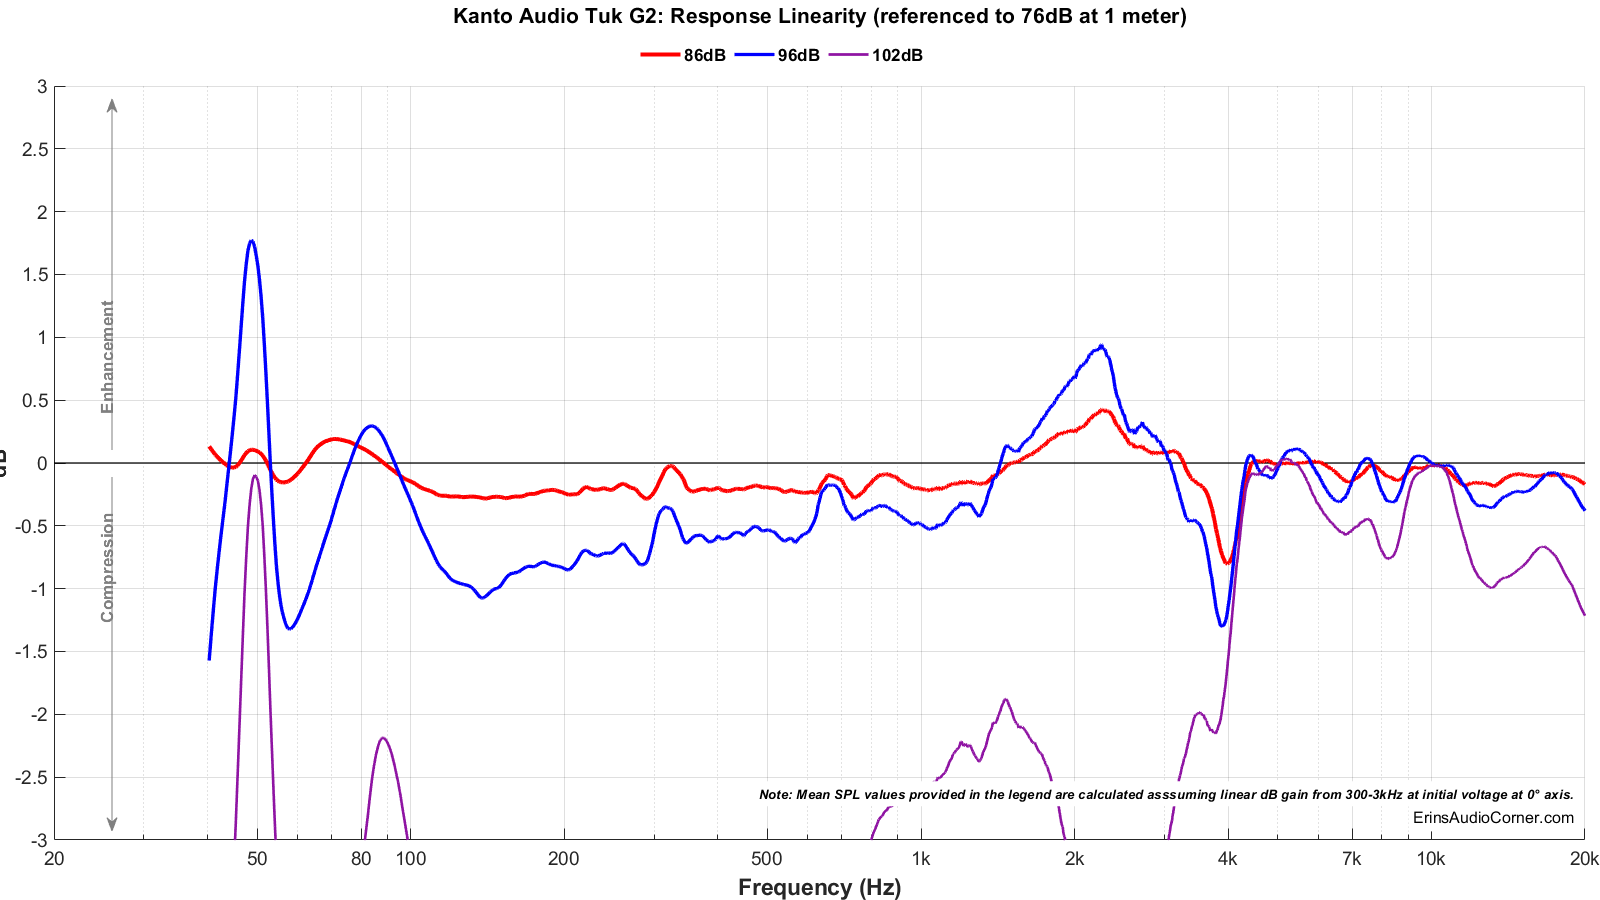
The below graphic indicates just how much SPL is lost (compression) or gained (enhancement; usually due to distortion) when the speaker is played at higher output volumes instantly via a 2.7 second logarithmic sine sweep referenced to 76dB at 1 meter. The signals are played consecutively without any additional stimulus applied. Then normalized against the 76dB result.
The tests are conducted in this fashion:
- 76dB at 1 meter (baseline; black)
- 86dB at 1 meter (red)
- 96dB at 1 meter (blue)
- 102dB at 1 meter (purple)
The purpose of this test is to illustrate how much (if at all) the output changes as a speaker’s components temperature increases (i.e., voice coils, crossover components) instantaneously.
Multitone Distortion
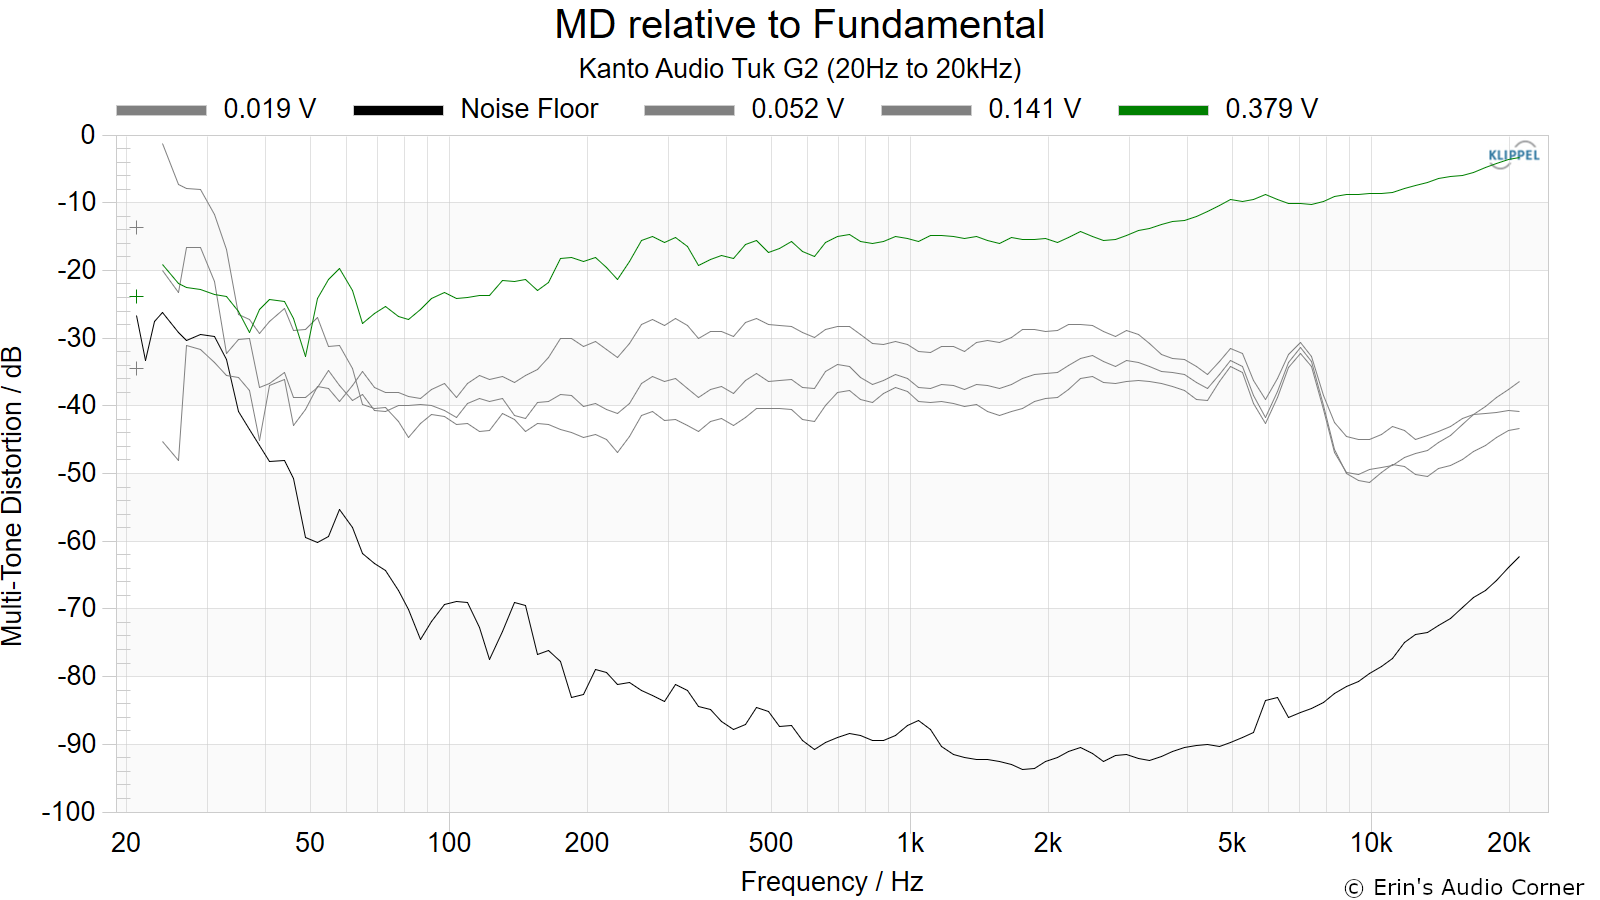
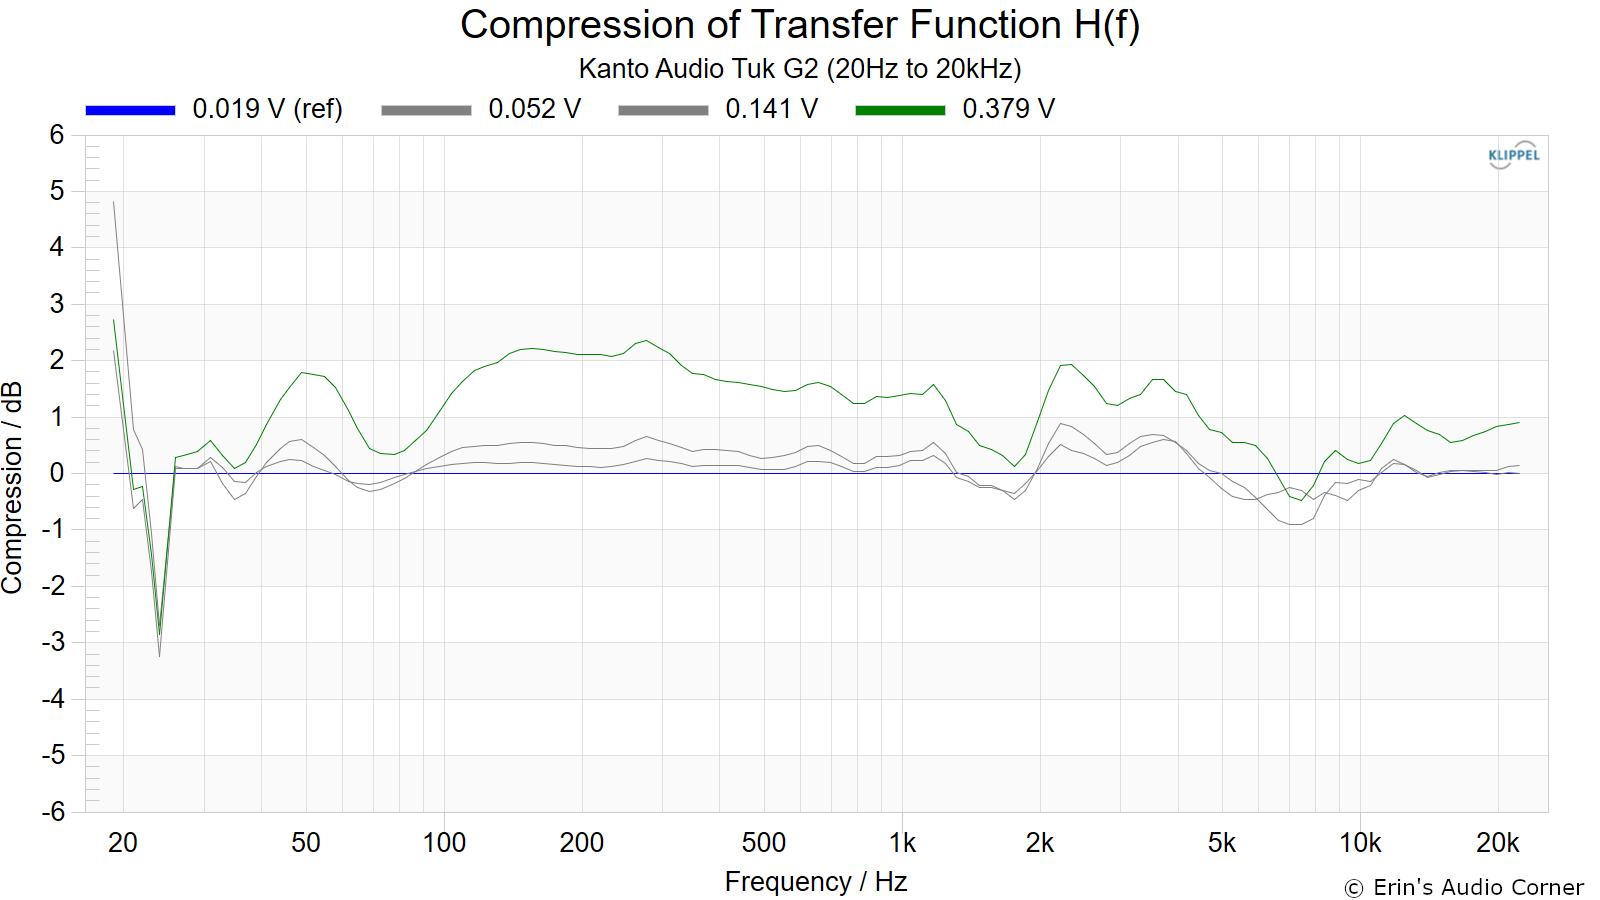
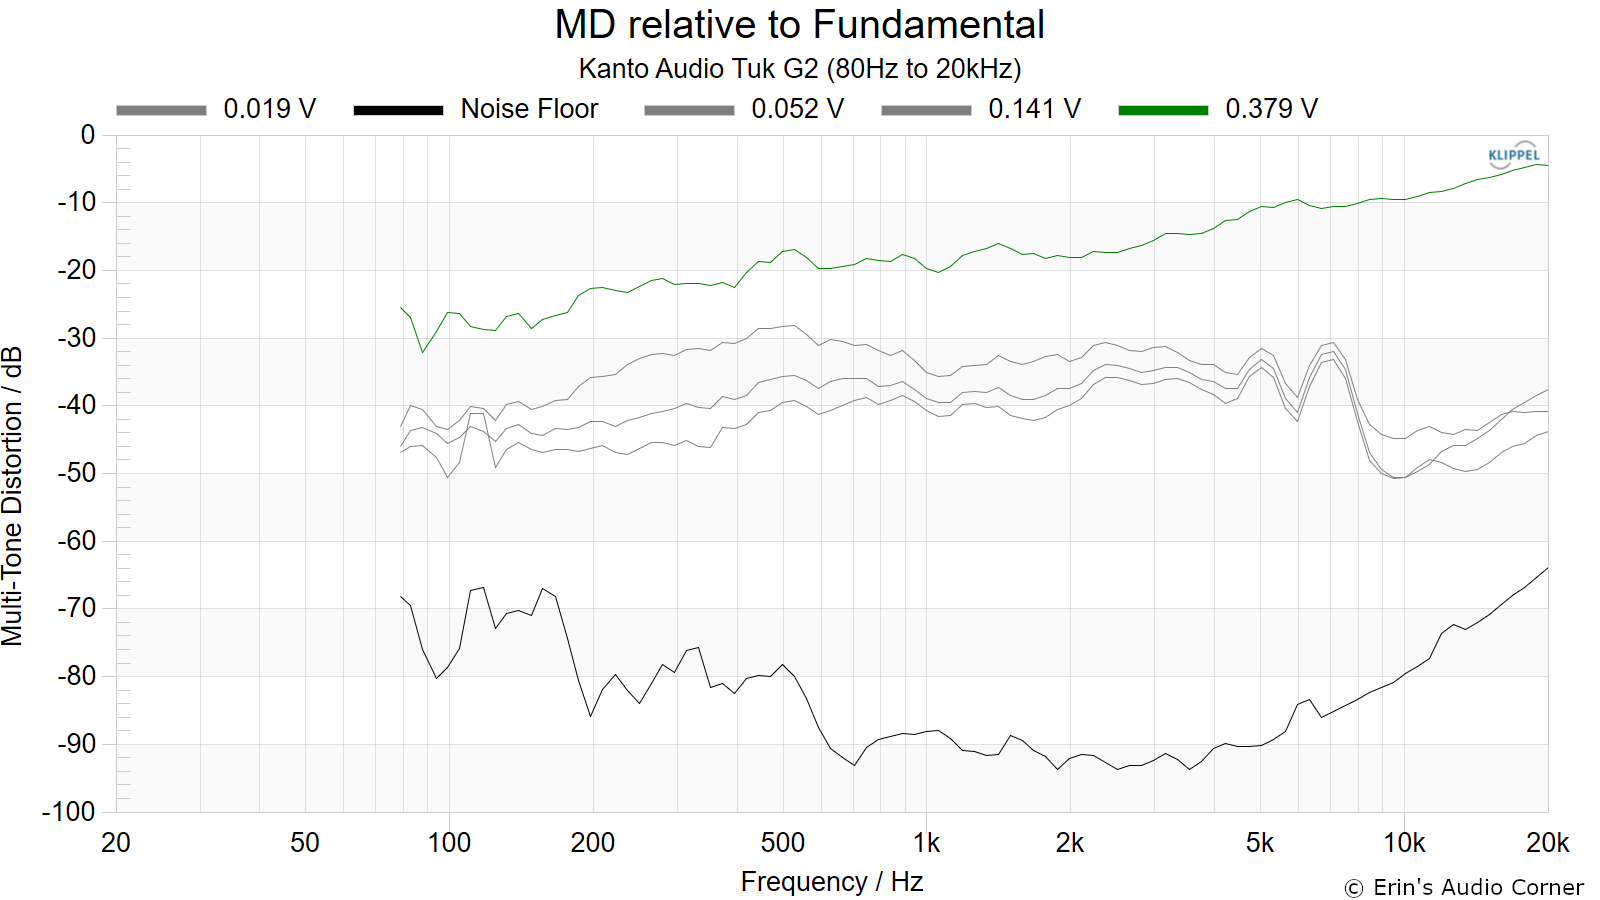
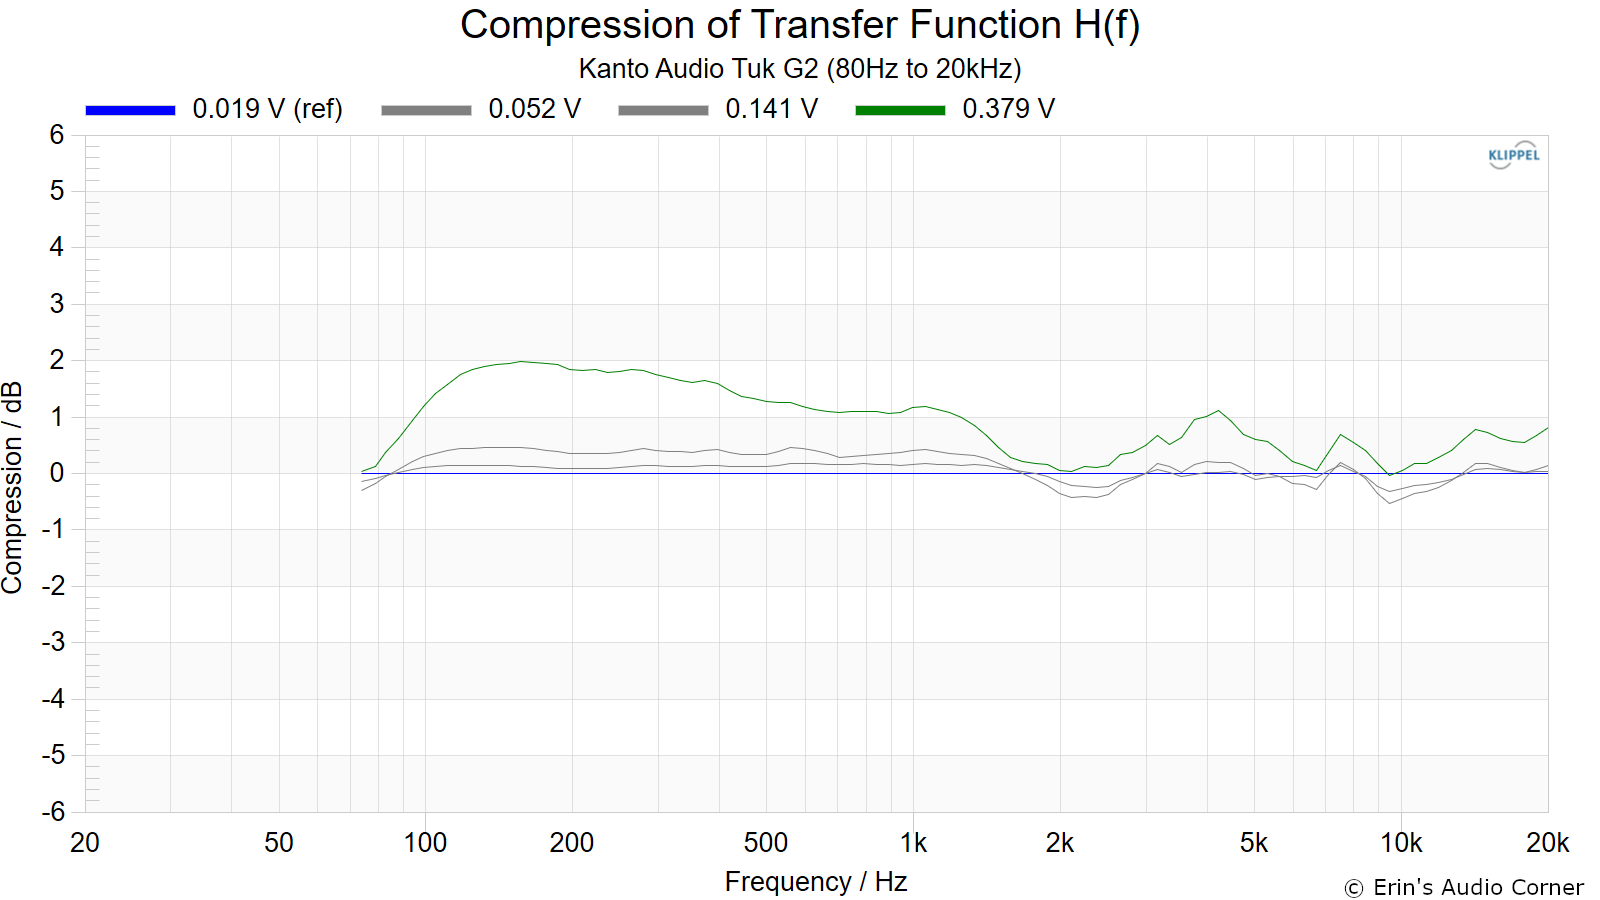
The following tests are conducted at (4) approximate equivalent output volumes: 70/79/87/96dB @ 1 meter. The (4) voltages listed in the legend result in these SPL values. This test signal is dense, similar to pink noise and excites the entire spectrums listed below at the same time. The test signal lasts 30 seconds. This is different than the sine wave test signal used to measure frequency response. The purpose of this distortion and compression test is to illustrate how much (if at all) the output changes as a speaker’s components temperature increases (i.e., voice coils, crossover components) over time.
Given the test signal is similar to pink noise and exciting the entire spectrum at the same time I also include compression results, which is captured at the same time distortion is captured. Sometimes these results differ from the compression results you see above (namely with powered designs incorporating DSP-based limiting).
Note: The KLIPPEL software shows compression in the positive scale.
The test was conducted in (3) manners:
- Full bandwidth (20Hz to 20kHz)
- 80Hz to 20kHz
The reason for the two measurements is to simulate running the speaker full range vs using a high-pass filter at 80Hz. However, note: the 2nd test low frequency limit at 80Hz is a “brick wall” and doesn’t quite emulate a standard filter of 12 or 24dB/octave. But… it’s close enough to illustrate the point.
- Full bandwidth (20Hz to 20kHz)
- 80Hz to 20kHz
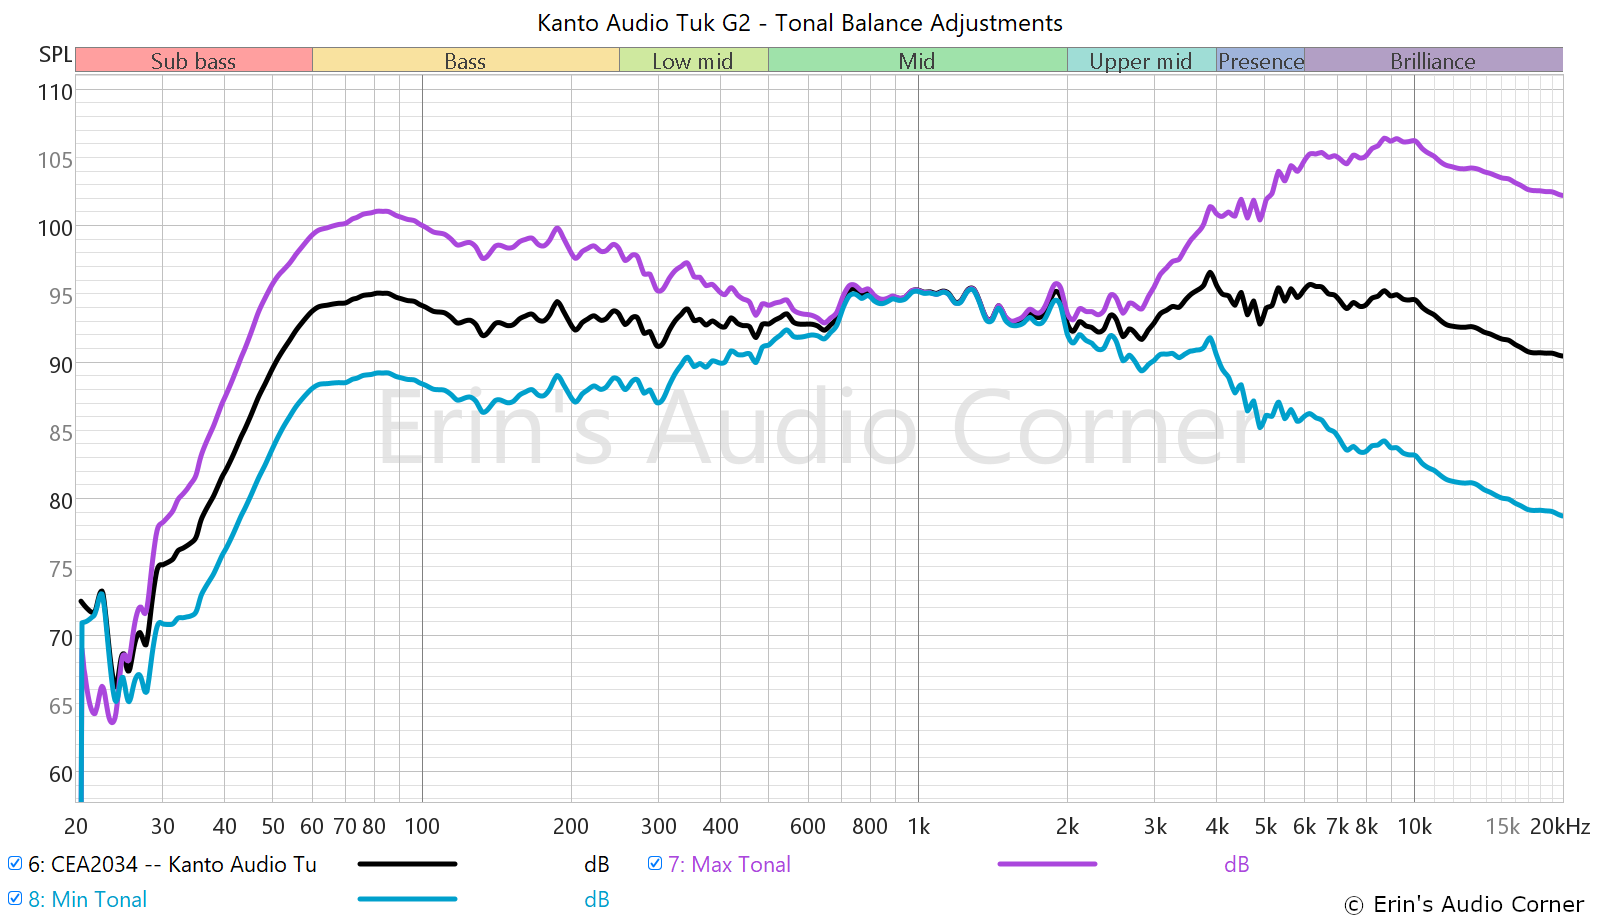
DSP Tonal Adjustment Options
DSP Default = Black
Parting / Random Thoughts
Overall Objective Assessment
The Kanto Audio TUK G2 provides impressive bass extension for a compact powered desktop speaker, but the measurements reveal several meaningful compromises. Its approximately 52 Hz F3 provides legitimate low-frequency extension for its size, but the frequency response is rather uneven. There is elevated upper-bass energy around 80–100 Hz, a relatively forward midrange centered roughly around 800 Hz–1.5 kHz, and additional variations through the upper midrange and treble. Directivity is also imperfect. The horizontal radiation pattern noticeably broadens beginning around 2–2.5 kHz before eventually narrowing at higher frequencies, so the off-axis response does not transition as smoothly as it would with a more consistently controlled radiation pattern. Vertical placement deserves additional attention because the useful vertical listening window becomes relatively narrow through the midrange and treble.
Dynamic performance is good at moderate levels but becomes another significant limitation when the speaker is pushed hard. The 86 dB test condition shows relatively little compression, while 96 dB introduces considerably more level-dependent behavior. At the nominal 102 dB condition, broad portions of the response are substantially compressed. The multitone measurements also show nonlinear distortion increasing substantially with playback level, becoming very high across broad portions of the spectrum at the highest test level. Subjectively, I would expect this combination of compression and distortion to make the speaker sound progressively congested and grainy as it approaches its output limits. Complex musical passages may lose clarity and separation, while the increasing nonlinear energy through the upper-midrange and treble could contribute to a sense of hardness or harshness at very high playback levels. In other words, when pushed beyond its comfortable operating range, the TUK G2 is likely to sound not only dynamically compressed, but also progressively less clean and more strained.
These output limitations are much more consequential if the TUK G2 is used as a conventional room speaker at a listening distance of 2–3 meters than when it is used as its intended desktop/nearfield speaker. At typical nearfield distances, substantially less output is required from each speaker, and both the compression and multitone measurements indicate considerably better behavior at those more moderate levels.
Taken as a whole, the TUK G2 offers strong bass extension and useful output for its size, but its uneven frequency response, forward midrange, changing horizontal beamwidth, and deteriorating linearity at high output keep the measured performance from being considered particularly neutral or technically well controlled. For desktop and nearfield listening at moderate levels, its output limitations should be considerably less significant. However, listeners attempting to achieve high playback levels or use the TUK G2 at conventional room listening distances should expect its sound quality to deteriorate as the speaker approaches its limits, with increasing compression, congestion, graininess, and potentially some upper-frequency hardness.
Support / Contribute
I do not take adspace nor do manufacturers pay me for reviews. All revenue is through YouTube ad-revenue or directly from contributions from viewers such as yourself. While this is not my full-time job it’s cool when I’m able to make a few bucks for my efforts.
If you’d like to support the channel I have listed a few ways below. Thank you!
Patreon:
Want to be more involved? On Patreon you can vote in polls, see behind-the-scenes stuff, read about the occasional manufacturer drama (fun, right?), and help shape what I do next.
👉 https://www.patreon.com/erinsaudiocorner
Donate Via PayPal:
If you would like to contribute directly via PayPal that would be appreciated!
👉 https://www.paypal.com/donate?hosted_button_id=CLHSW4L9SBSLY
Generic Affiliate Links:
Anytime you’re buying something online — whether it’s speakers, TVs, or just everyday stuff — you can use the clickable links below. I get a small commission (at no extra cost to you), and it adds up more than you’d think.
Amazon
Crutchfield
Audio Advice
AsciLab Speakers
Arendal Sound
Best Buy
AliExpress
Wal-Mart
Parts-Express
Newegg
Samsung
Target
Thomann
Emotiva
Monoprice