Foreword / YouTube Video Review
The review on this website is a brief overview and summary of the objective performance of this speaker. It is not intended to be a deep dive. Moreso, this is information for those who prefer “just the facts” and prefer to have the data without the filler.
However, for those who want more - a detailed explanation of the objective performance, and my subjective evaluation (what I heard, what I liked, etc.) - please watch the below video where I go more in-depth.
Information and Photos
Note: Kali Audio loaned me this speaker to test. I was not paid for this review nor has Kali seen this review before publication.
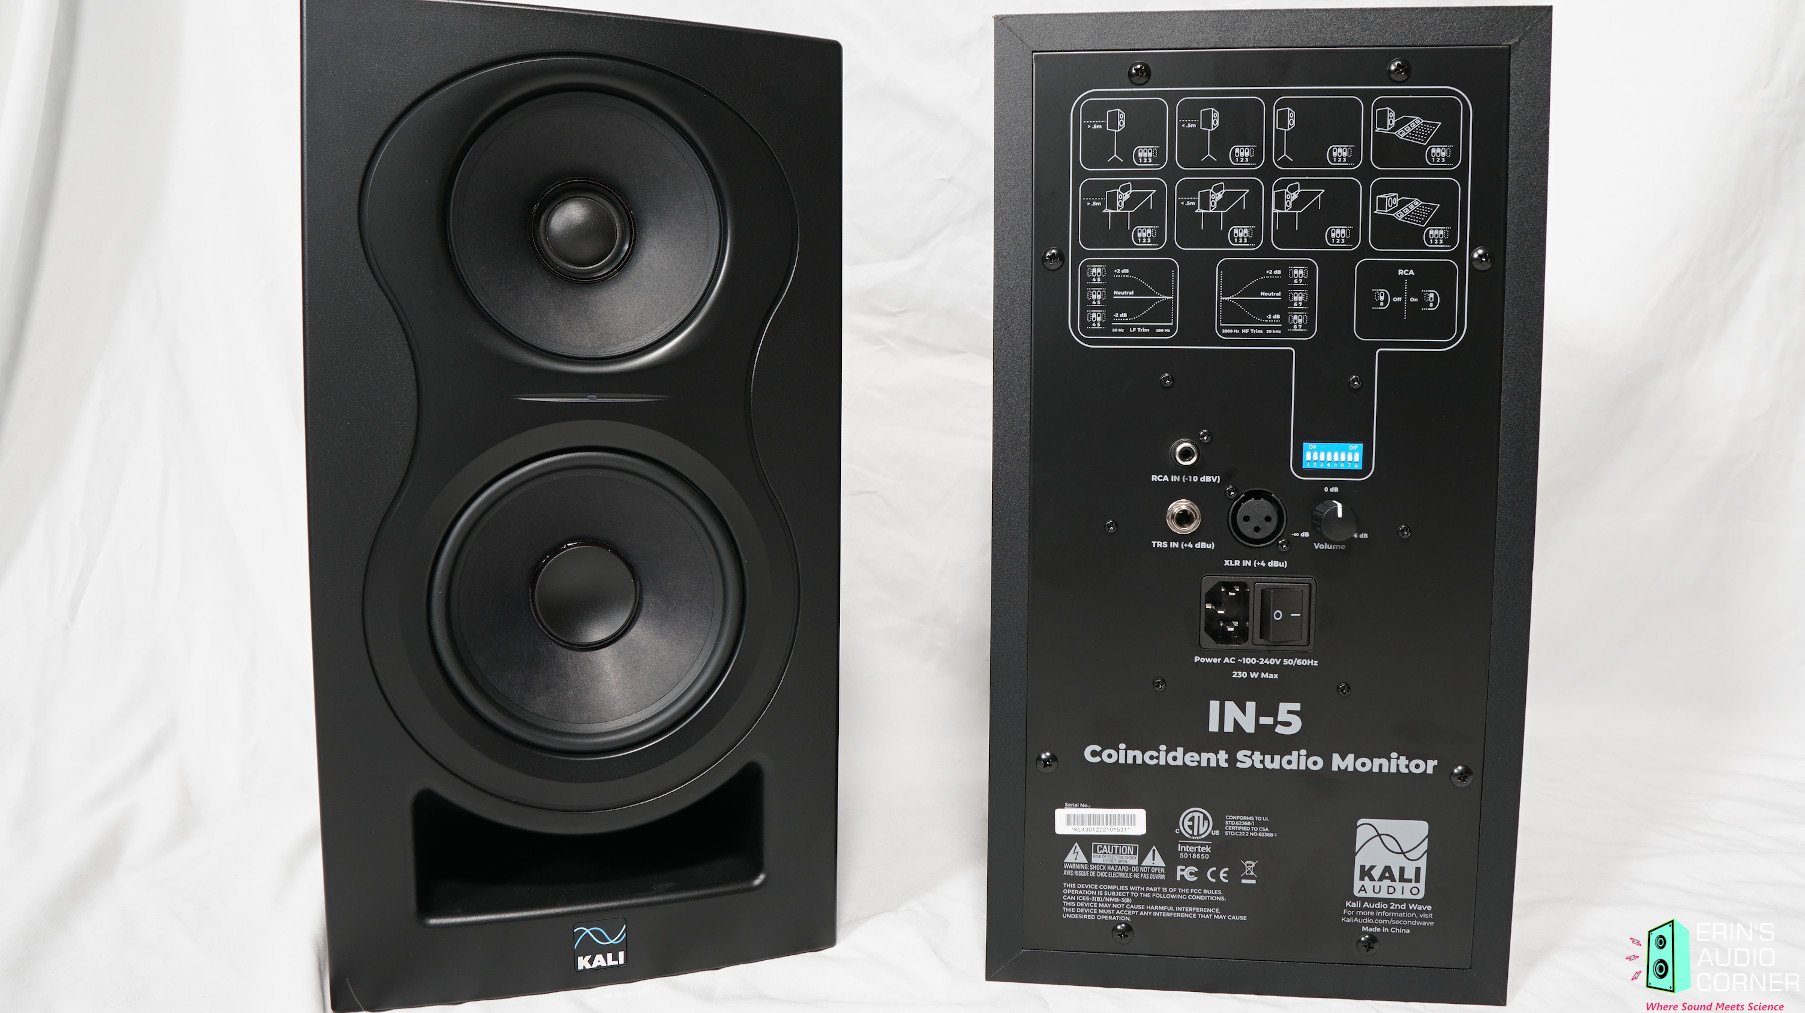
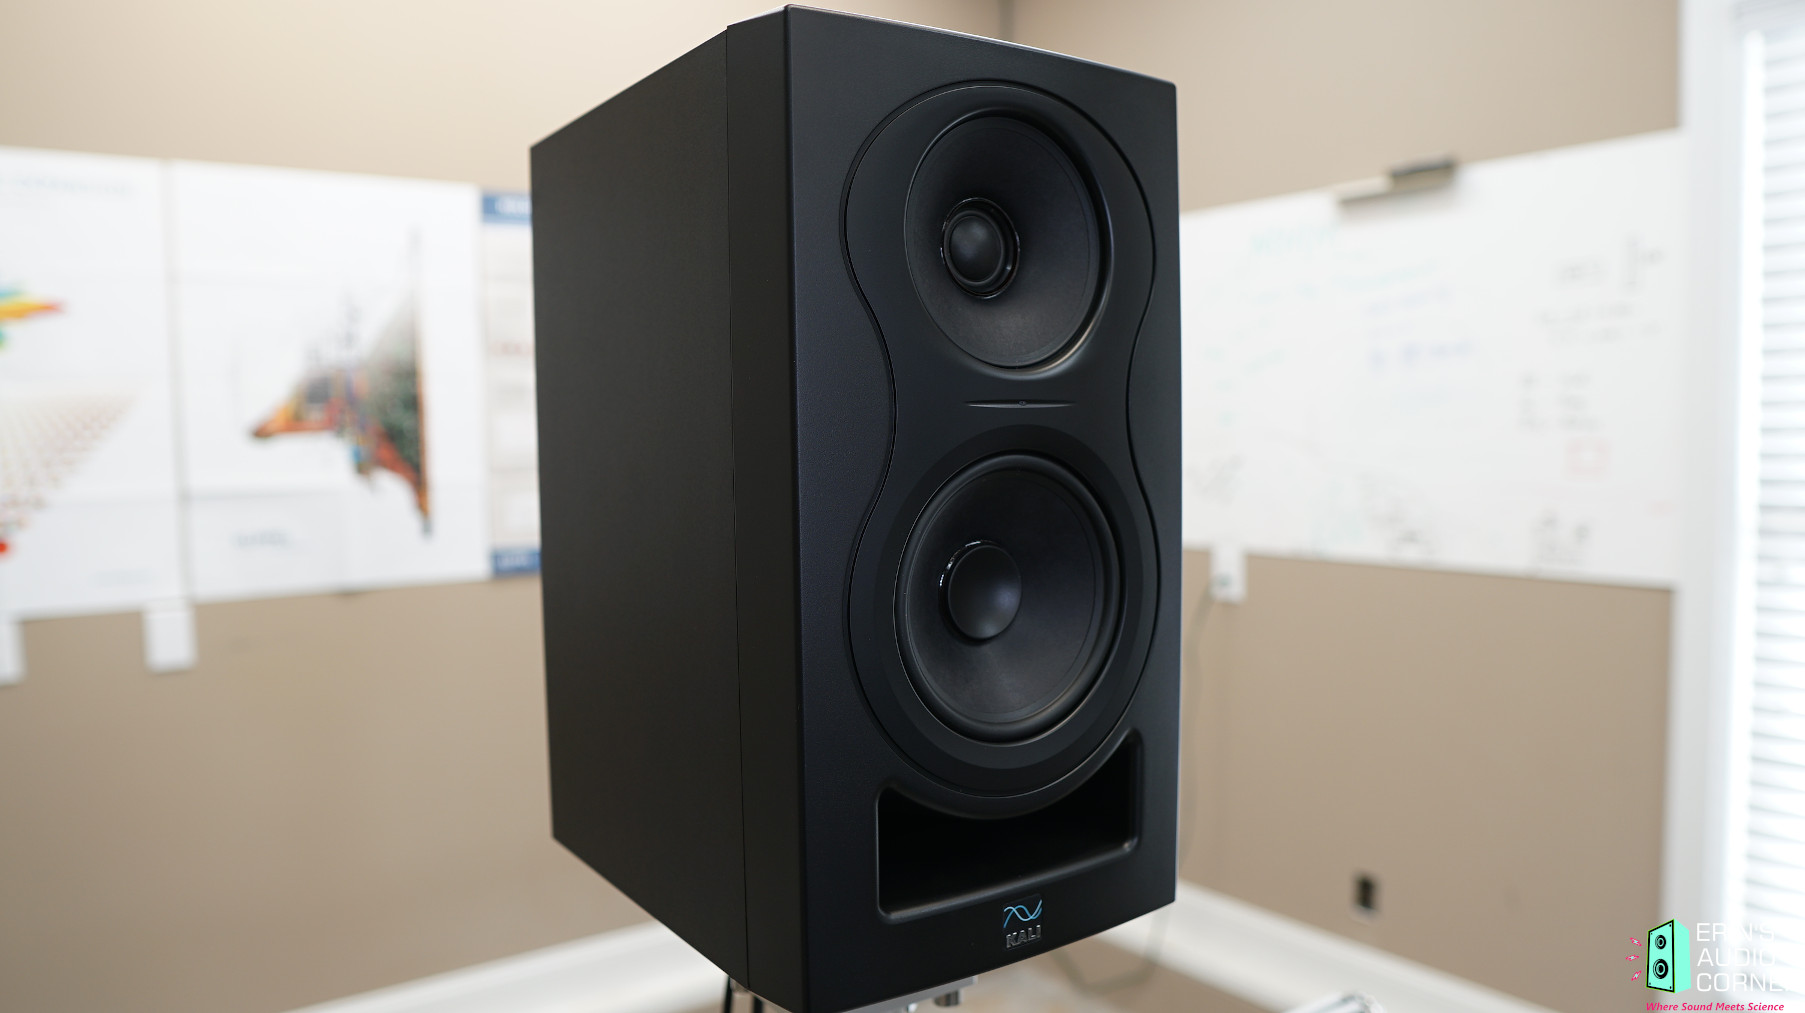
The Kali IN-5 is a powered 3-way Studio Monitor featuring a 4-inch coaxial midrange/tweeter and a 5-inch midwoofer. The below is from the manufacturer’s website:
The IN-Series monitors are unlike anything you’ve ever heard. The three-way design lets both the woofer and the tweeter do less work, resulting in better headroom and lower distortion across the frequency spectrum. At the same time, the coaxial architecture of the midrange and tweeter result in hyper-realistic imaging. This means that you’ll be able to hear subtle details in your mix with pinpoint precision. The design of the system comes together to allow the IN-Series monitors to act as acoustic point sources. They enjoy all the benefits of both traditional 3-way systems and traditional coaxial speakers, with none of the drawbacks traditionally associated with either. All of this make the IN-5 and IN-8 extremely accurate and easy to mix on. You’ll be able to work faster and with more confidence, and your mixes are going to translate to other systems with less work.
MSRP for the single speaker is approximately $350 USD and $700 USD for a pair.
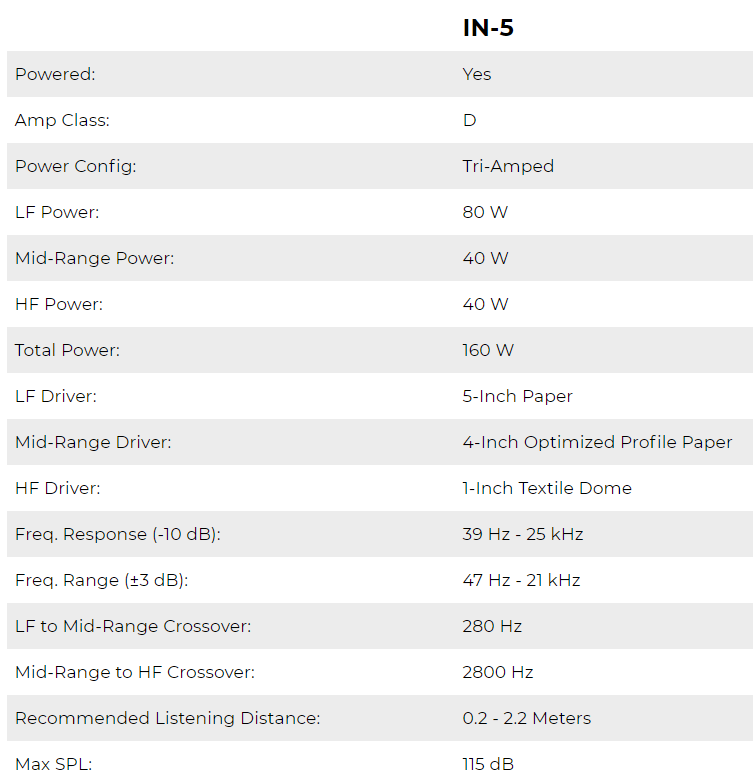
And here are some specs, again from the manufacturer’s website:
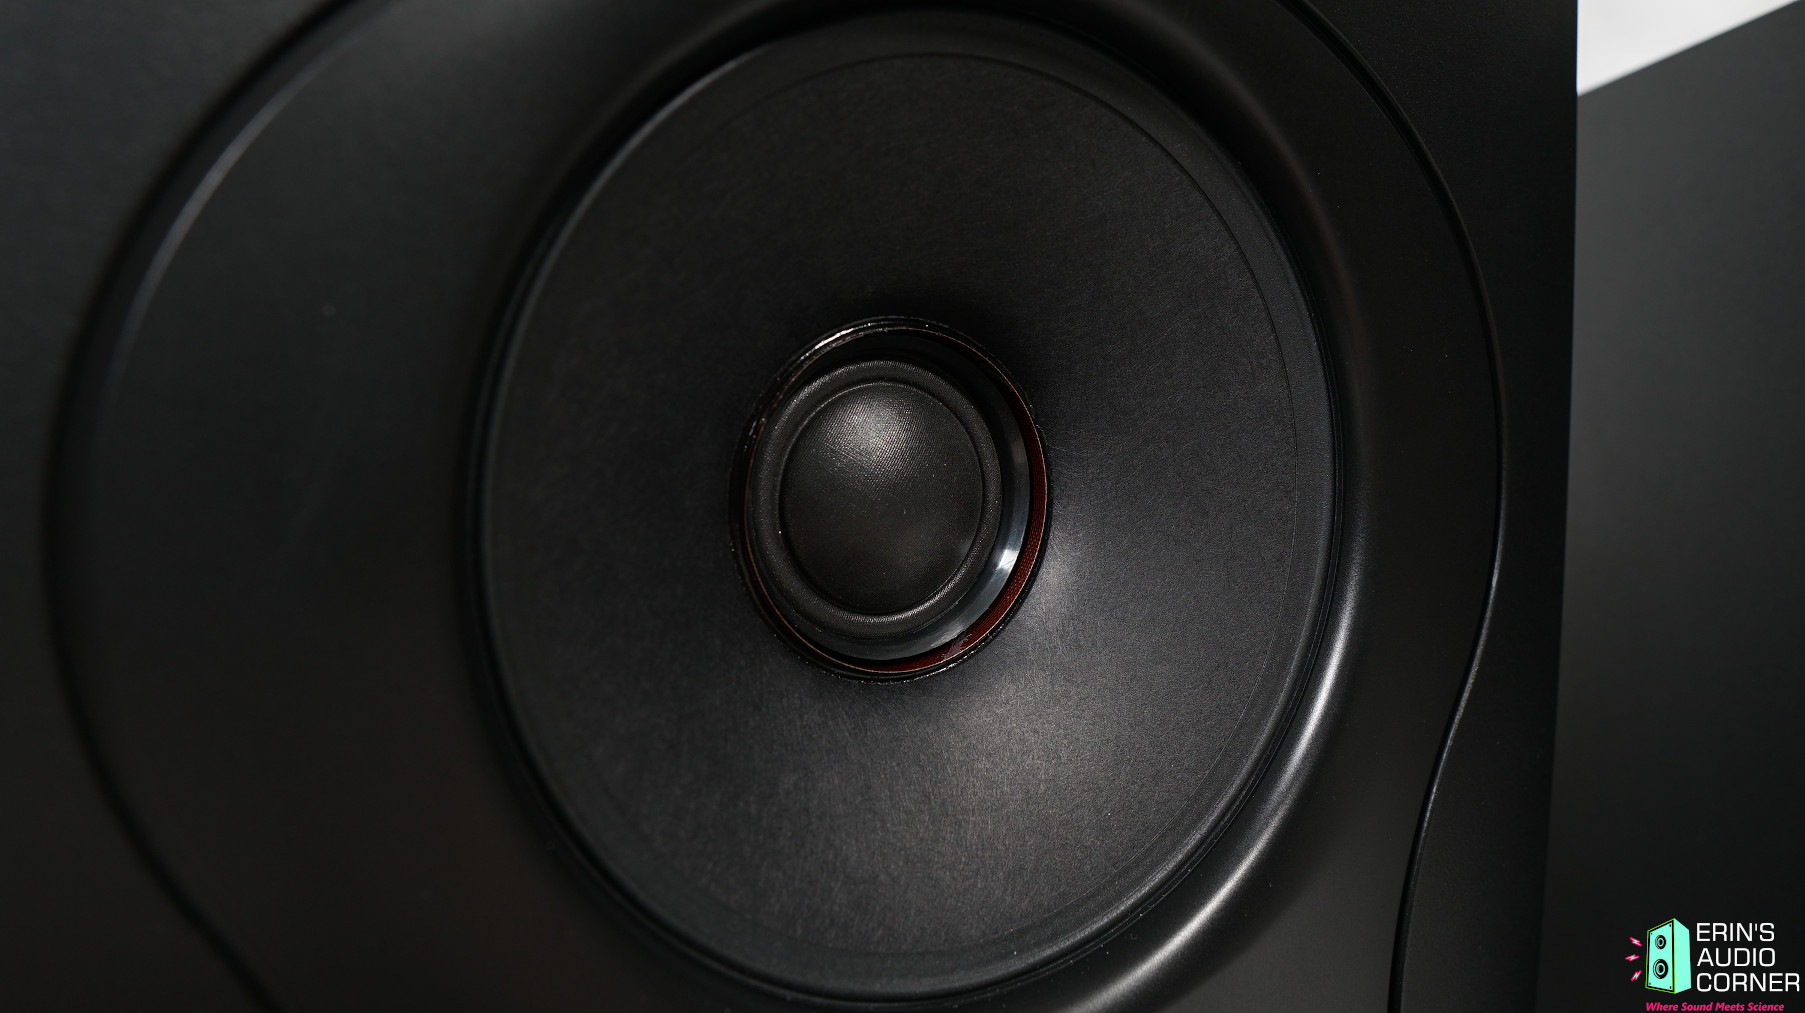
With a coaxial (or concentric) drive unit such as the one used in this speaker, the tweeter should be terminated in a way that it meets the midrange cone very smoothly. The reason for this is because the midrange is the waveguide for the tweeter. Any discontinuity between the tweeter edge and the inner edge of the midrange creates diffraction. As you can see in the below photo, the voice coil (or so it appears) protrudes beyond the midrange cone and beyond the tweeter’s crossing point with the midrange center. I measured this to be about 1 mm. The audible detriment due to this is something I can’t speak on. I can just say it is not “ideal” to have such a discontinuity. It would take having the ideal profile/termination design measured and listening tests conducted. The distance from the center of the tweeter to this edge is about 20mm which puts the first reflection at around 8kHz, which also coincides with the on-axis response dip. This could be coincidence (no pun intended). I don’t want to harp on this too much but I do think this is worth noting.
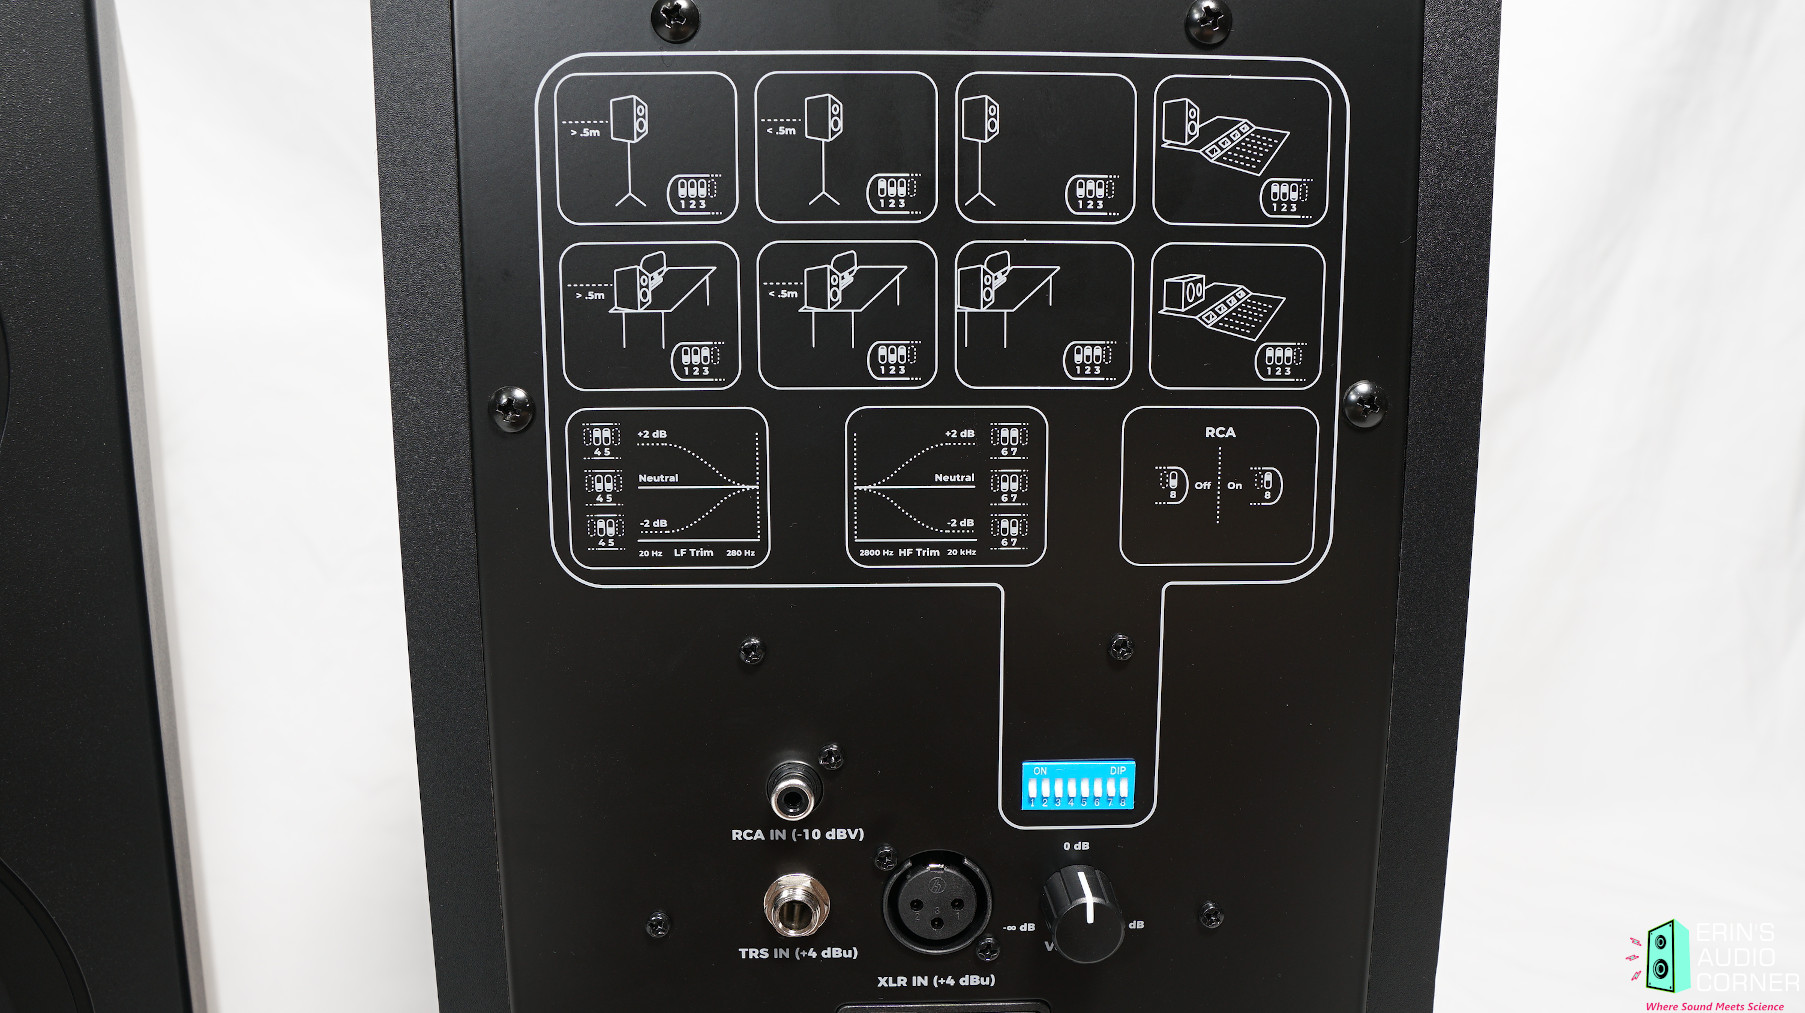
The back features a bank of dip switches for boundary settings (discussed later) and basic level adjustments. There is a volume knob and (3) input options: XLR, TRS and RCA phono.
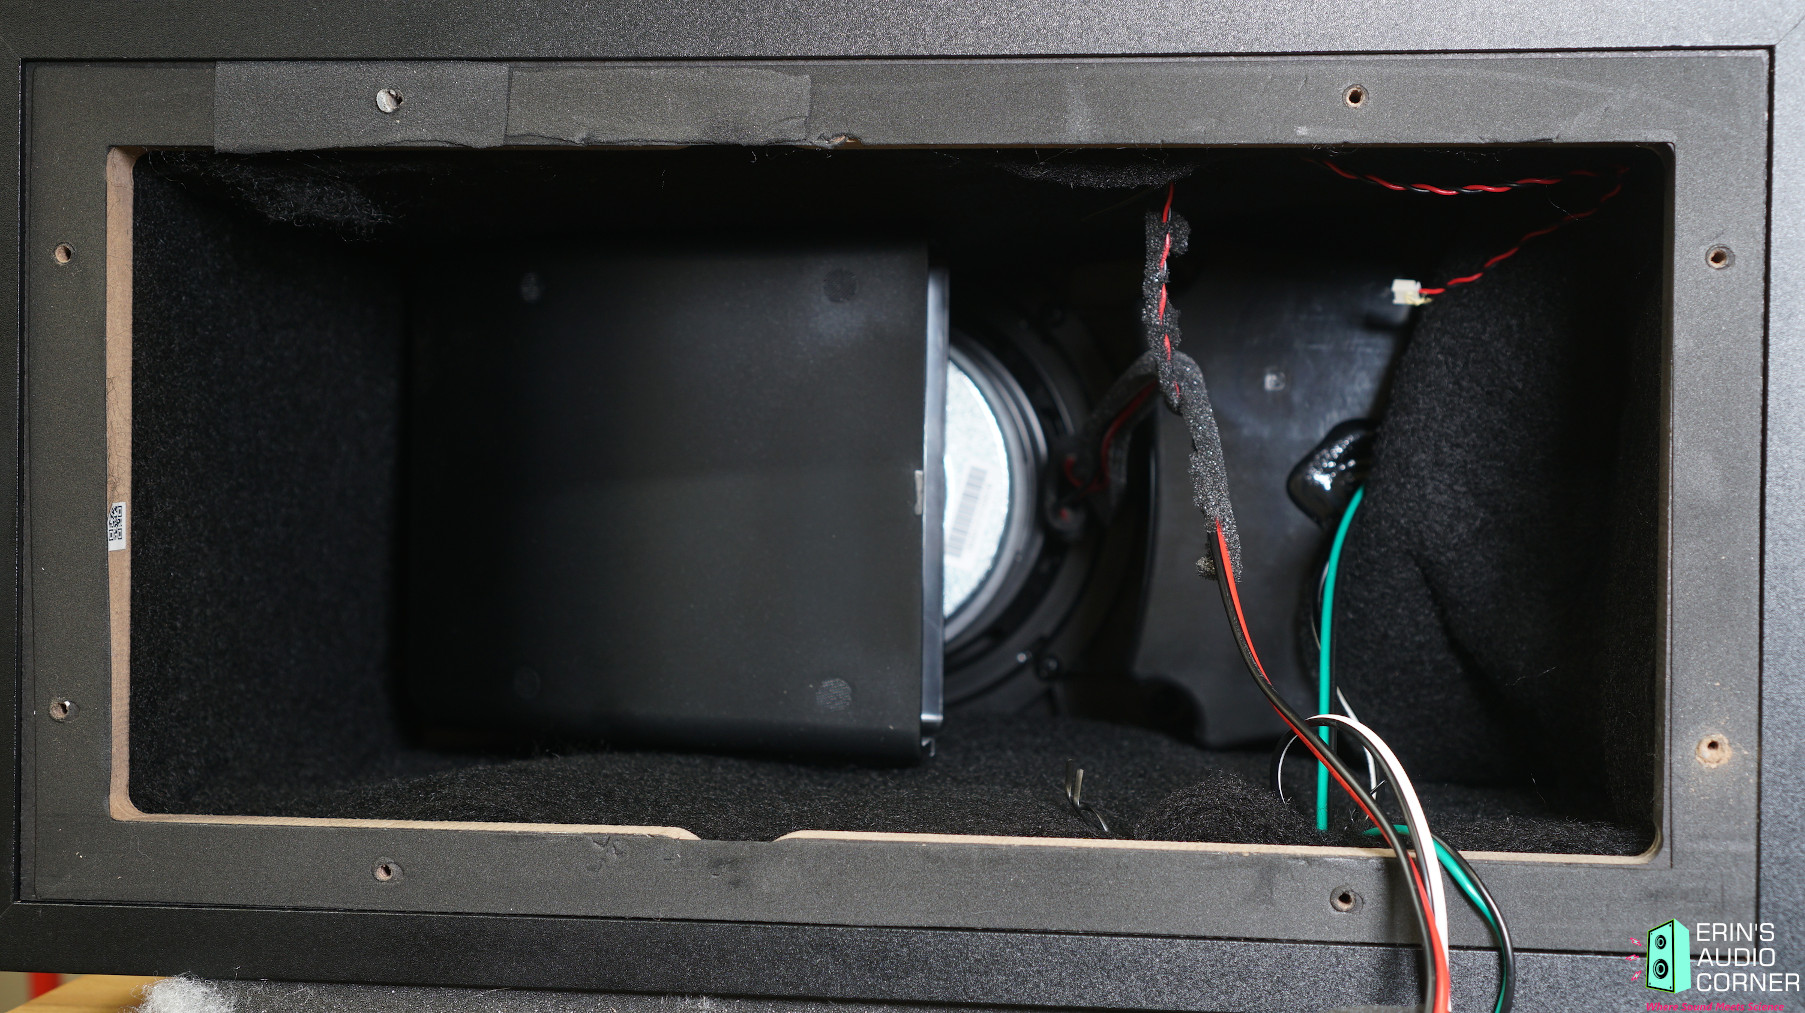
This is the inside of the speaker from the back. Note the port is a U-turn port and sits behind the midwoofer (left side). To the right is a plastic enclosure which houses the midrange. There is a copious amount of foam padding throughout the enclosure to dampen the enclosure and foam on the wires where they intersect to tame any noise from vibration against each other and the cabinet. The enclosure’s back is lined with thin damping material as well where the amplifier mounts.
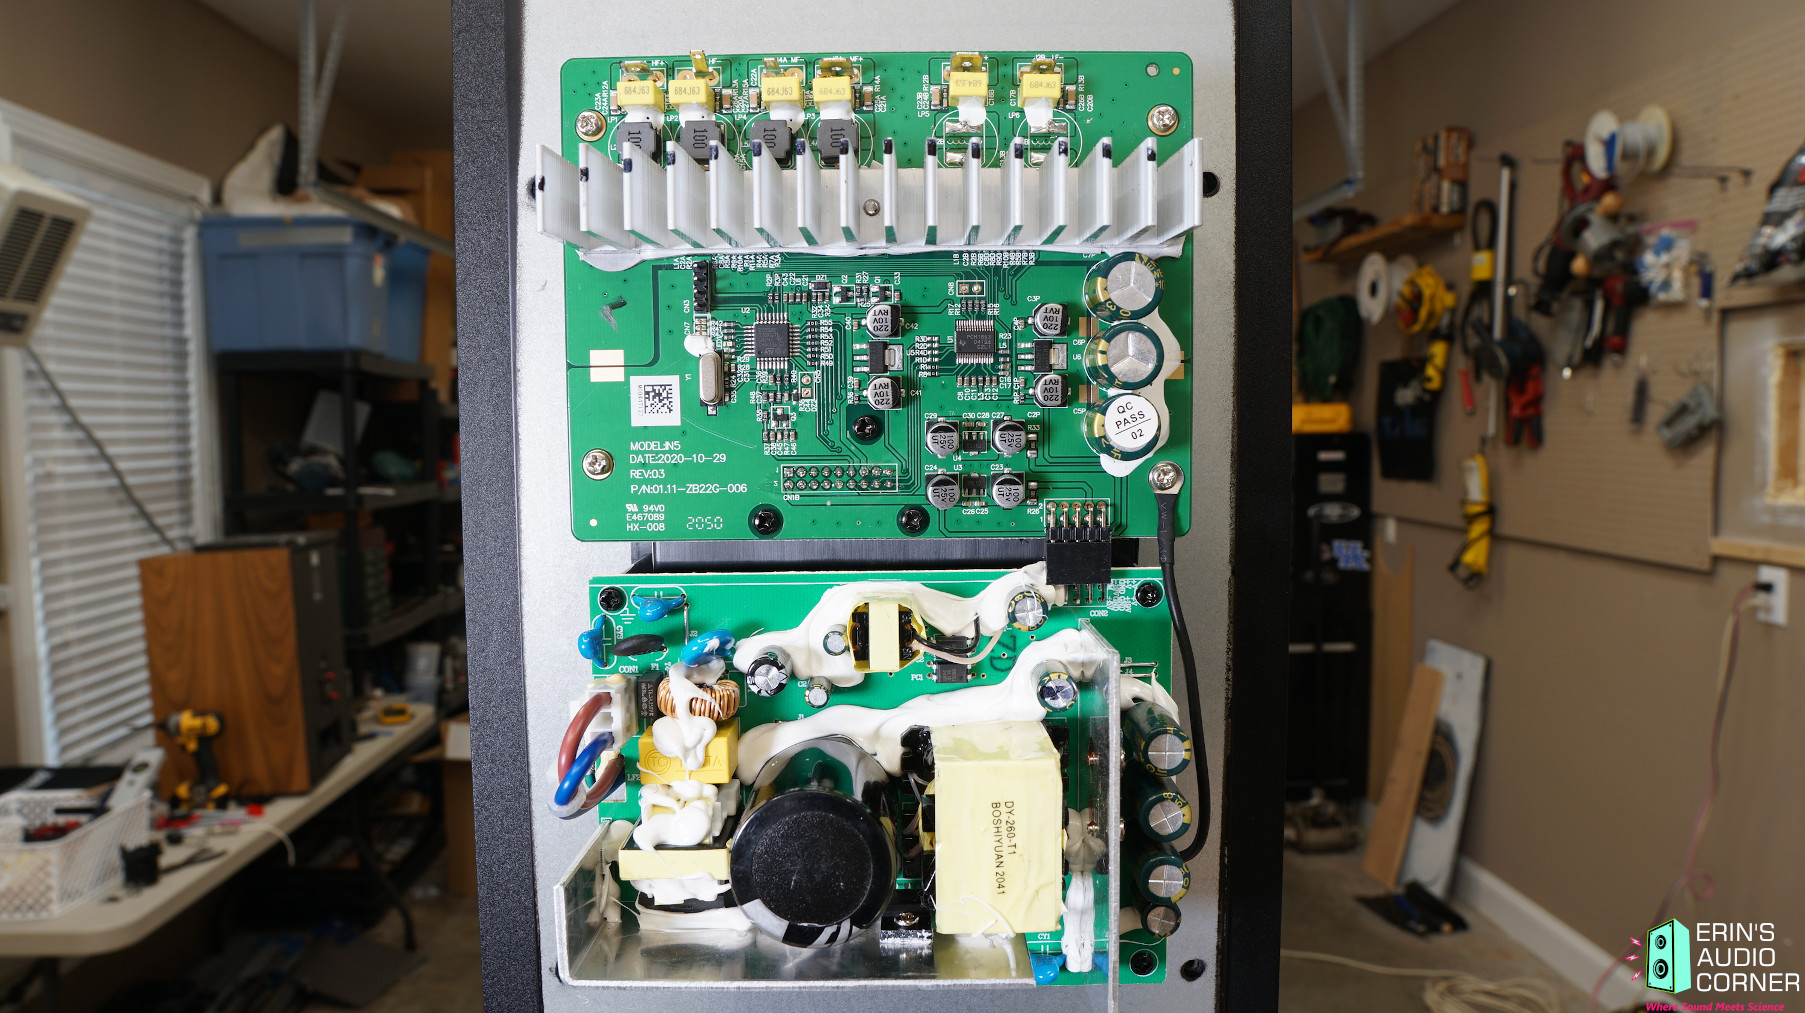
The amplifier for those of you know who know more about this stuff than I do.
CTA-2034 (SPINORAMA) and Accompanying Data
All data collected using Klippel’s Near-Field Scanner. The Near-Field-Scanner 3D (NFS) offers a fully automated acoustic measurement of direct sound radiated from the source under test. The radiated sound is determined in any desired distance and angle in the 3D space outside the scanning surface. Directivity, sound power, SPL response and many more key figures are obtained for any kind of loudspeaker and audio system in near field applications (e.g. studio monitors, mobile devices) as well as far field applications (e.g. professional audio systems). Utilizing a minimum of measurement points, a comprehensive data set is generated containing the loudspeaker’s high resolution, free field sound radiation in the near and far field. For a detailed explanation of how the NFS works and the science behind it, please watch the below discussion with designer Christian Bellmann:
A picture of the setup in my garage:
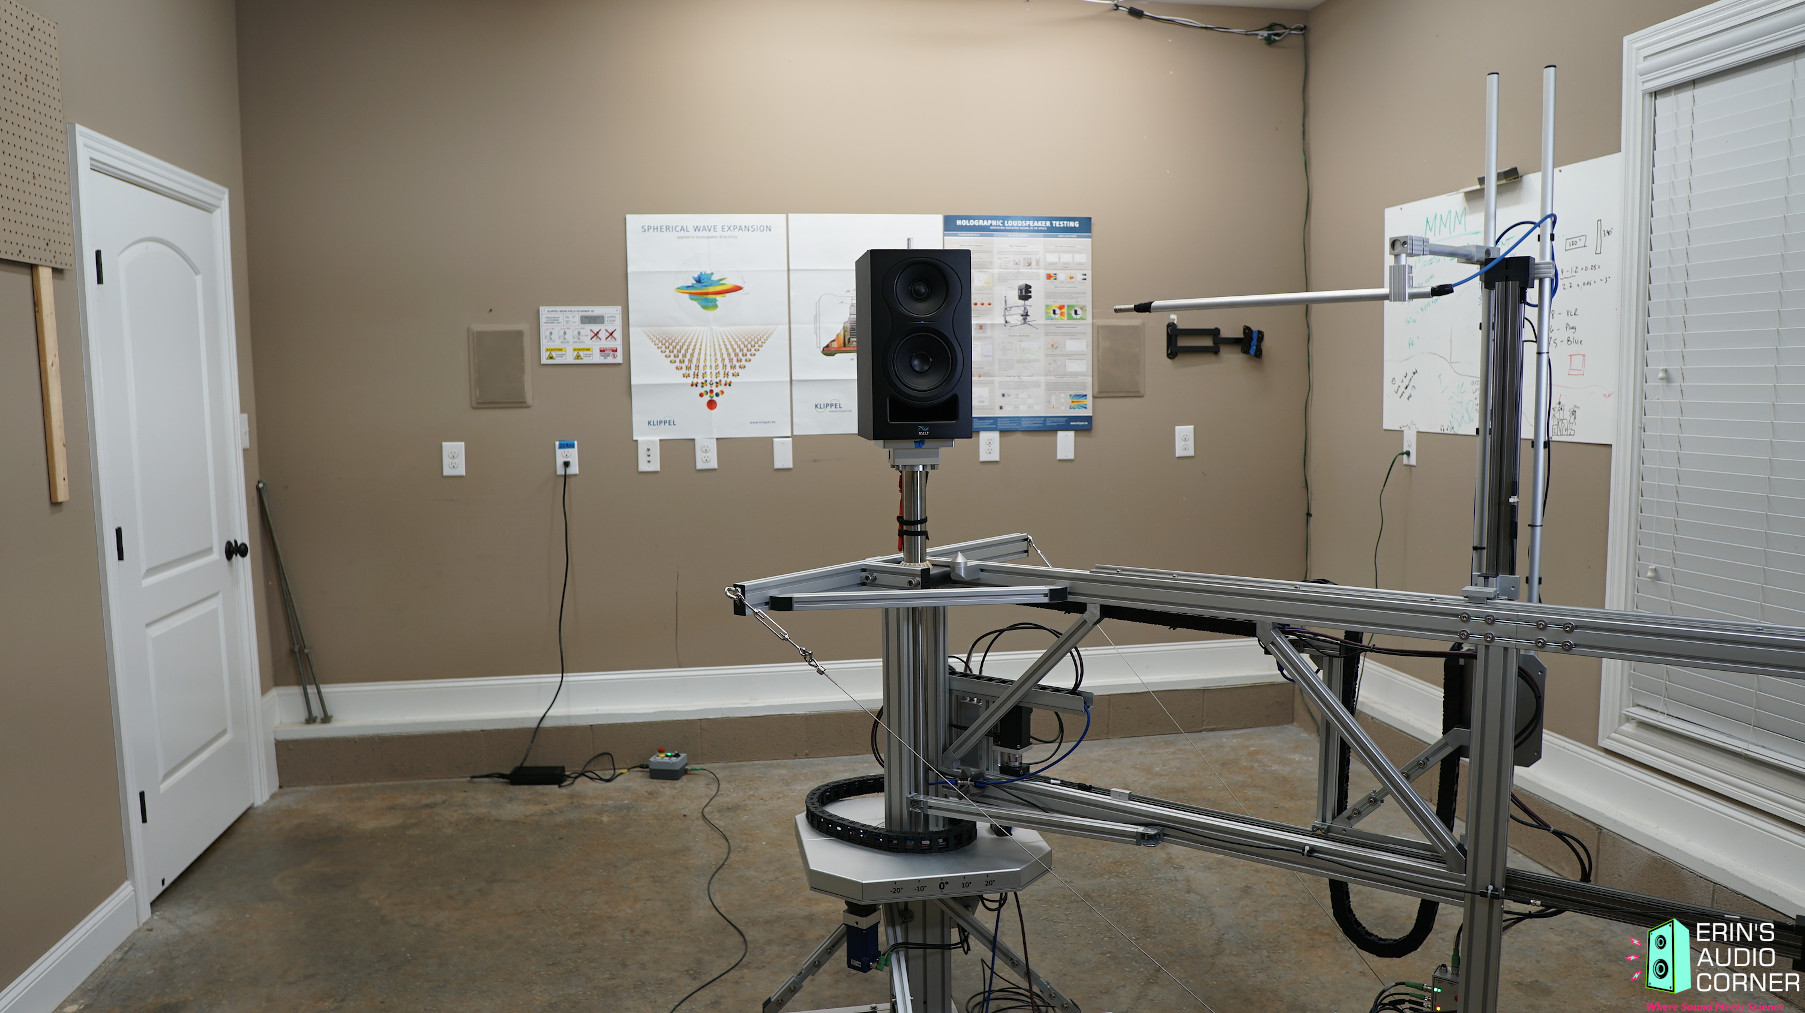
The reference plane in this test is at the tweeter. Volume set to ‘0’ with XLR input. The dip switches were all set to ‘0’ for the freefield setting.
Measurements are provided in a format in accordance with the Standard Method of Measurement for In-Home Loudspeakers (ANSI/CTA-2034-A R-2020). For more information, please see this link.
Note: The roll off rate of this speaker is sharp and therefore some noise was unavoidable at 25Hz which causes a spike in the response here. Ignore the response below 25Hz.
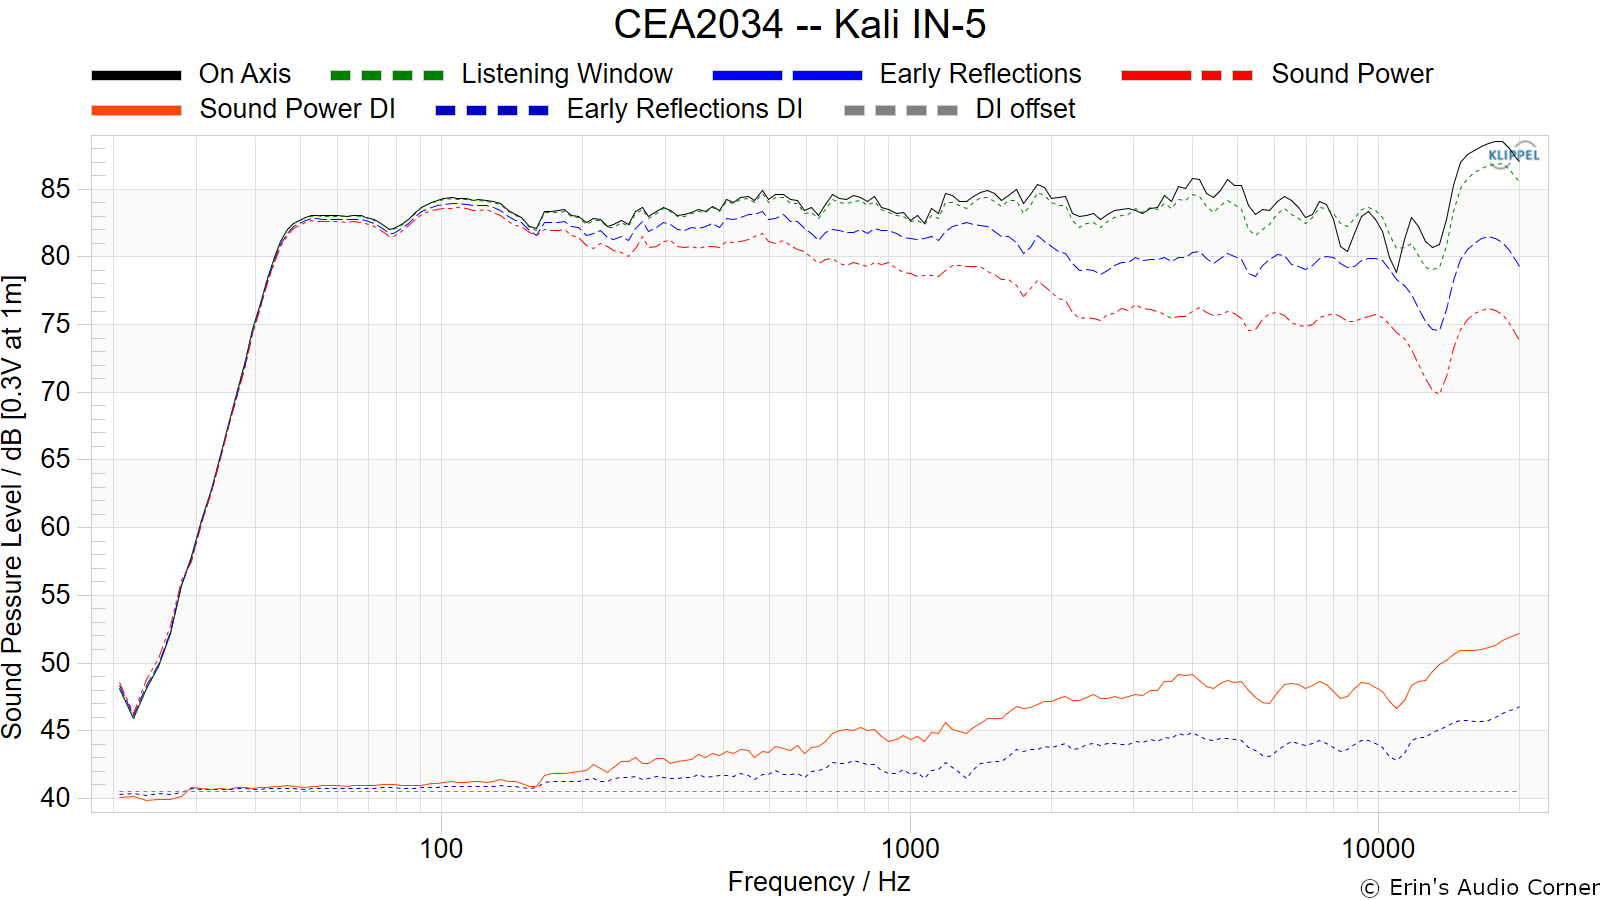
CTA-2034 / SPINORAMA:
The On-axis Frequency Response (0°) is the universal starting point and in many situations it is a fair representation of the first sound to arrive at a listener’s ears.
The Listening Window is a spatial average of the nine amplitude responses in the ±10º vertical and ±30º horizontal angular range. This encompasses those listeners who sit within a typical home theater audience, as well as those who disregard the normal rules when listening alone.
The Early Reflections curve is an estimate of all single-bounce, first-reflections, in a typical listening room.
Sound Power represents all the sounds arriving at the listening position after any number of reflections from any direction. It is the weighted rms average of all 70 measurements, with individual measurements weighted according to the portion of the spherical surface that they represent.
Sound Power Directivity Index (SPDI): In this standard the SPDI is defined as the difference between the listening window curve and the sound power curve.
Early Reflections Directivity Index (EPDI): is defined as the difference between the listening window curve and the early reflections curve. In small rooms, early reflections figure prominently in what is measured and heard in the room so this curve may provide insights into potential sound quality.
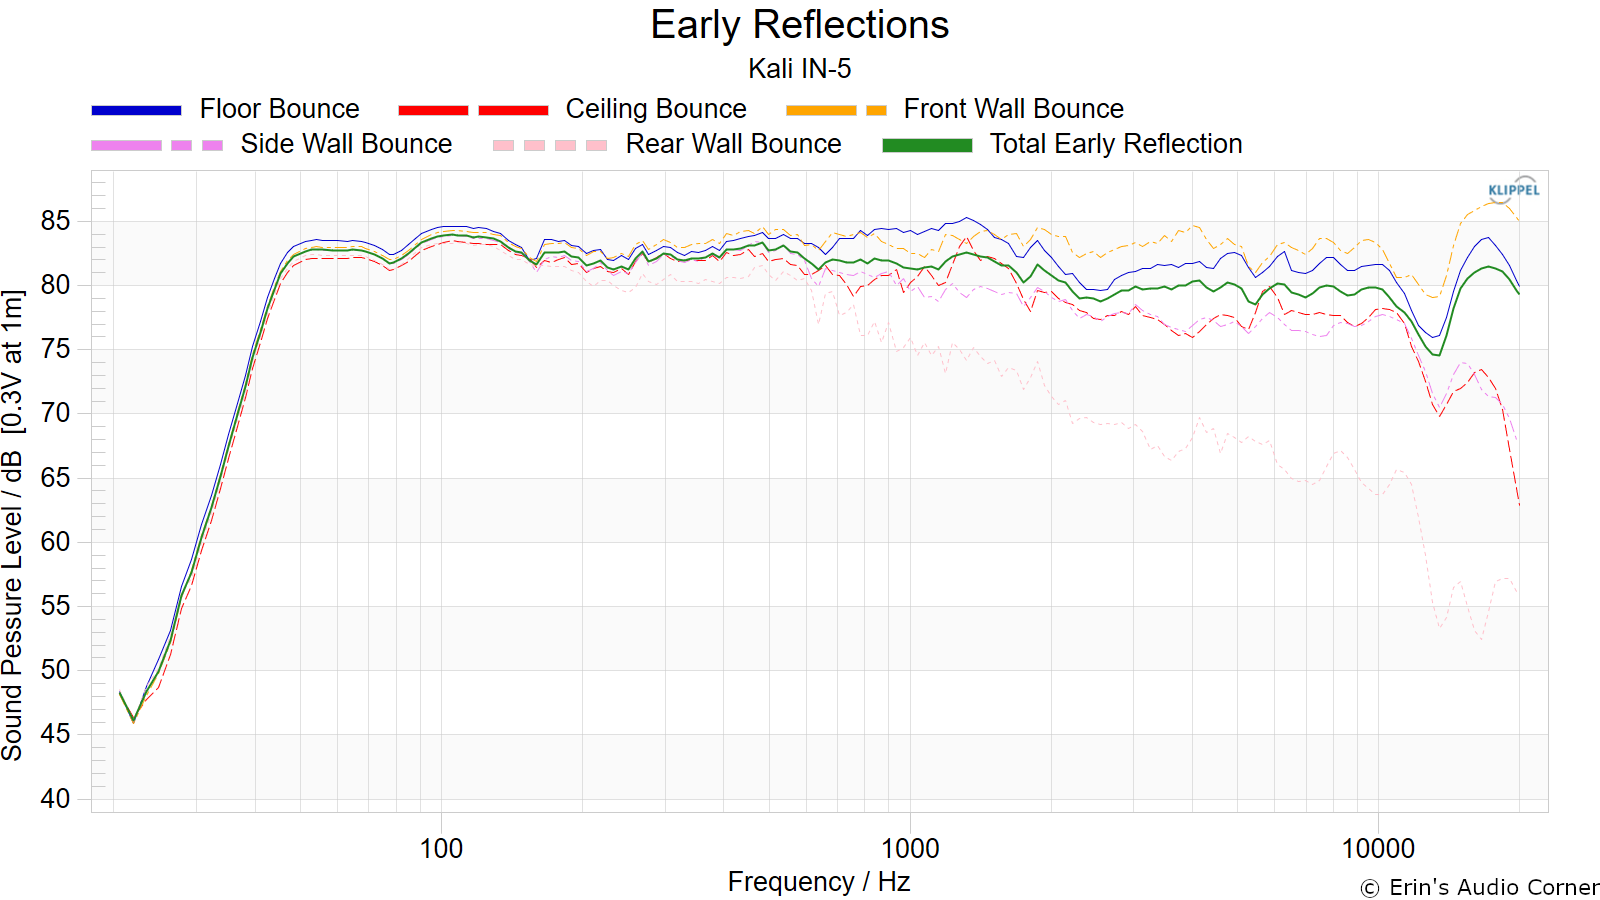
Early Reflections Breakout:
Floor bounce: average of 20º, 30º, 40º down
Ceiling bounce: average of 40º, 50º, 60º up
Front wall bounce: average of 0º, ± 10º, ± 20º, ± 30º horizontal
Side wall bounces: average of ± 40º, ± 50º, ± 60º, ± 70º, ± 80º horizontal
Rear wall bounces: average of 180º, ± 90º horizontal
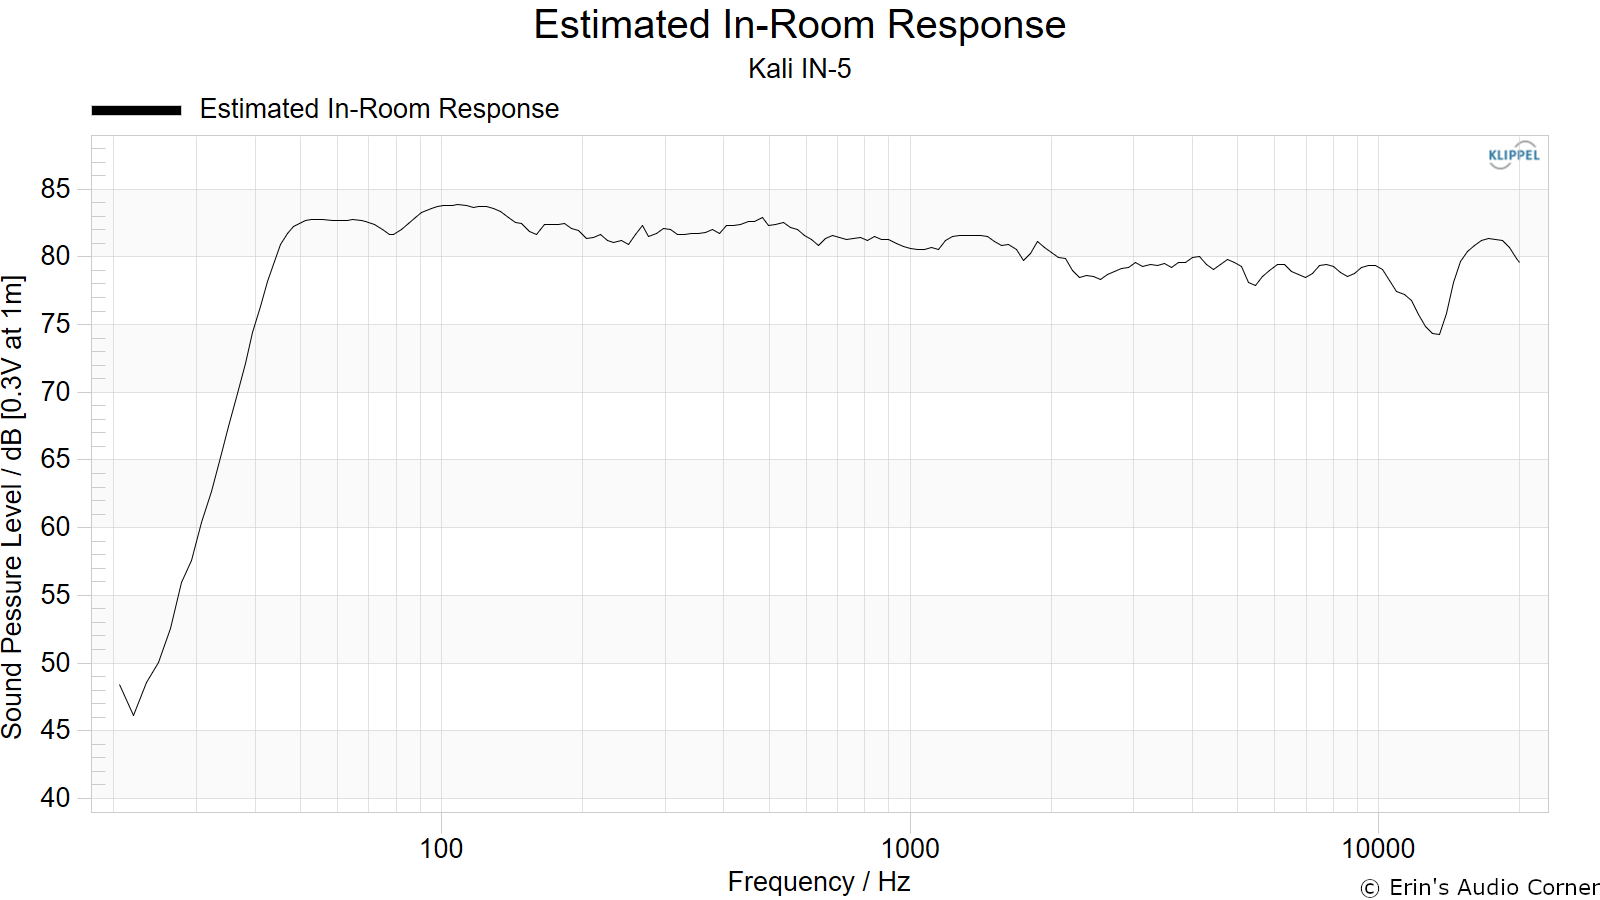
Estimated In-Room Response:
In theory, with complete 360-degree anechoic data on a loudspeaker and sufficient acoustical and geometrical data on the listening room and its layout it would be possible to estimate with good precision what would be measured by an omnidirectional microphone located in the listening area of that room. By making some simplifying assumptions about the listening space, the data set described above permits a usefully accurate preview of how a given loudspeaker might perform in a typical domestic listening room. Obviously, there are no guarantees because individual rooms can be acoustically aberrant. Sometimes rooms are excessively reflective (“live”) as happens in certain hot, humid climates, with certain styles of interior décor and in under-furnished rooms. Sometimes rooms are excessively “dead” as in other styles of décor and in some custom home theaters where acoustical treatment has been used excessively. This form of post processing is offered only as an estimate of what might happen in a domestic living space with carpet on the floor and a “normal” amount of seating, drapes, and cabinetry.
For these limited circumstances it has been found that a usefully accurate Predicted In-Room (PIR) amplitude response, also known as a “room curve” is obtained by a weighted average consisting of 12 % listening window, 44 % early reflections and 44 % sound power. At very high frequencies errors can creep in because of excessive absorption, microphone directivity, and room geometry. These discrepancies are not considered to be of great importance.
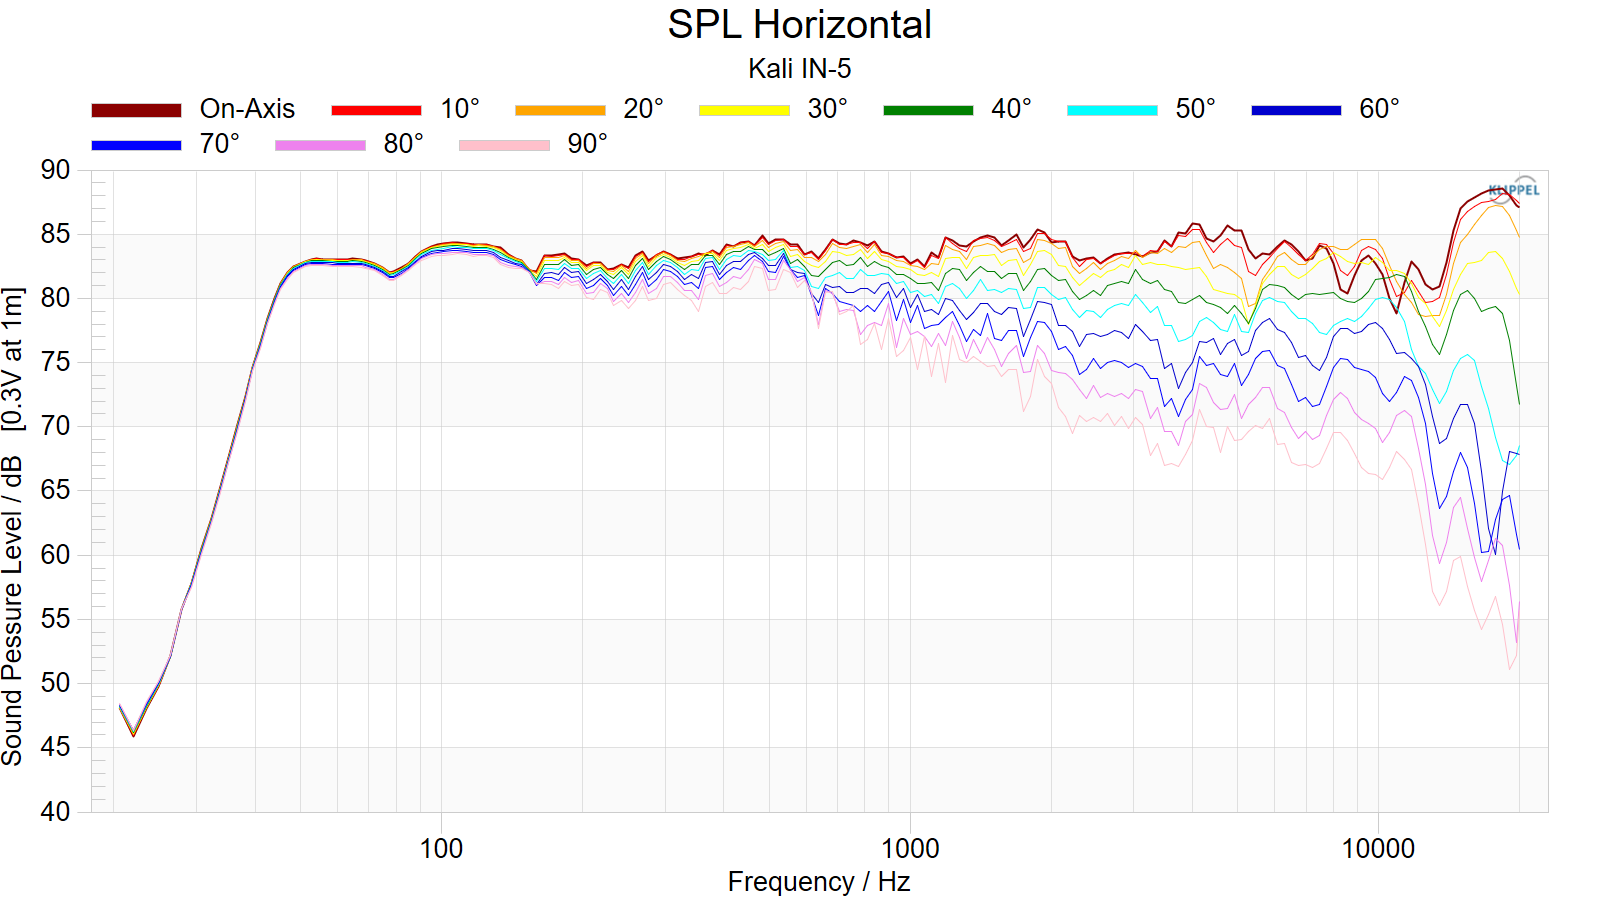
Horizontal Frequency Response (0° to ±90°):
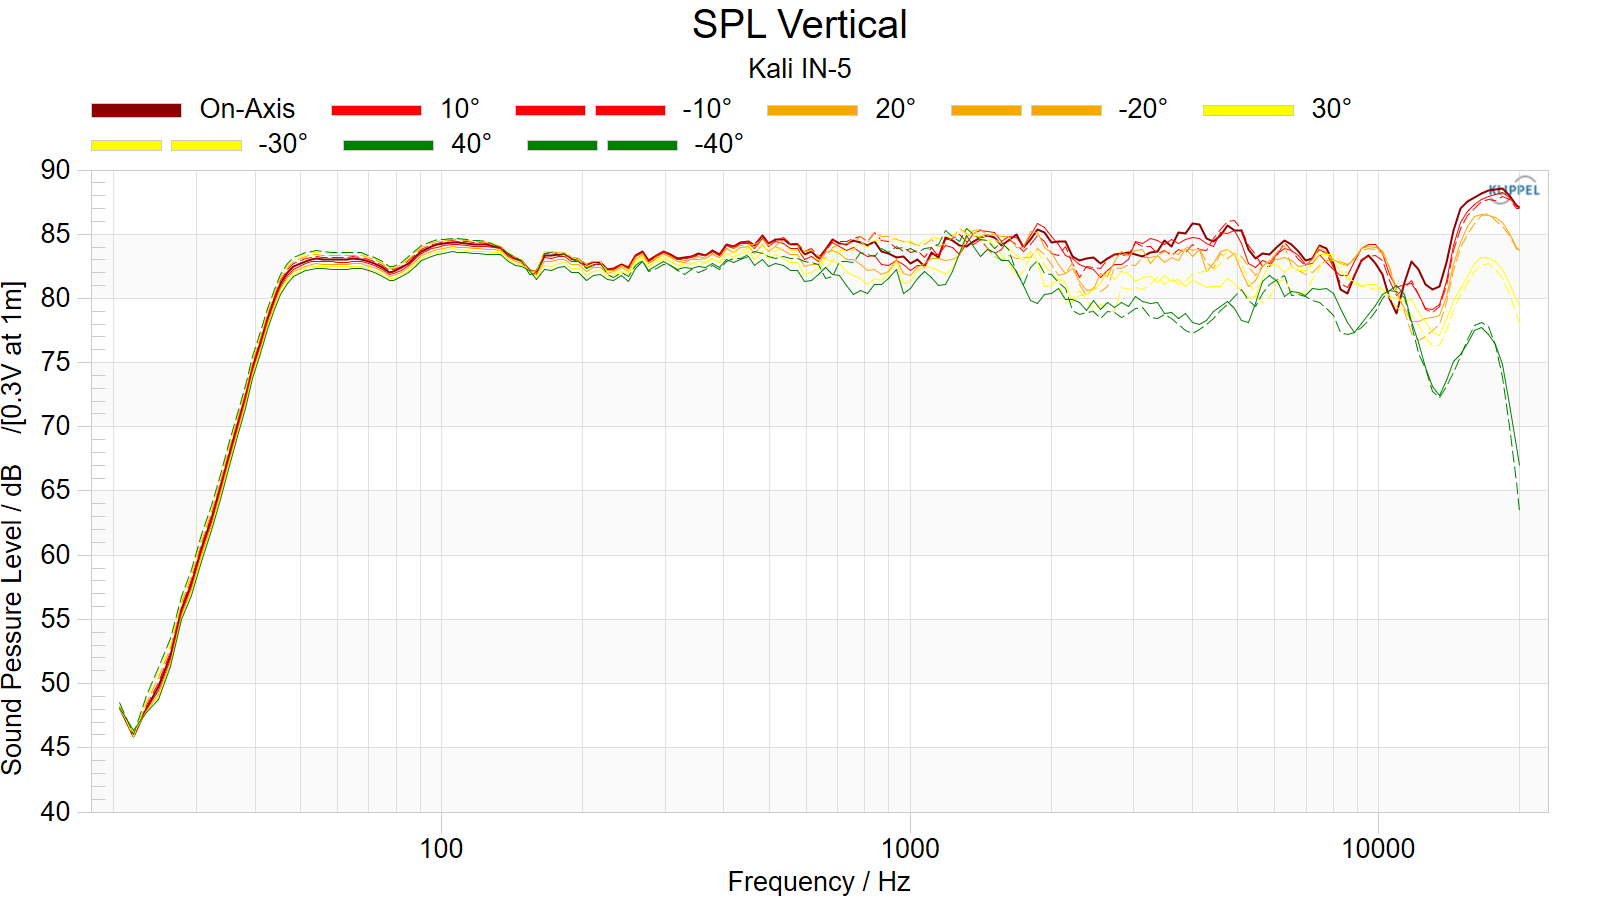
Vertical Frequency Response (0° to ±40°):
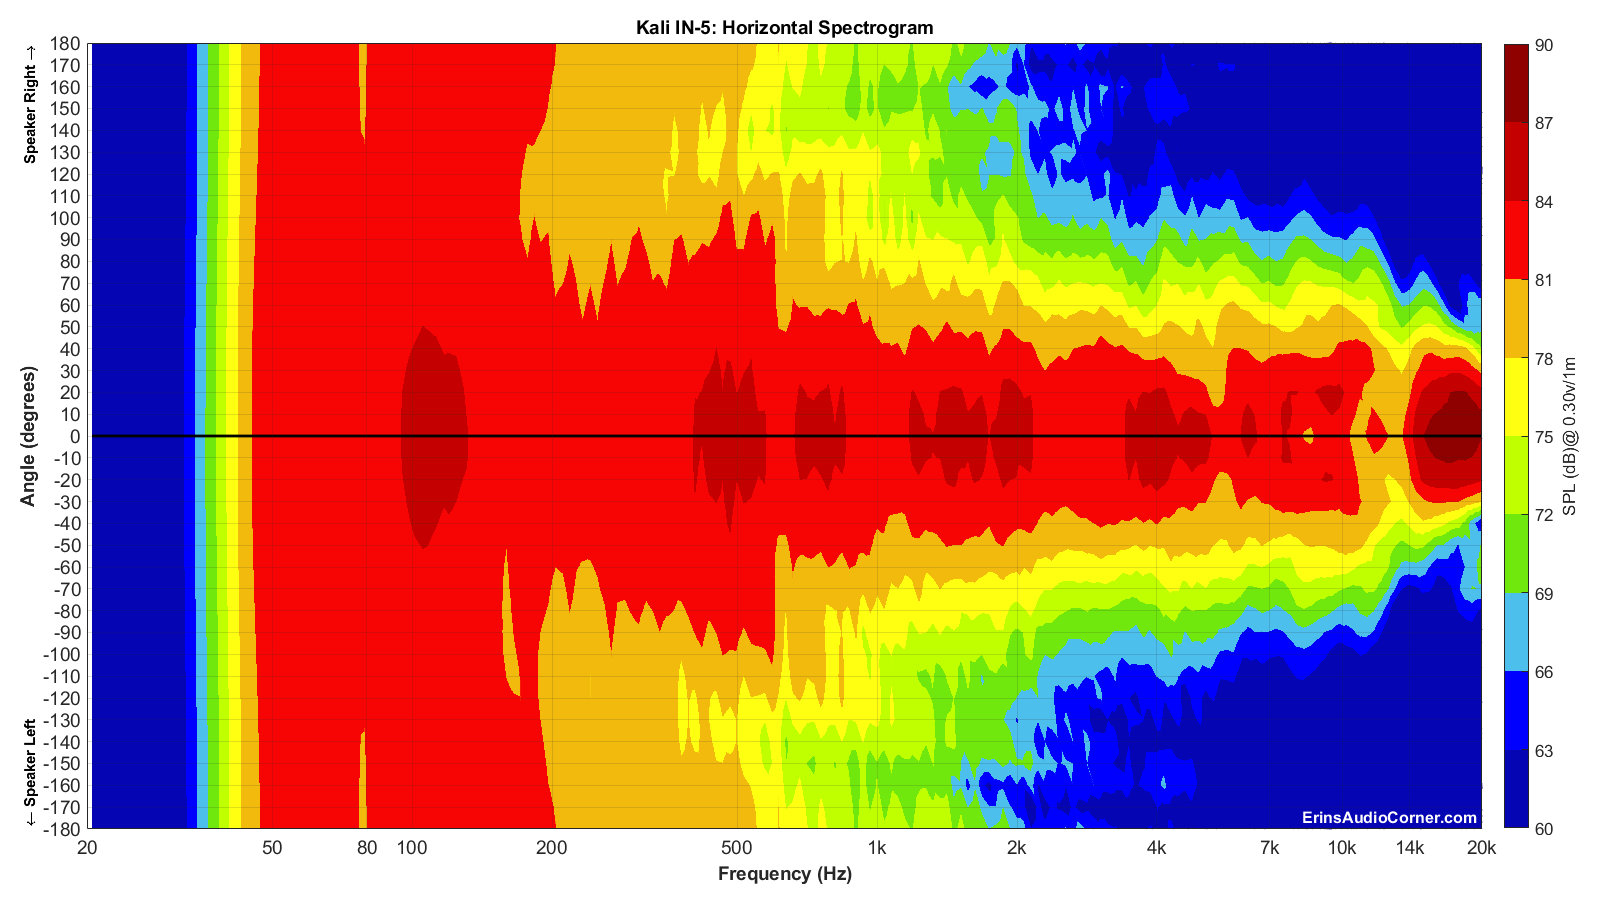
Horizontal Contour Plot (not normalized):
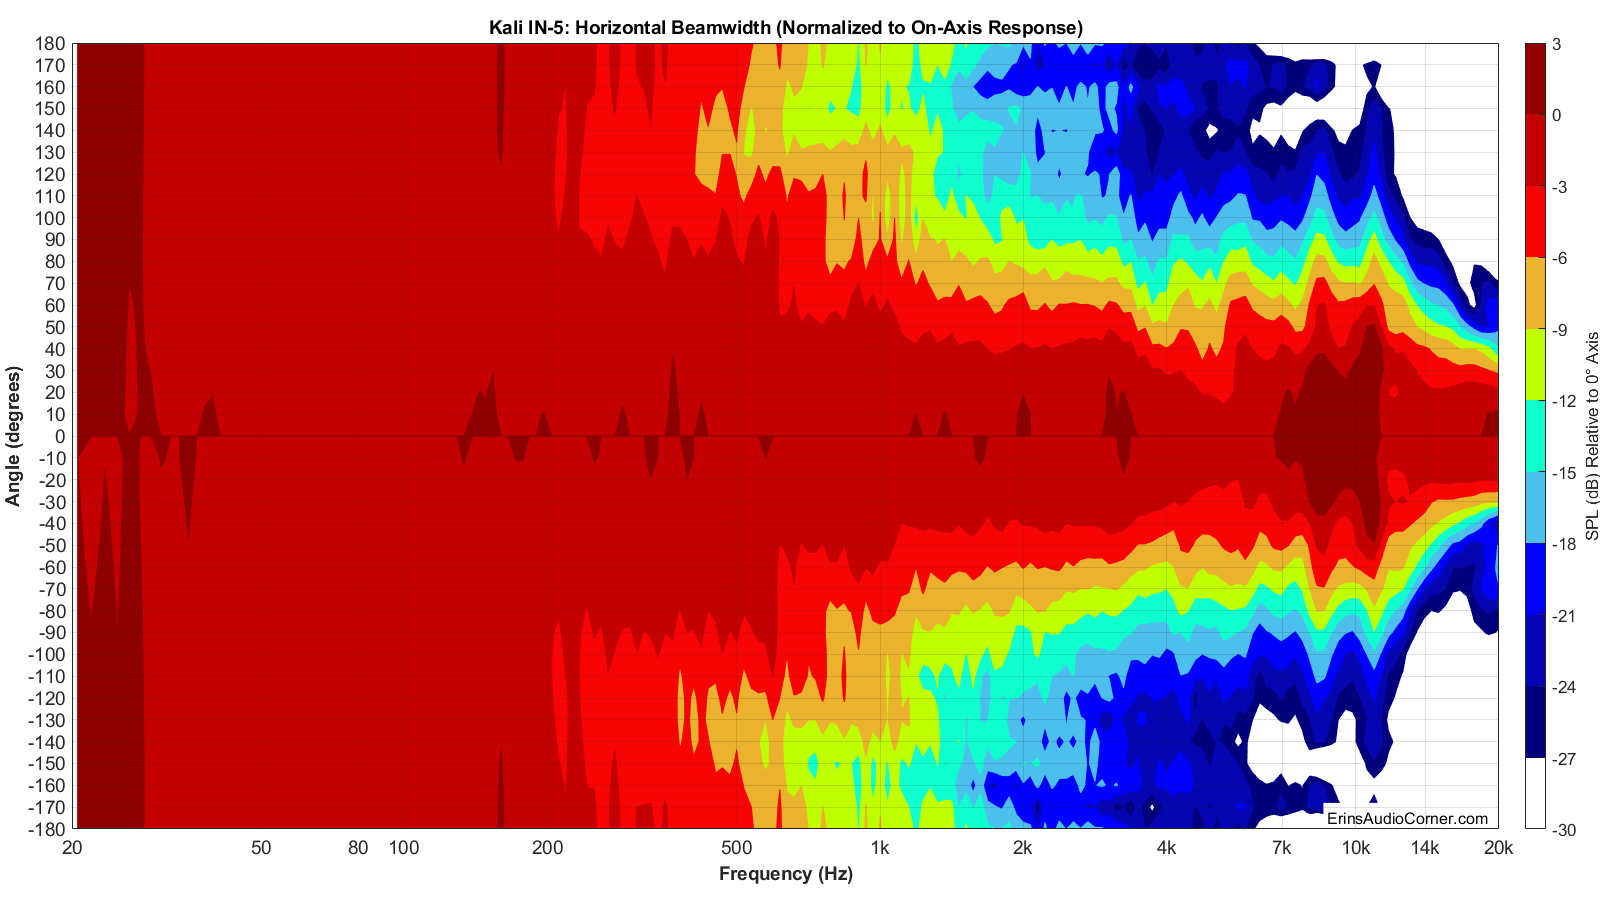
Horizontal Contour Plot (normalized):
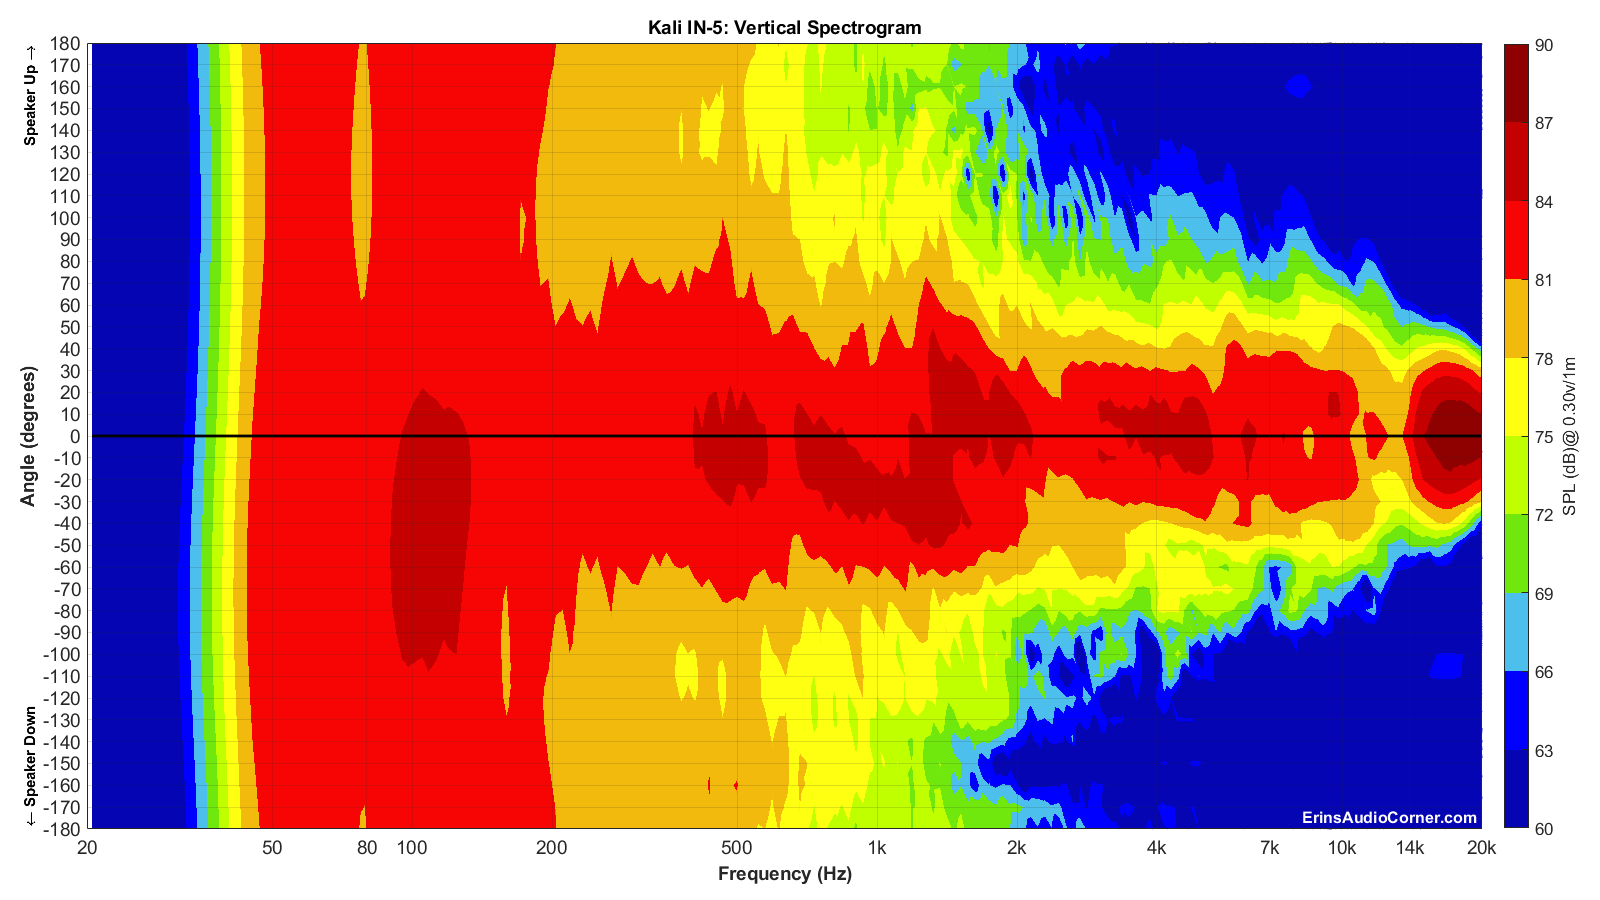
Vertical Contour Plot (not normalized):
Vertical Contour Plot (normalized):

Additional Measurements
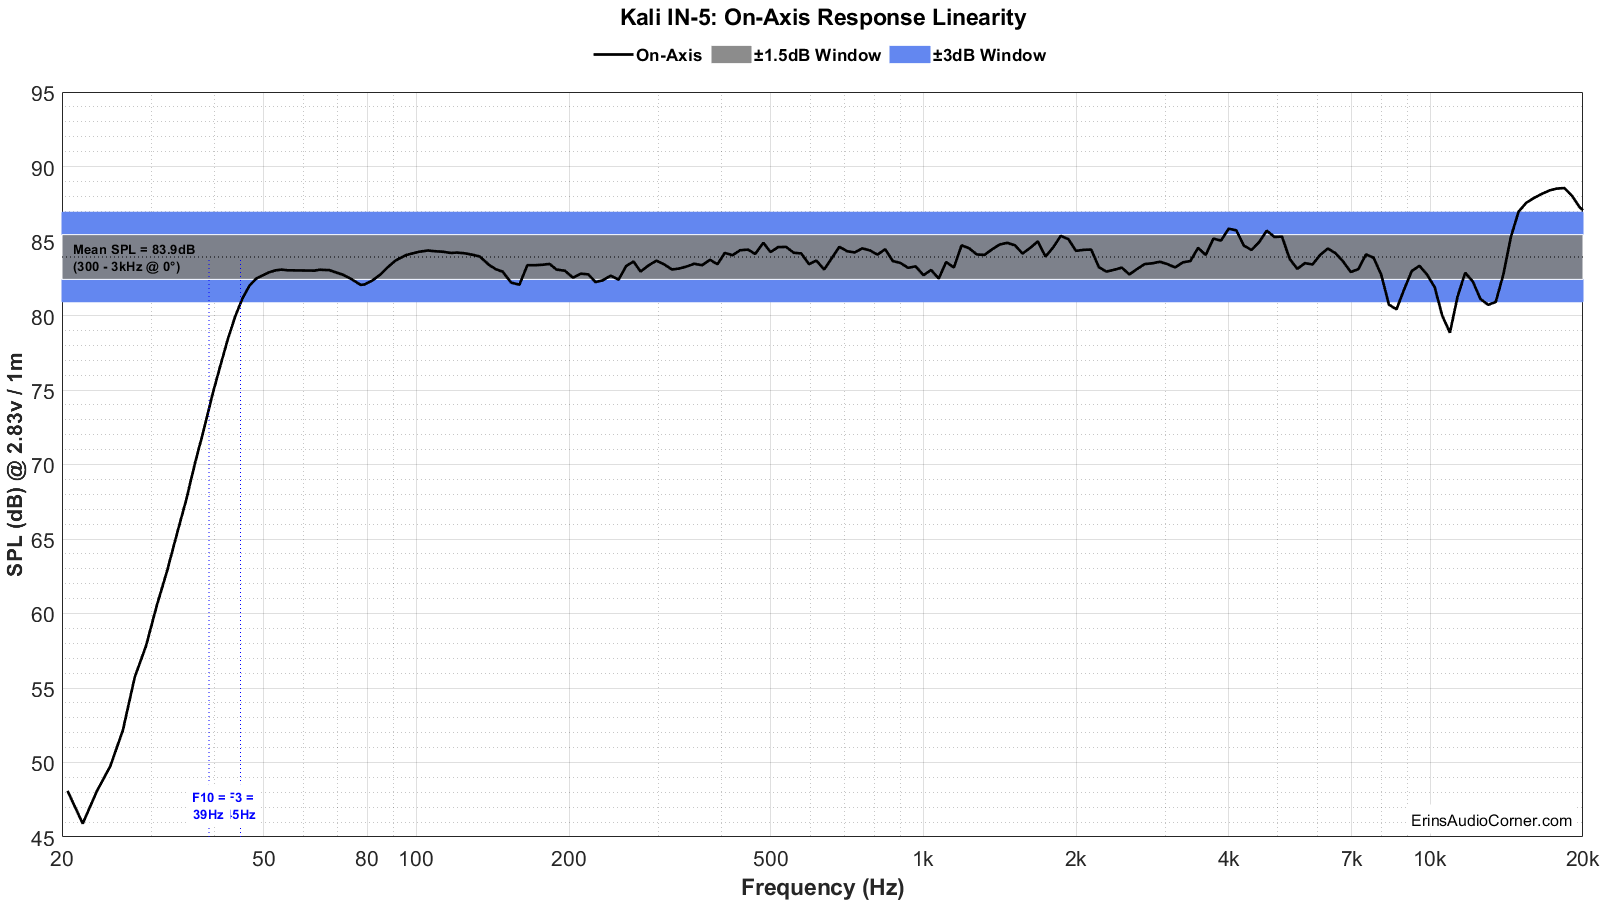
On-Axis Response Linearity
Response linearity is -5.08/+3.64 dB (80Hz to 16kHz). This large deviation comes from the wide on-axis dip above ~7kHz and the steep rise in treble above 14kHz.
“Globe” Plots
These plots are generated from exporting the Klippel data to text files. I then process that data with my own MATLAB script to provide what you see. These are not part of any software packages and are unique to my tests.
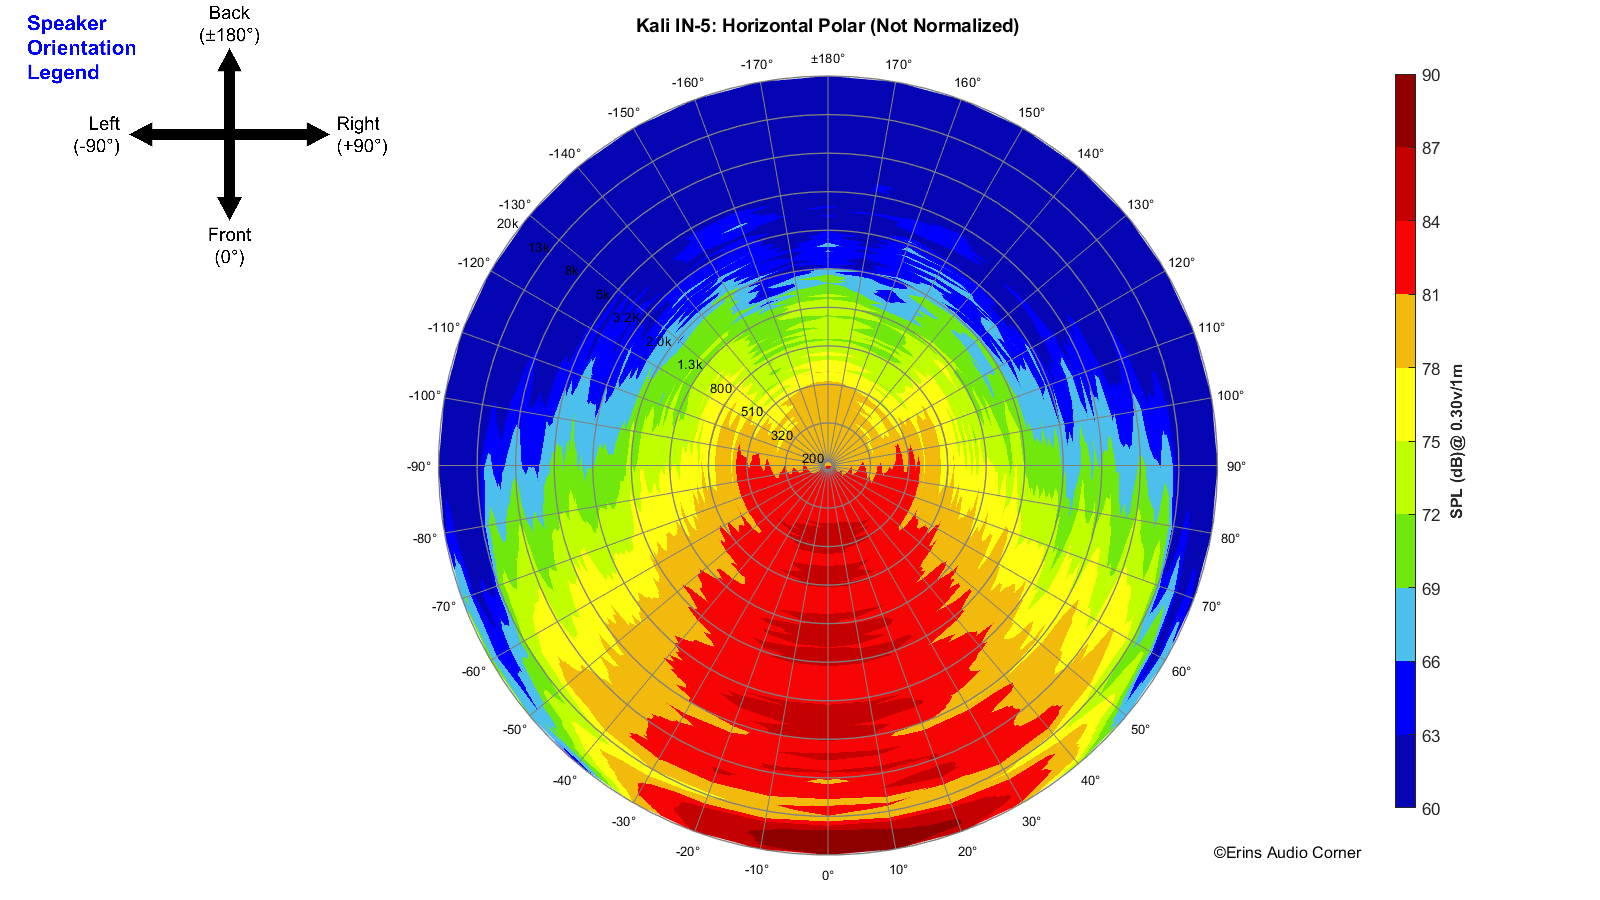
Horizontal Polar (Globe) Plot:
This represents the sound field at 2 meters - above 200Hz - per the legend in the upper left.
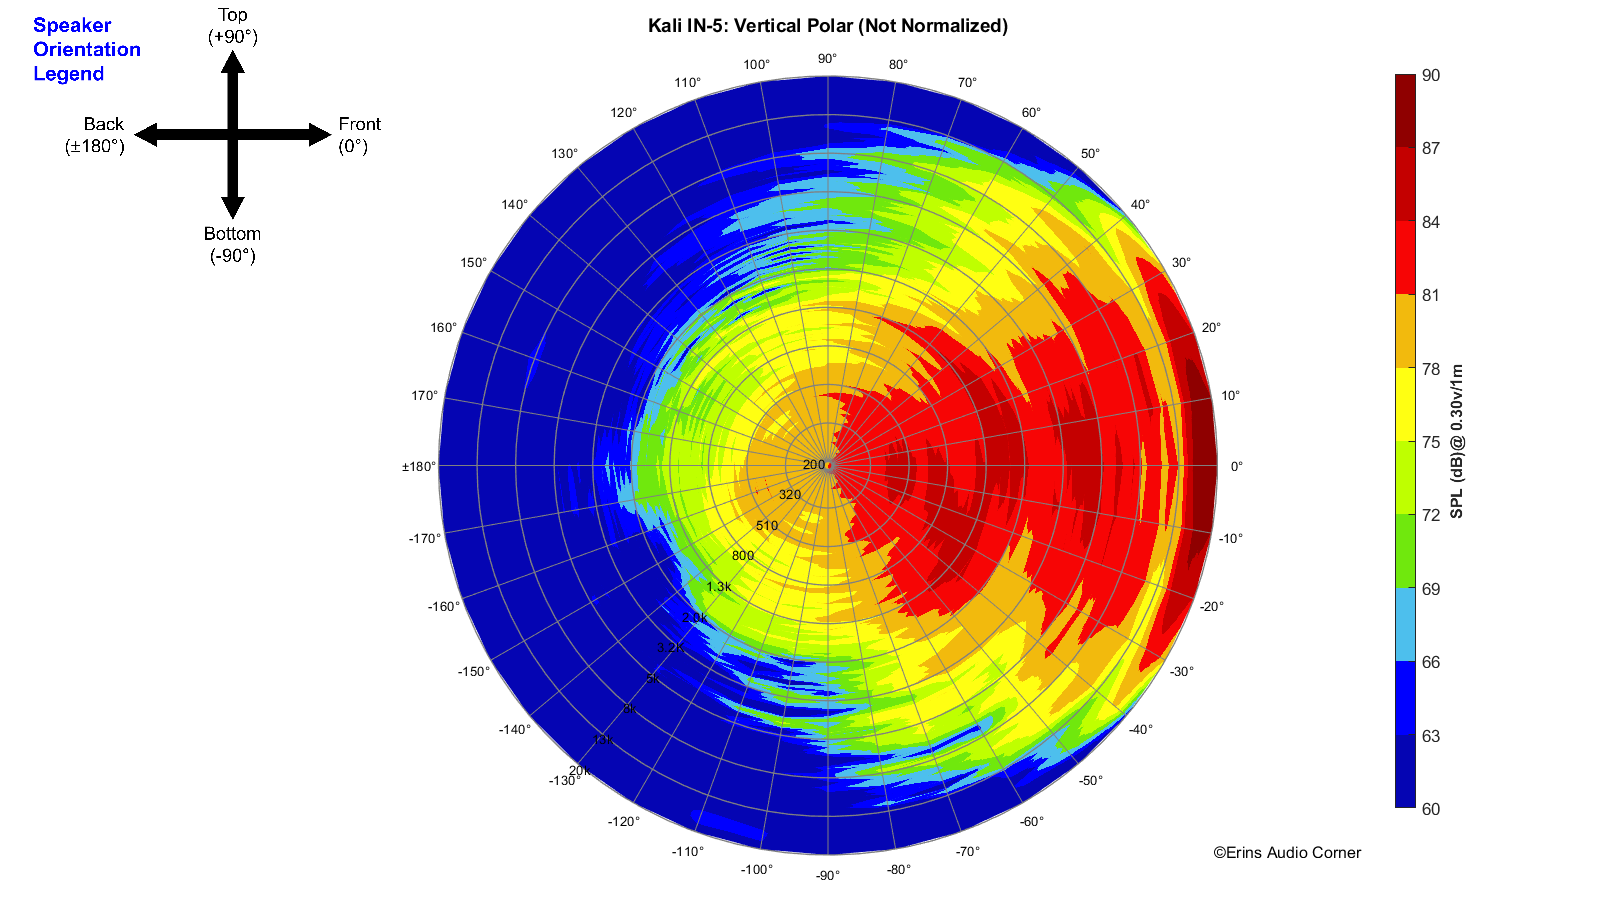
Vertical Polar (Globe) Plot:
This represents the sound field at 2 meters - above 200Hz - per the legend in the upper left.
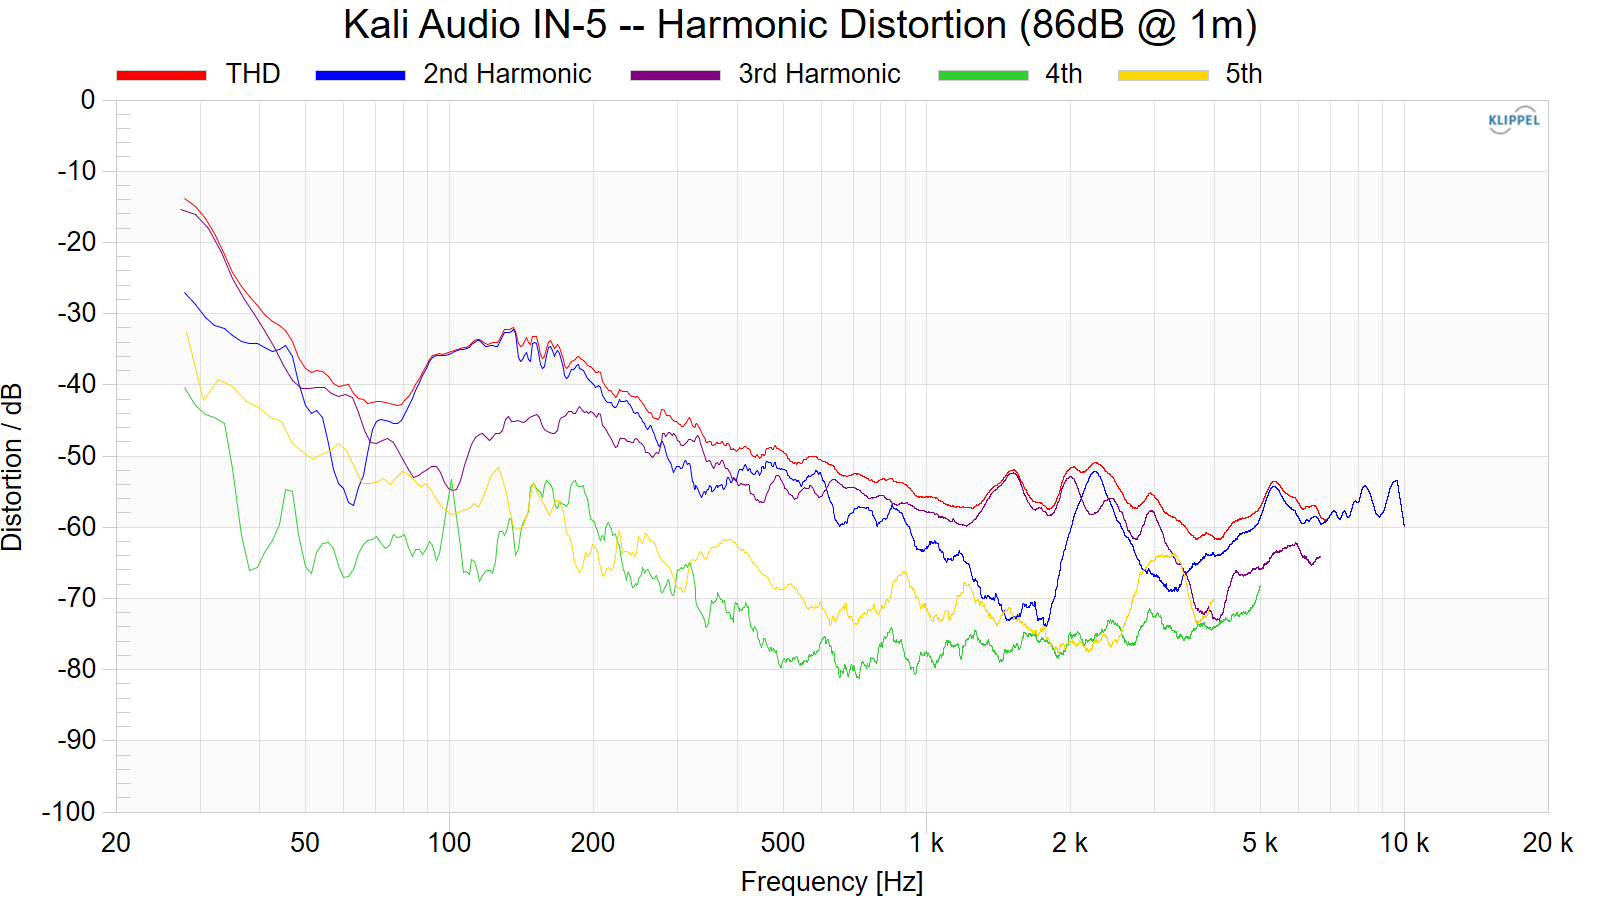
Harmonic Distortion
Harmonic Distortion at 86dB @ 1m:
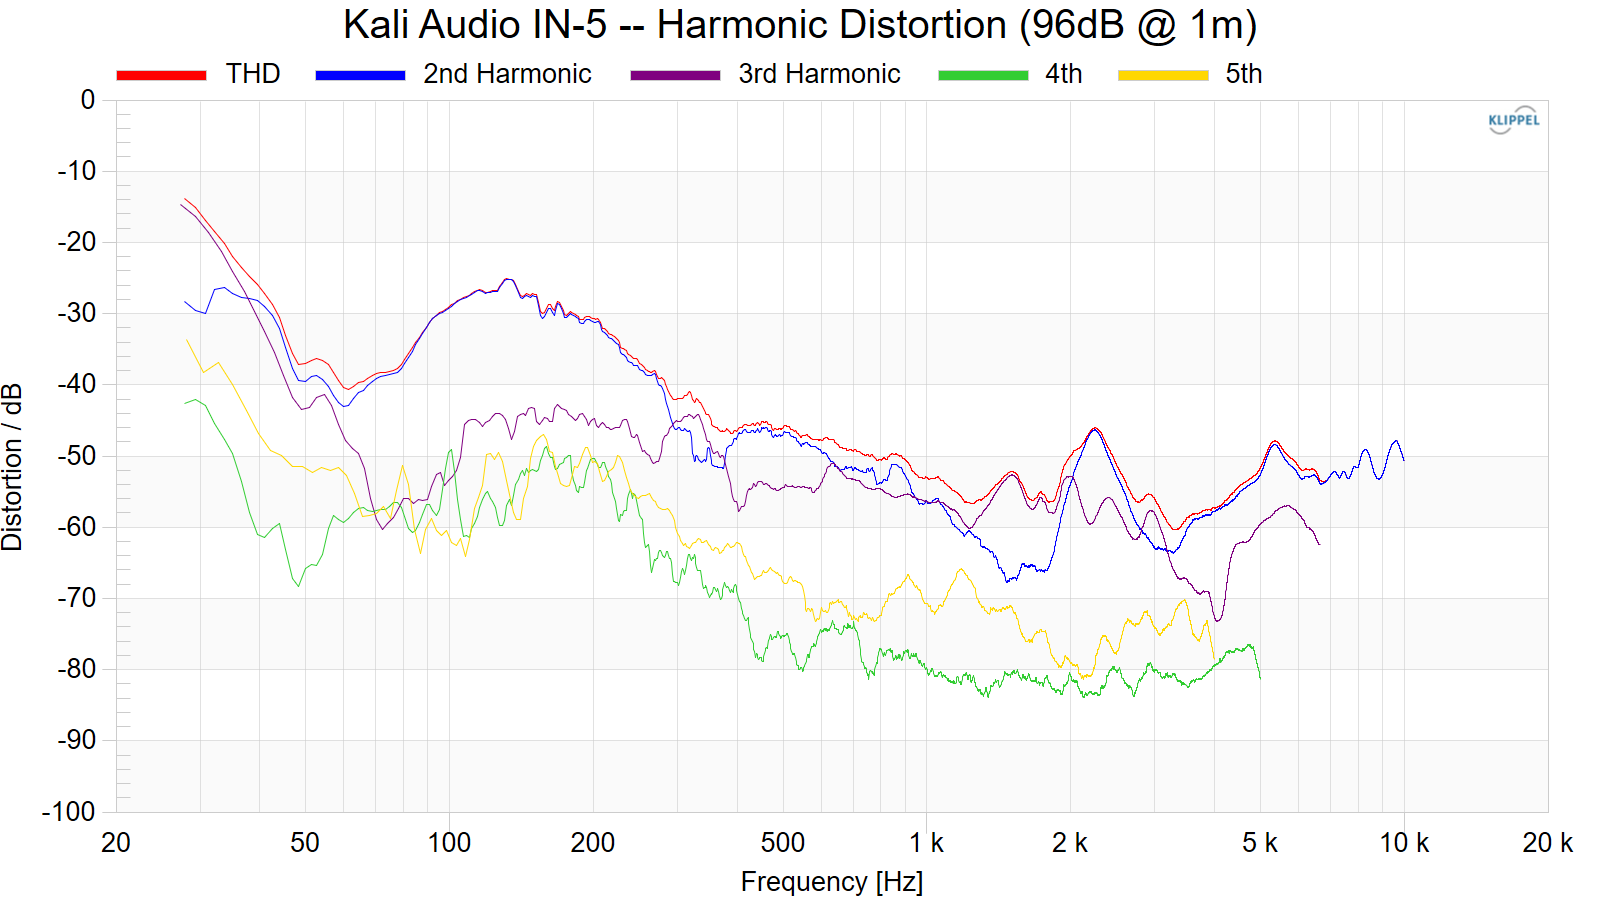
Harmonic Distortion at 96dB @ 1m:
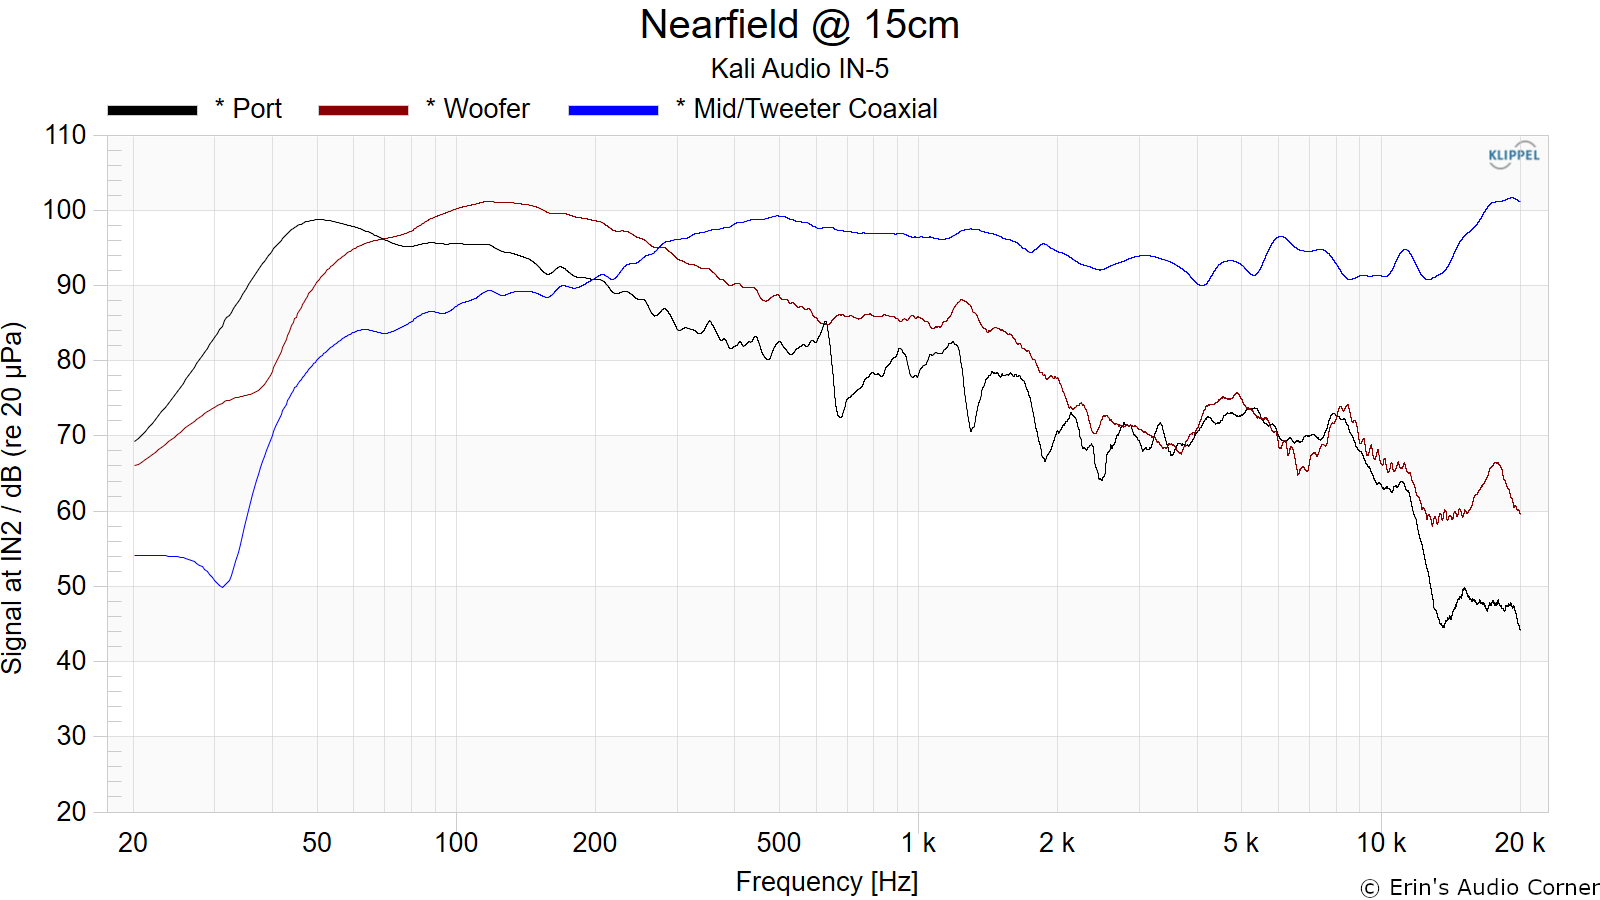
Near-Field Response
Nearfield response of individual drive units:
Dynamic Range (Instantaneous Compression Test)
The below graphic indicates just how much SPL is lost (compression) or gained (enhancement; usually due to distortion) when the speaker is played at higher output volumes instantly via a 2.7 second logarithmic sine sweep referenced to 76dB at 1 meter. The signals are played consecutively without any additional stimulus applied. Then normalized against the 76dB result.
The tests are conducted in this fashion:
- 76dB at 1 meter (baseline; black)
- 86dB at 1 meter (red)
- 96dB at 1 meter (blue)
- 102dB at 1 meter (purple)
The purpose of this test is to illustrate how much (if at all) the output changes as a speaker’s components temperature increases (i.e., voice coils, crossover components) instantaneously.
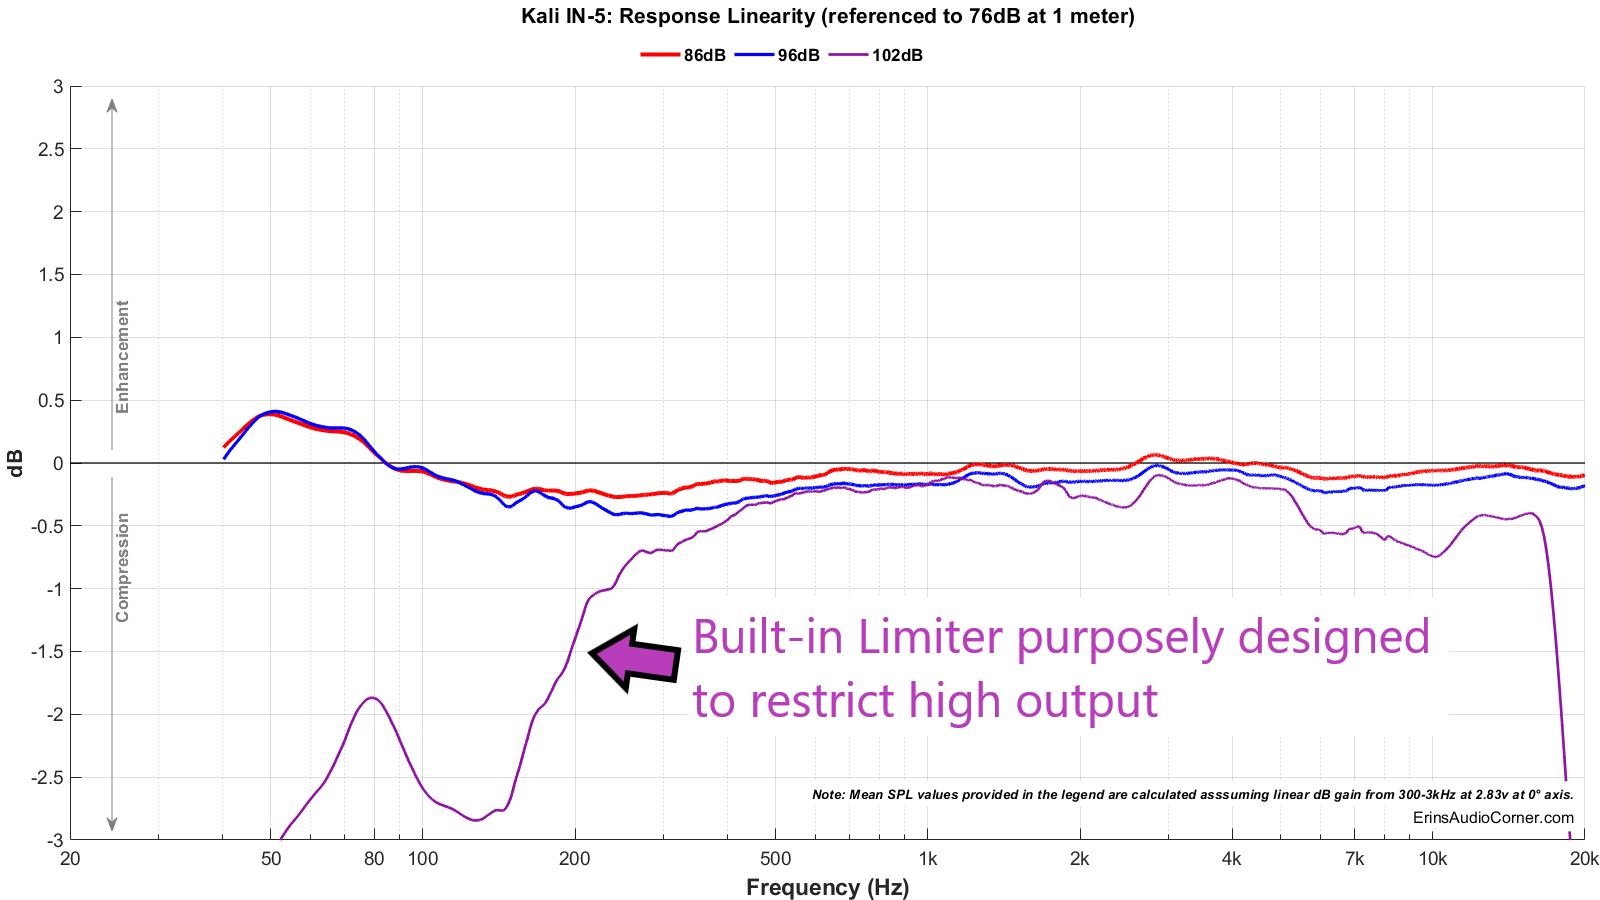
Based on my results above, it is obvious the output is limited (via internal DSP) somewhere above the 96dB @ 1m output level. Kali confirmed this measurement is accurate and a limiter is purposely used here to protect the speakers from being overdriven. I do find it interesting that the limiter does not restrict the 80Hz region as much as it does the other frequencies, though.
“Midrange as a waveguide” High Frequency Effect
In the photos section I mentioned the purpose of the midrange cone is to act as a waveguide for the tweeter. I performed a test in early 2013 with Kef’s Q100 Uni-Q drive unit to see just what kind of (objective) impact the position of the midrange has on the high frequency response. To test this back then I used a 9v battery and connected it to the terminals of the midrange to “fix” the position in and out. I then measured the response of the tweeter and compared the three positions (in/rest/out). I have recreated that test here, shown below. Using a 9v battery again, I connected the leads of the midrange cone (after disassembling the speaker). The cone’s movement was approximately ±1 mm. I have provided a gif below showing the movement range.
As you can see in the below graphic, the position of the cone does influence the high frequency response. Depending on frequency, the effect is as much as 2dB.
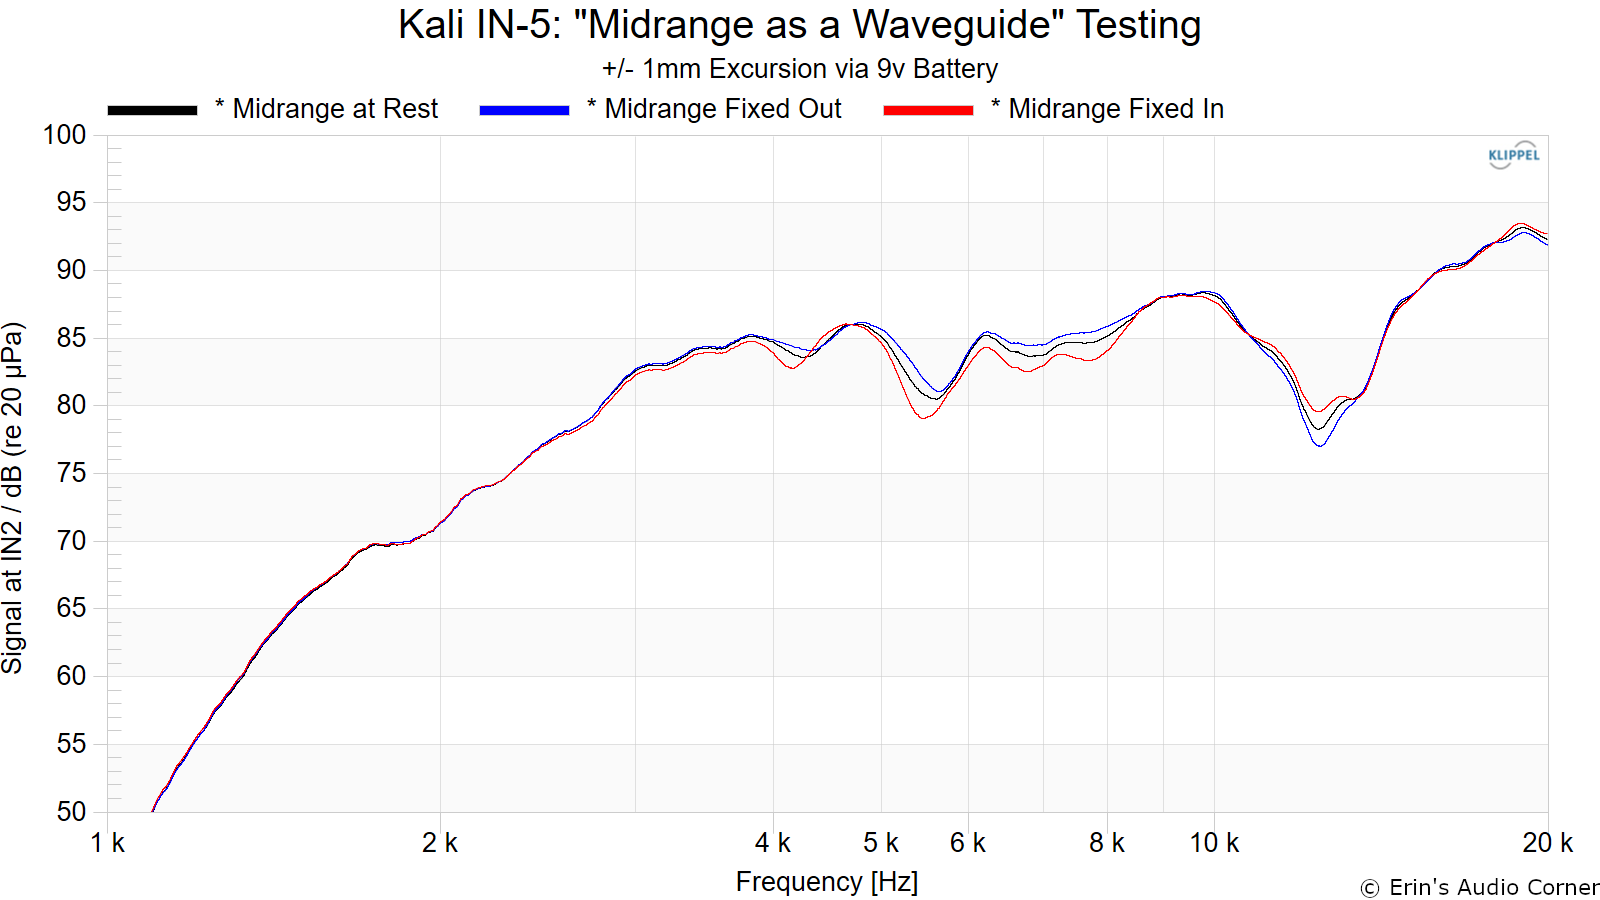
Is this effect audible? Well, two things in my personal opinion:
- Cone travel speed back and forth is incredibly fast. Are you really going to hear this “distortion” when you’re talking about frequencies above 4kHz? For point of reference, that’s 0.25 milliseconds.
- You’d have to really be pushing the driver to get it to move this much. Using calipers, I measured the effective diameter of the midrange to be about 100 mm (3.93 inches) and the area taken up by the tweeter assembly to be around 40 mm (1.57 inches). Taking the area of the former and subtracting the area of the latter nets me an area of about 10.20 inches² which results in a diameter of 3.60 inches. Using this website, I calculate the dBSPL @ 1m of a 3.60 inch cone diameter at 280Hz to be 1mm. So, assuming all my math and logic is correct, you would have to be playing this speaker at 100dB @ 1m to move the midrange cone 1mm at 280Hz (the crossover point; my target here). From my compression testing, I already know the output is reduced somewhere in between 96dB and 102dB due to the built-in limiter. Odds are, then, the midrange is not even moving that much because the output level is limited.
Now, to be fair, this is purely a “fun”, “FYI” test and I cannot attest to the audibility of this “high frequency modulation” as it has been termed. However, from a scientific standpoint, I think it illustrates the purpose of the midrange in such a design.
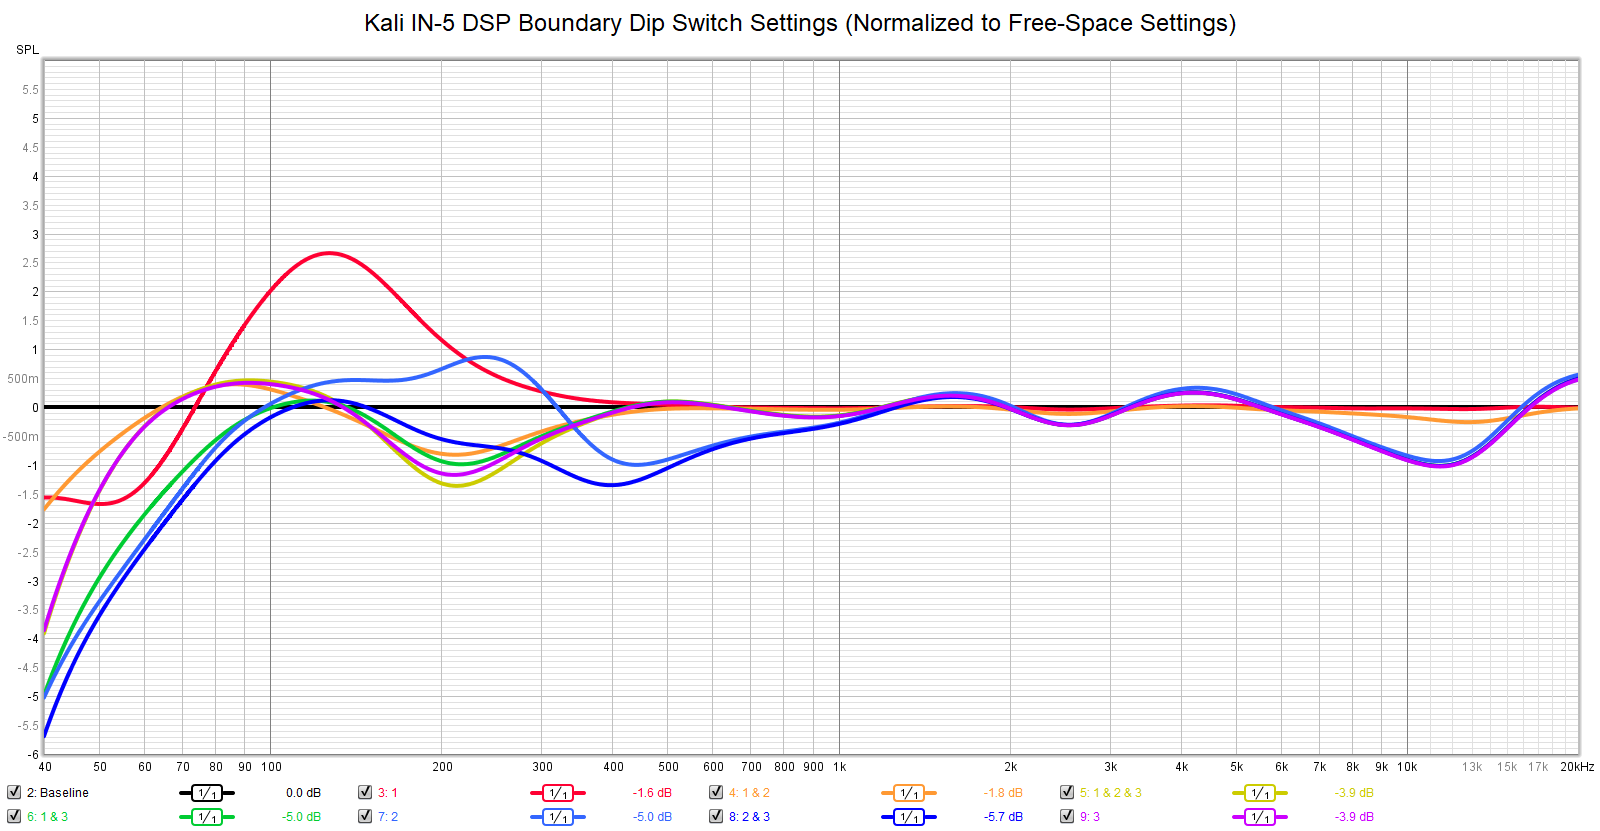
Boundary Settings
These speakers come with a set of pre-configured boundary settings that can be enabled easily via the dip switches on the back. Below is a close shot of the dip switches.
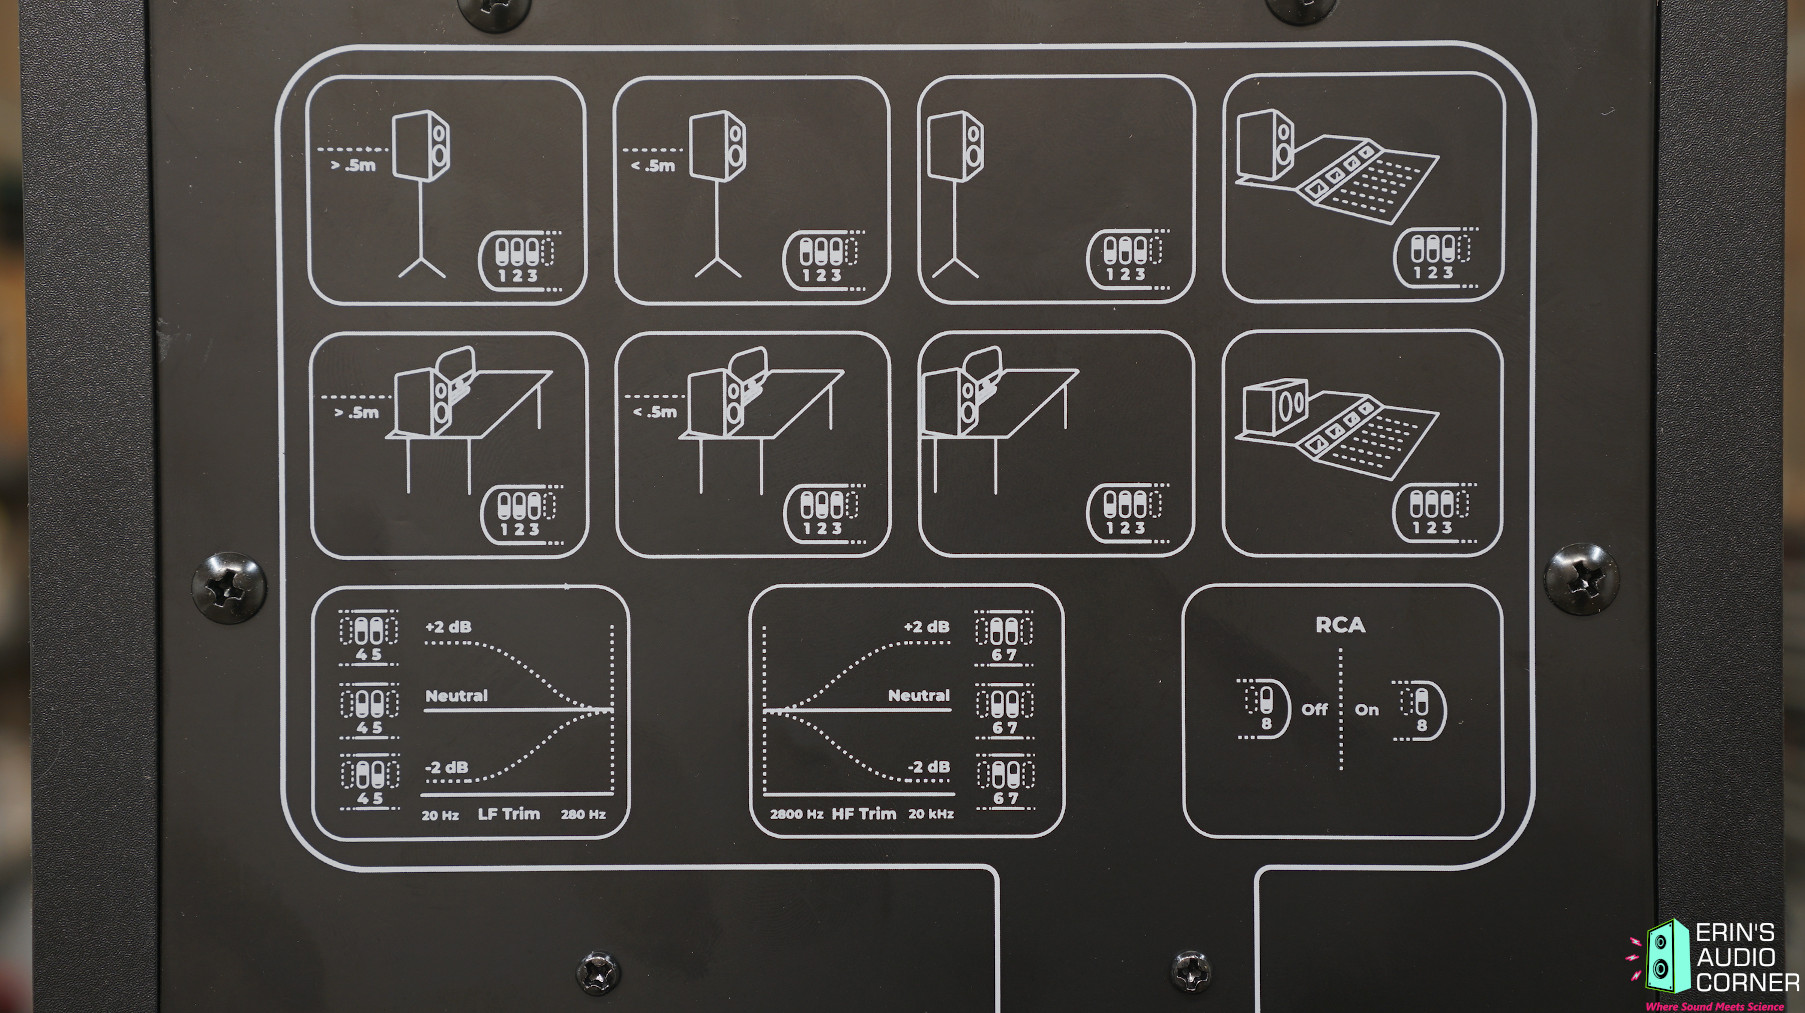
The dip switch combinations displayed above are labeled and plotted in the graphic below.
In-Room Measurements from the Listening Position
Below is the actual measured in-room response (with no DSP correction). This is a spatial average taken over approximately 1 cubic foot. The speakers were placed approximately 1.2m from the front wall (not the cabinets; but the actual wall). The listening position was primarily at 1.5m but for this test I measured the response at two different distances from the speakers.
Black = Predicted In-Room Response from SPIN data
Blue = Actual In-Room Measured Response from Main Listening Position at 1.5 meters
Red = Actual In-Room Measured Response from Main Listening Position at 3.5 meters
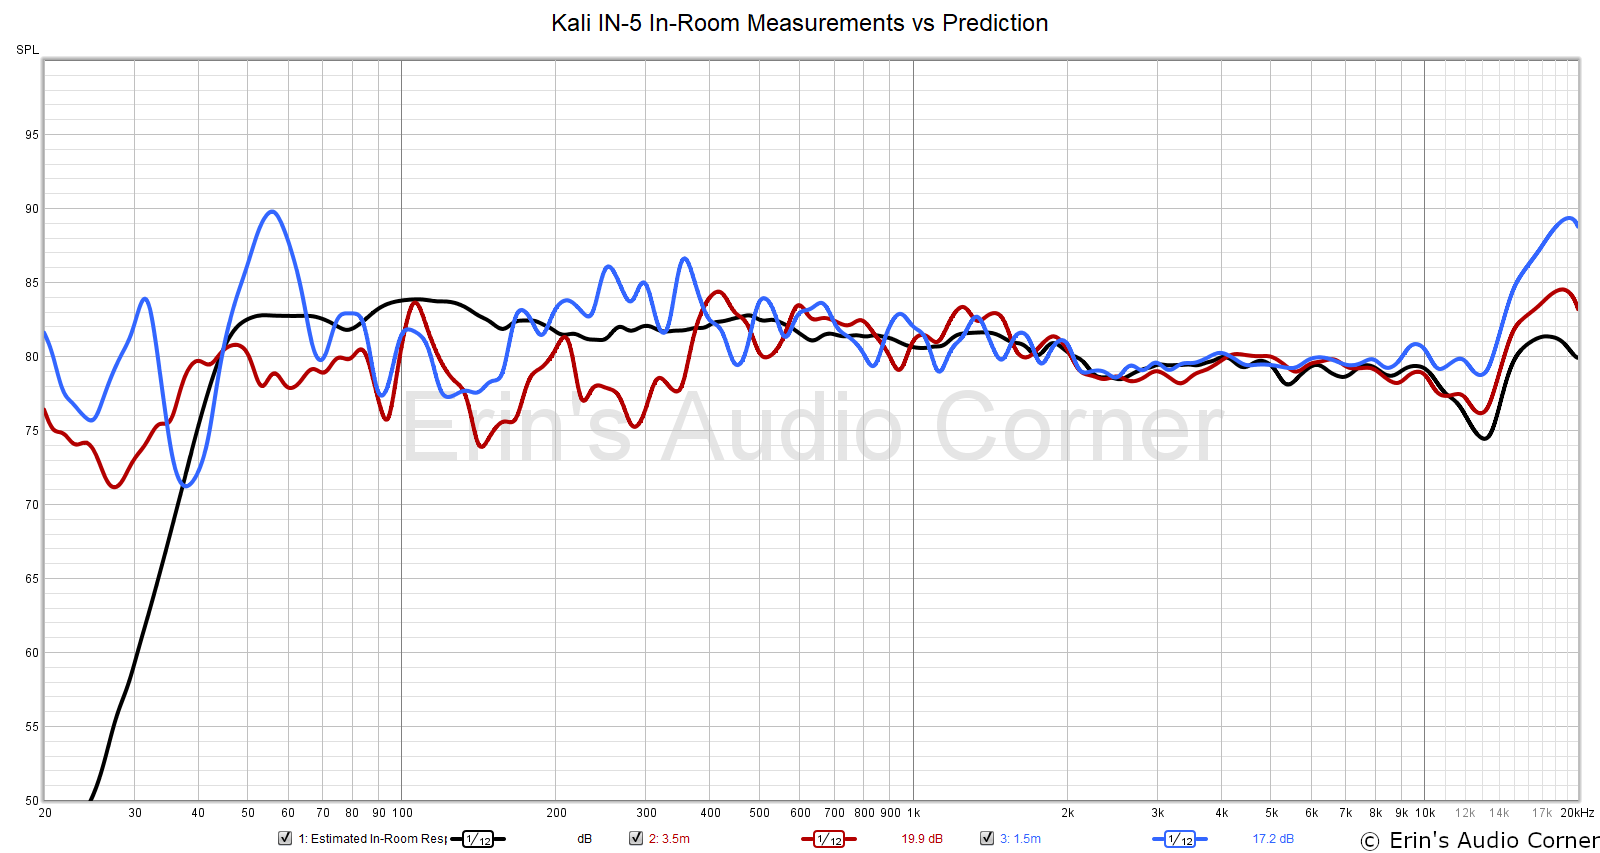
While the prediction in this test is close to the actual measured response, the prediction does not do as good a job matching in-room measured response’s high frequency trend above 10kHz when in the nearfield. You can see in the above graphic that sitting closer to the speaker yields a higher level response in the high frequency region (blue, 1.5 meters) and when backing away (red, 3.5 meters) the HF response comes down a bit. This is expected because as you sit closer to the speaker there is less room effect and you are primarily matching the on-axis or listening window response curves more than the predicted far-field response.
Parting / Random Thoughts
If you want to see the music I use for evaluating speakers subjectively, see my Spotify playlist.
- Subjective listening was primarily at 1.5 meters. Subjective listening was conducted at 80-95dB at this distance. Higher volumes were done simply to test the output capability in case one wants to try to sit further away.
- If you are looking for speakers for home theater or high-volume listening in a farfield situation like a living room or media room, these speakers are not recommended. These are designed for nearfield listening; the manual states the recommended listening range at 1 to 2 meters and most engineers mix in the 80-85dB range. As you can see in my frequency response linearity testing, the output is limited (via internal DSP) somewhere above the 96dB @ 1m output level. This is purposely designed to protect the speakers from being overdriven and thanks to this, they are indeed best served at moderate volumes and/or nearfield listening.
- Generally speaking, most coaxial designs tend to fare better when angled slightly off-axis. A 10° toe-in or toe-out yields good results. In this case, however, the best listening axis appears to be directly on-axis, at 0° horizontal and vertical.
- The front port means you have more ability to move these speakers in to the prime spot for your needs. And thanks to the dip switches you have more ability to place the speakers where you need; whether free standing, near a wall or on a console.
- The on-axis linearity is ±1.5dB above 50Hz but once you enter the 7kHz region, things take a turn. The high-frequency droop above 7kHz is bothersome to see in the data, though, it wasn’t as problematic as I might have otherwise expected. The 6-8kHz region is responsible for sibilance and most people tend to cry foul when a speaker is sibilant. The IN-5 is not that. However, there was a feeling of spaciousness that was taken out of some tracks I listened to that I believe are due to this HF dip.
- The bass of these speakers is downright flabbergasting. They don’t plumb the depths of 20Hz; you’ll still need a subwoofer for that. But they have absolutely no problem providing plenty of impact from a 50Hz kickdrum fundamental because the roll off doesn’t start until below this point. Aside from the sheer punch these possess is the detail. In The Police’s Wrapped Around Your Finger the bass line has vibrato. I mean, yea, a string is supposed to vibrate. But with these speakers, in the nearfield, you can almost see the waveform of the bass as it generates the tone. It’s like being in The Matrix. In fact, the bass of these speakers was my favorite thing. And there’s a lot to like about the IN-5.
- In Norah Jones’ Tell Yer Mama, the left singer was very distinct; moreso than in most other speakers I have auditioned.
- In Dire Straits’ Money For Nothin the opening guitar is panned around the stage and mixed out of phase, to the left of the soundstage. The IN-5s did a great job of providing a very distinct location of this out-of-phase effect while also providing clear separation between the same guitar that is located more closely to the center.
- The soundstage of these speakers is awesome. Very deep when the recording calls for it. I felt the same way about the Kef R3 I reviewed. And, sure, I know some will say this is “expectation bias” but if you’ve met me you know that I forget things pretty quickly so you’ll believe me when I say it wasn’t until I was a few tracks in where I remembered testing the Kef R3 and noting the same thing about the soundstage depth. The Kef R3 and the Kali IN-5 are both coaxial (concentric in the case of Kef).
- Soundstage width was outside the speakers but not immensely so. Listening to speakers in the nearfield, I have found, tends to have that effect because you no longer get the benefit of sidewall bounce (unless you are listening in a smaller room).
- There is zero mechanical noise from these speakers (pops, over-excursion, vent noise) even at higher volumes. However, these are intended to be used as nearfield monitors in the 1-2 meter range. Going past this will naturally mean you’ll need more volume and if you are listening at absurd levels you will certainly run in to the built-in limiter throttling the output as I showed in my linearity test.
- When listening, I noticed the HF tends to sound brighter the closer I was to the speaker. In the above in-room measurements you can see there is a gain of about 2dB when moving from 2.5 meters to 1.5 meters listening distance, so keep this in mind.
- Hiss: When sitting in the nearfield, approximately 1 meter away, I didn’t experience any issues with noise floor in my living room. When I put my ear next to the speakers, I notice the noise floor. But, in my opinion, this is a non-issue.
- Heat. I recently tested the Focal Twin6 Be and noticed that if the speaker was left on for a while - maybe an hour or so - the amplifier would get quite hot. Not scalding. But definitely warm to the touch. Leaving the IN-5 speakers on for hours at a time resulted in no heat at the amp. Not sure how important this is to you but I thought I’d mention it.
As stated in the Foreword, this written review is purposely a cliff’s notes version. For more details about the performance (objectively and subjectively) please watch the YouTube video.
Support the Cause
If you like what you see here and want to help support the cause you might be interested in joining my Patreon, here. You can also contribute via PayPal (the big yellow button below).
Your support helps me pay for new items to test, hardware, miscellaneous items and costs of the site’s server space and bandwidth. All of which I otherwise pay out of pocket. So, if you can help chip in a few bucks, know that it is very much appreciated.
Alternatively, if you are interested in purchasing these speakers, please consider using my B&H Photo Video affiliate link below. It yields me a small commission at no additional cost to you and allows me to keep doing what I am doing.
You can also join my Facebook and YouTube pages if you would like to follow along with updates.