Foreword / YouTube Video Review
The review on this website is a brief overview and summary of the objective performance of this speaker. It is not intended to be a deep dive. Moreso, this is information for those who prefer “just the facts” and prefer to have the data without the filler.
However, for those who want more - a detailed explanation of the objective performance, and my subjective evaluation (what I heard, what I liked, etc.) - please watch the below video where I go more in-depth.
Information and Photos
Note: JBL was kind enough to loan me this item for test. I was not paid for my review and was not told what to say.
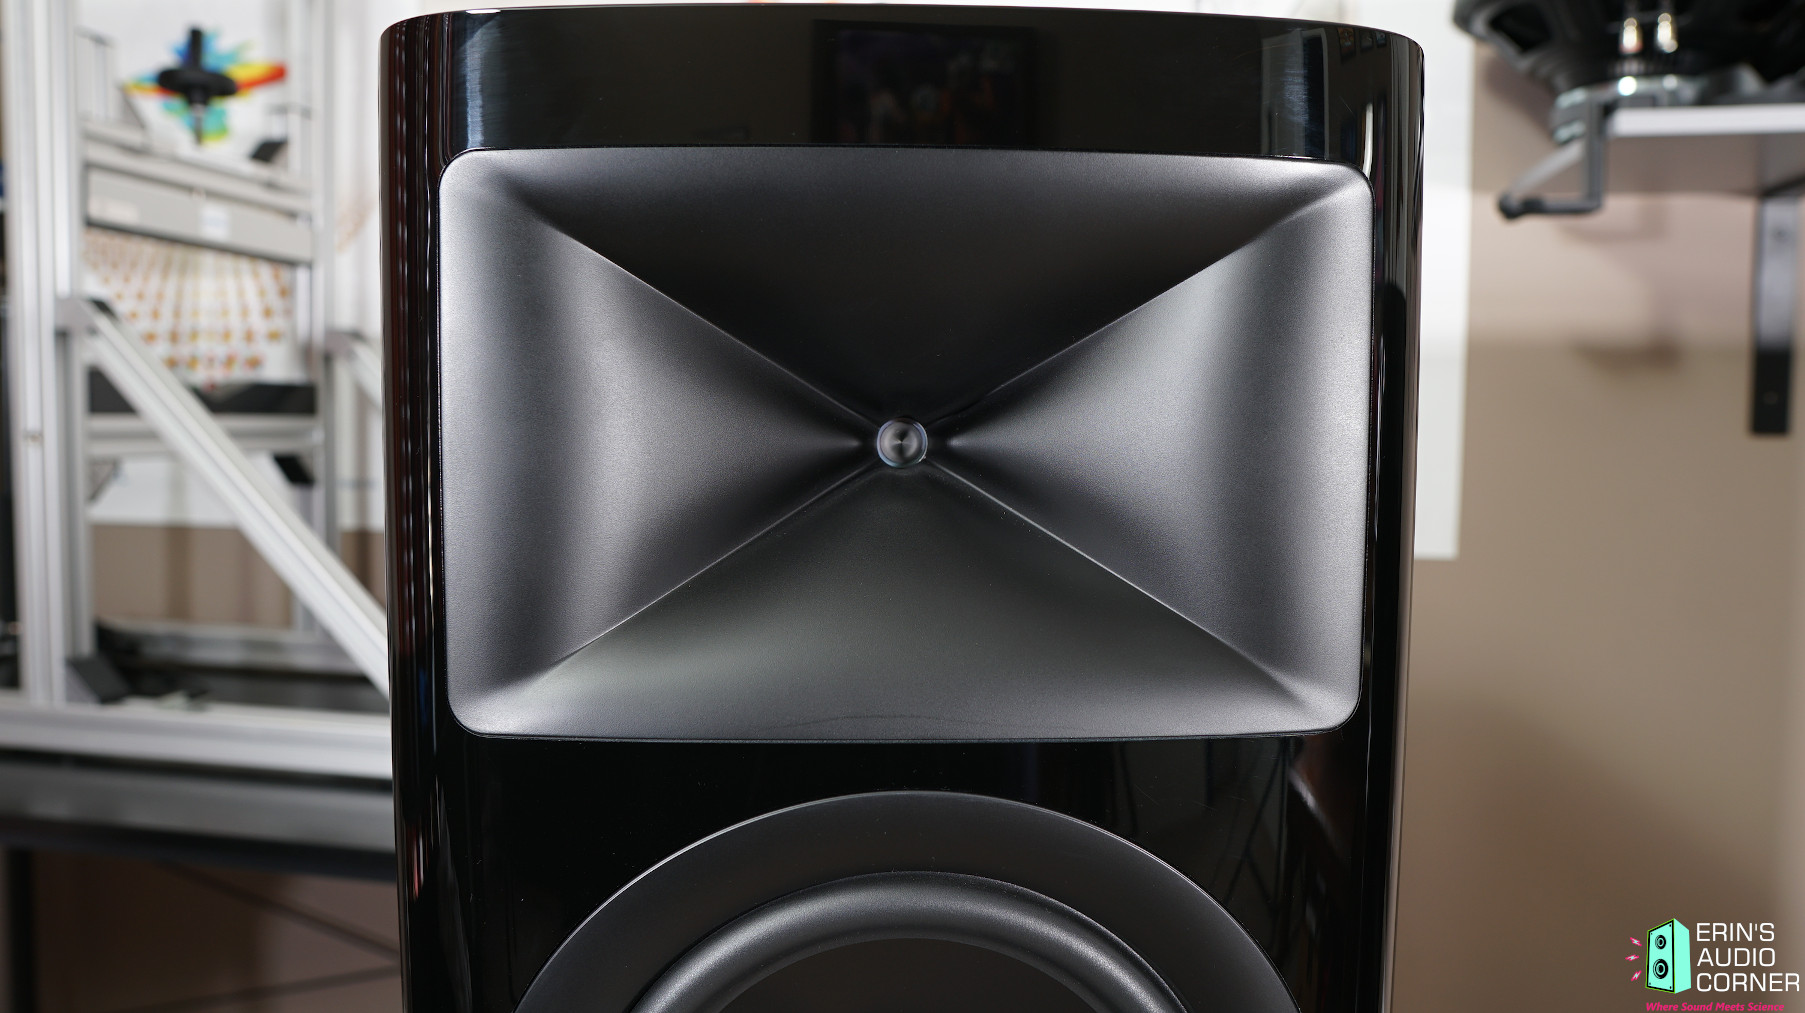
The JBL HDI-3800 is 2.5-way Floorstanding speaker, standing approximately 45-inches tall with serious output capability. The below is from the manufacturer’s website:
Designed and engineered in JBL’s world-famous acoustic engineering facility in Northridge, California, the HDI-3800 is the flagship of the JBL HDI Series. This floorstanding loudspeaker features a 2 ½-way design with patented High-Definition Imaging (HDI™) waveguide technology, the patented 2410H-2 1-inch (25mm) compression driver, and triple 8-inch (200mm) Advanced Aluminum Matrix cone woofers for powerful dynamics and incredibly accurate sound reproduction. The HDI-3800 enclosure is heavily braced to provide a solid acoustic foundation, and incorporates a bass reflex design with dual rear-firing, computer-optimized flared ports. The sophisticated curved cabinet features a modern design finished in a choice of automotive-grade painted High Gloss Black, or furniture-grade satin Walnut or Gray Oak wood veneers. A black cloth, magnetically attached grille completes the elegant appearance.
MSRP per pair is approximately $5000 USD.
And here are some specs, again from the manufacturer’s website:
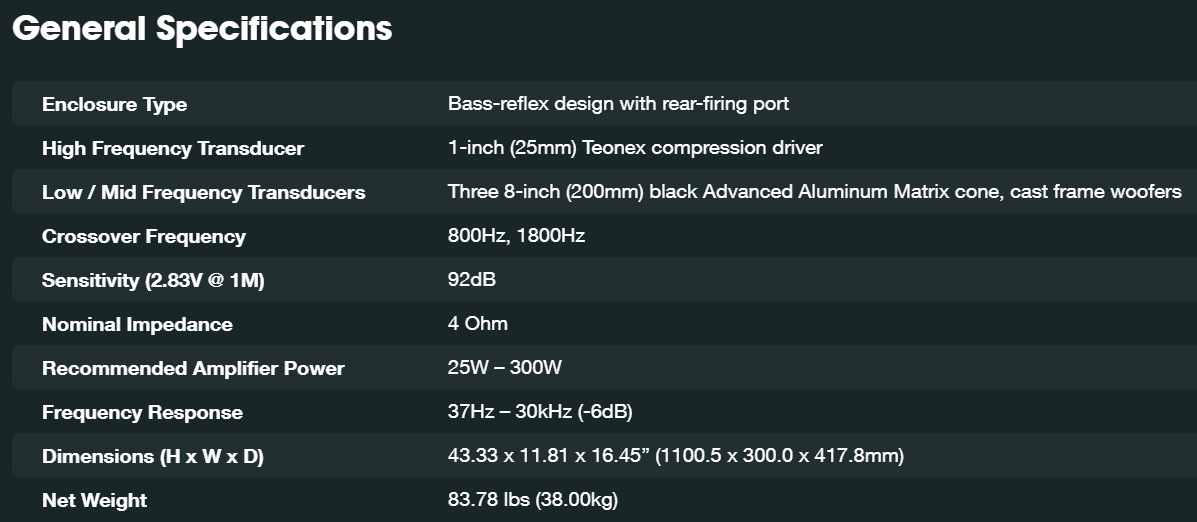


CTA-2034 (SPINORAMA) and Accompanying Data
All data collected using Klippel’s Near-Field Scanner. The Near-Field-Scanner 3D (NFS) offers a fully automated acoustic measurement of direct sound radiated from the source under test. The radiated sound is determined in any desired distance and angle in the 3D space outside the scanning surface. Directivity, sound power, SPL response and many more key figures are obtained for any kind of loudspeaker and audio system in near field applications (e.g. studio monitors, mobile devices) as well as far field applications (e.g. professional audio systems). Utilizing a minimum of measurement points, a comprehensive data set is generated containing the loudspeaker’s high resolution, free field sound radiation in the near and far field. For a detailed explanation of how the NFS works and the science behind it, please watch the below discussion with designer Christian Bellmann:
The reference plane in this test is at the tweeter. The speaker was tested in ported configuration (the port was not sealed). All testing in this review was done without grille. *Note: For low-frequency measurements see the appropriate section further down.
Measurements are provided in a format in accordance with the Standard Method of Measurement for In-Home Loudspeakers (ANSI/CTA-2034-A R-2020). For more information, please see this link.
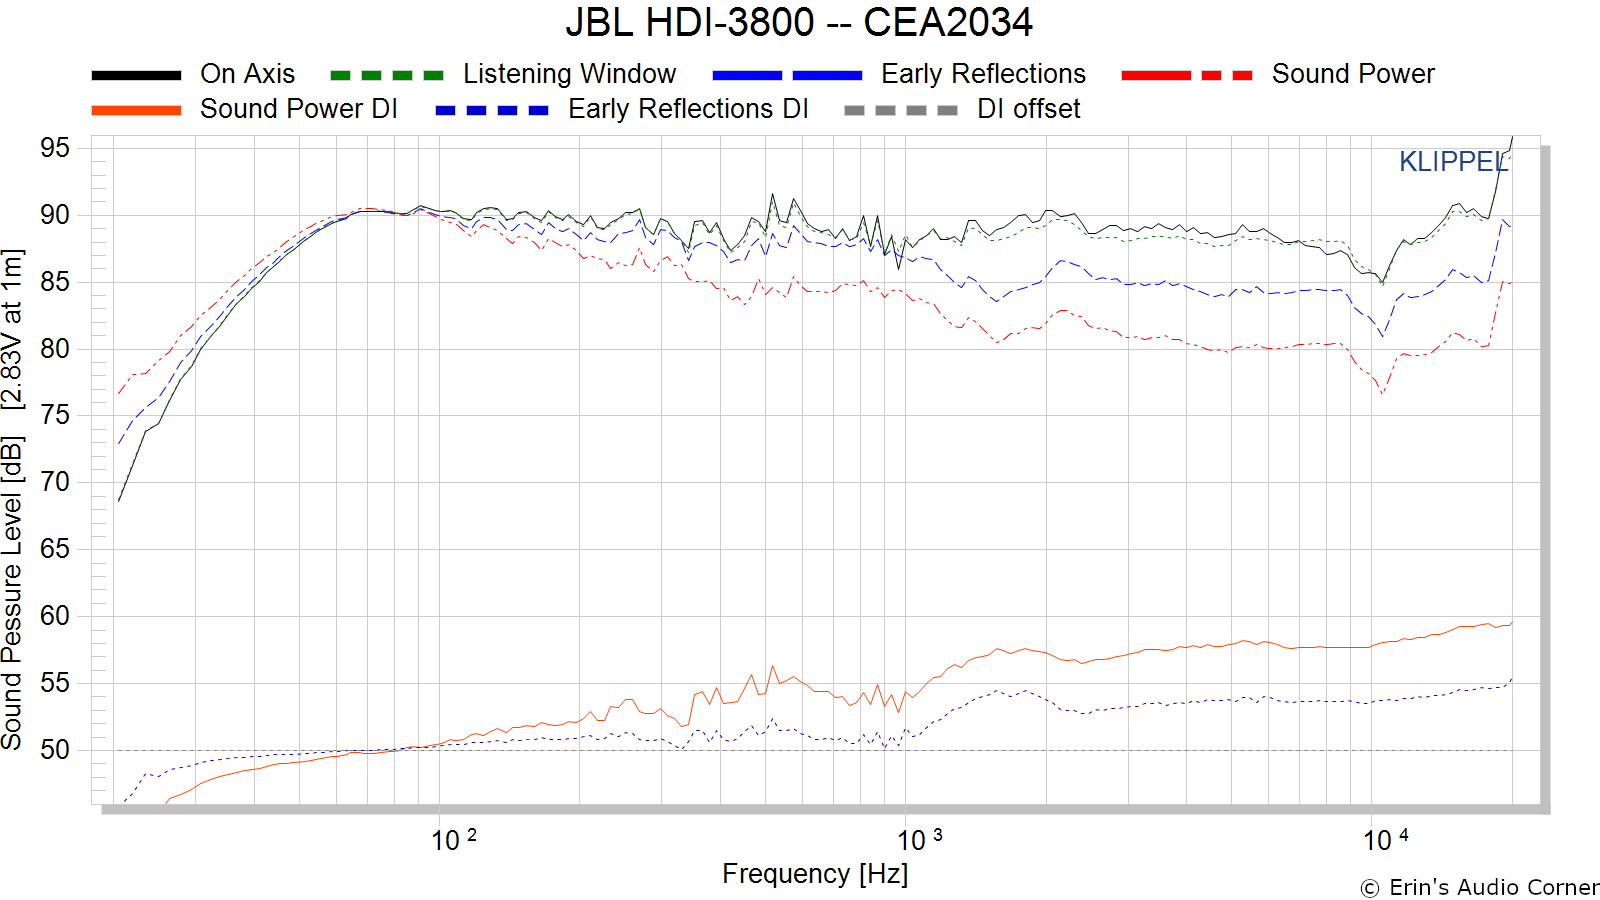
CTA-2034 / SPINORAMA:
The On-axis Frequency Response (0°) is the universal starting point and in many situations it is a fair representation of the first sound to arrive at a listener’s ears.
The Listening Window is a spatial average of the nine amplitude responses in the ±10º vertical and ±30º horizontal angular range. This encompasses those listeners who sit within a typical home theater audience, as well as those who disregard the normal rules when listening alone.
The Early Reflections curve is an estimate of all single-bounce, first-reflections, in a typical listening room.
Sound Power represents all of the sounds arriving at the listening position after any number of reflections from any direction. It is the weighted rms average of all 70 measurements, with individual measurements weighted according to the portion of the spherical surface that they represent.
Sound Power Directivity Index (SPDI): In this standard the SPDI is defined as the difference between the listening window curve and the sound power curve.
Early Reflections Directivity Index (EPDI): is defined as the difference between the listening window curve and the early reflections curve. In small rooms, early reflections figure prominently in what is measured and heard in the room so this curve may provide insights into potential sound quality.
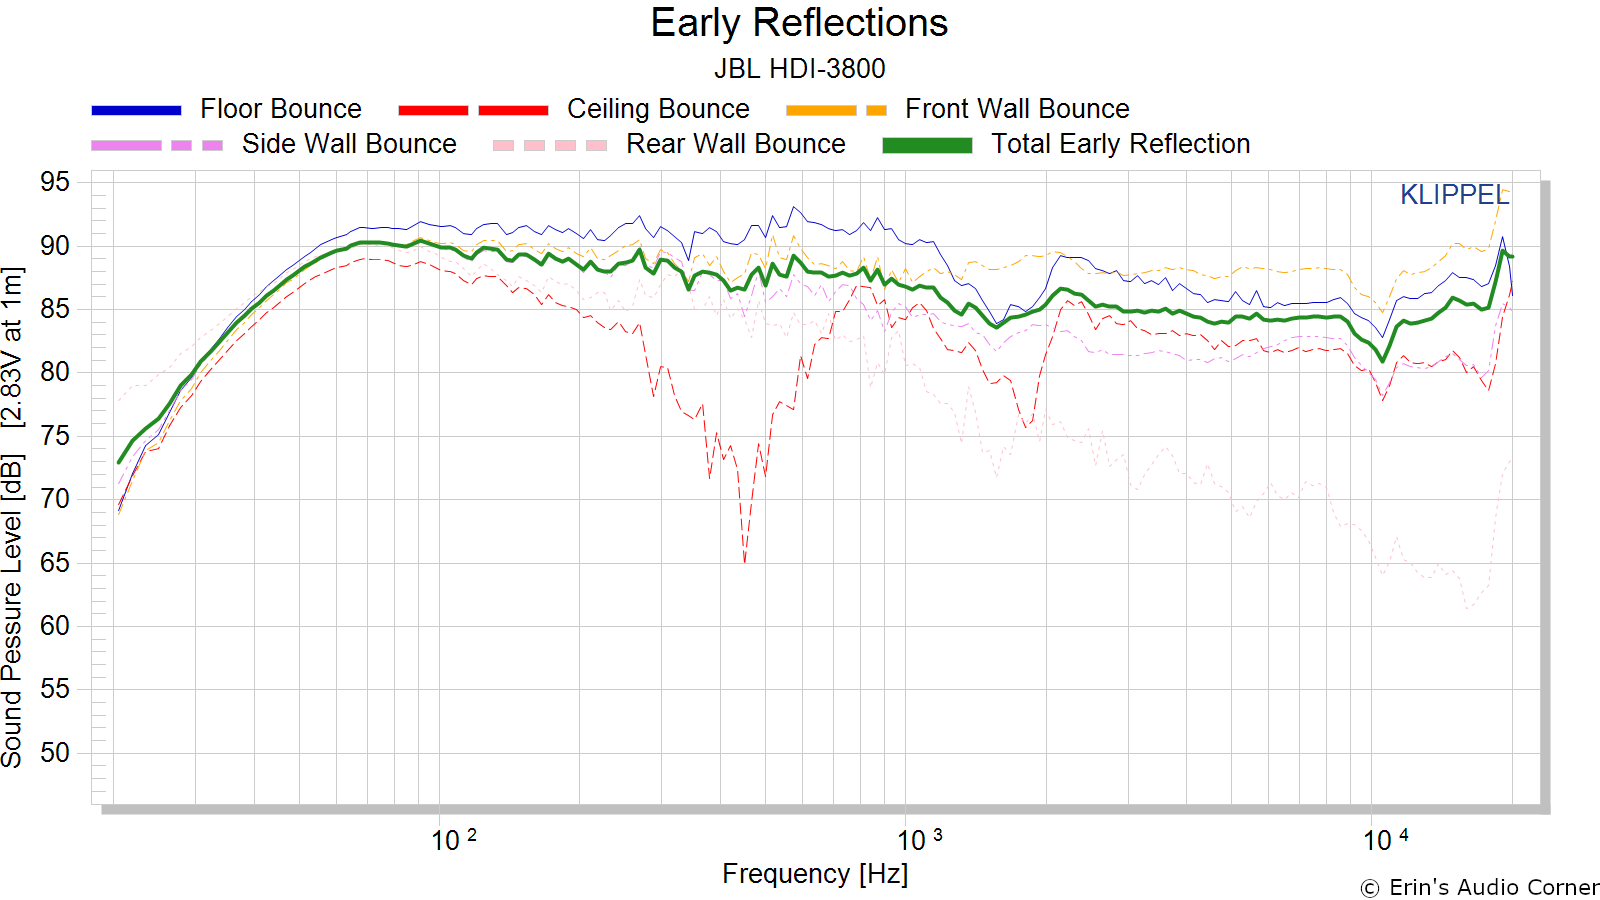
Early Reflections Breakout:
Floor bounce: average of 20º, 30º, 40º down
Ceiling bounce: average of 40º, 50º, 60º up
Front wall bounce: average of 0º, ± 10º, ± 20º, ± 30º horizontal
Side wall bounces: average of ± 40º, ± 50º, ± 60º, ± 70º, ± 80º horizontal
Rear wall bounces: average of 180º, ± 90º horizontal
Estimated In-Room Response:
In theory, with complete 360-degree anechoic data on a loudspeaker and sufficient acoustical and geometrical data on the listening room and its layout it would be possible to estimate with good precision what would be measured by an omnidirectional microphone located in the listening area of that room. By making some simplifying assumptions about the listening space, the data set described above permits a usefully accurate preview of how a given loudspeaker might perform in a typical domestic listening room. Obviously, there are no guarantees because individual rooms can be acoustically aberrant. Sometimes rooms are excessively reflective (“live”) as happens in certain hot, humid climates, with certain styles of interior décor and in under-furnished rooms. Sometimes rooms are excessively “dead” as in other styles of décor and in some custom home theaters where acoustical treatment has been used excessively. This form of post processing is offered only as an estimate of what might happen in a domestic living space with carpet on the floor and a “normal” amount of seating, drapes, and cabinetry.
For these limited circumstances it has been found that a usefully accurate Predicted In-Room (PIR) amplitude response, also known as a “room curve” is obtained by a weighted average consisting of 12 % listening window, 44 % early reflections and 44 % sound power. At very high frequencies errors can creep in because of excessive absorption, microphone directivity, and room geometry. These discrepancies are not considered to be of great importance.

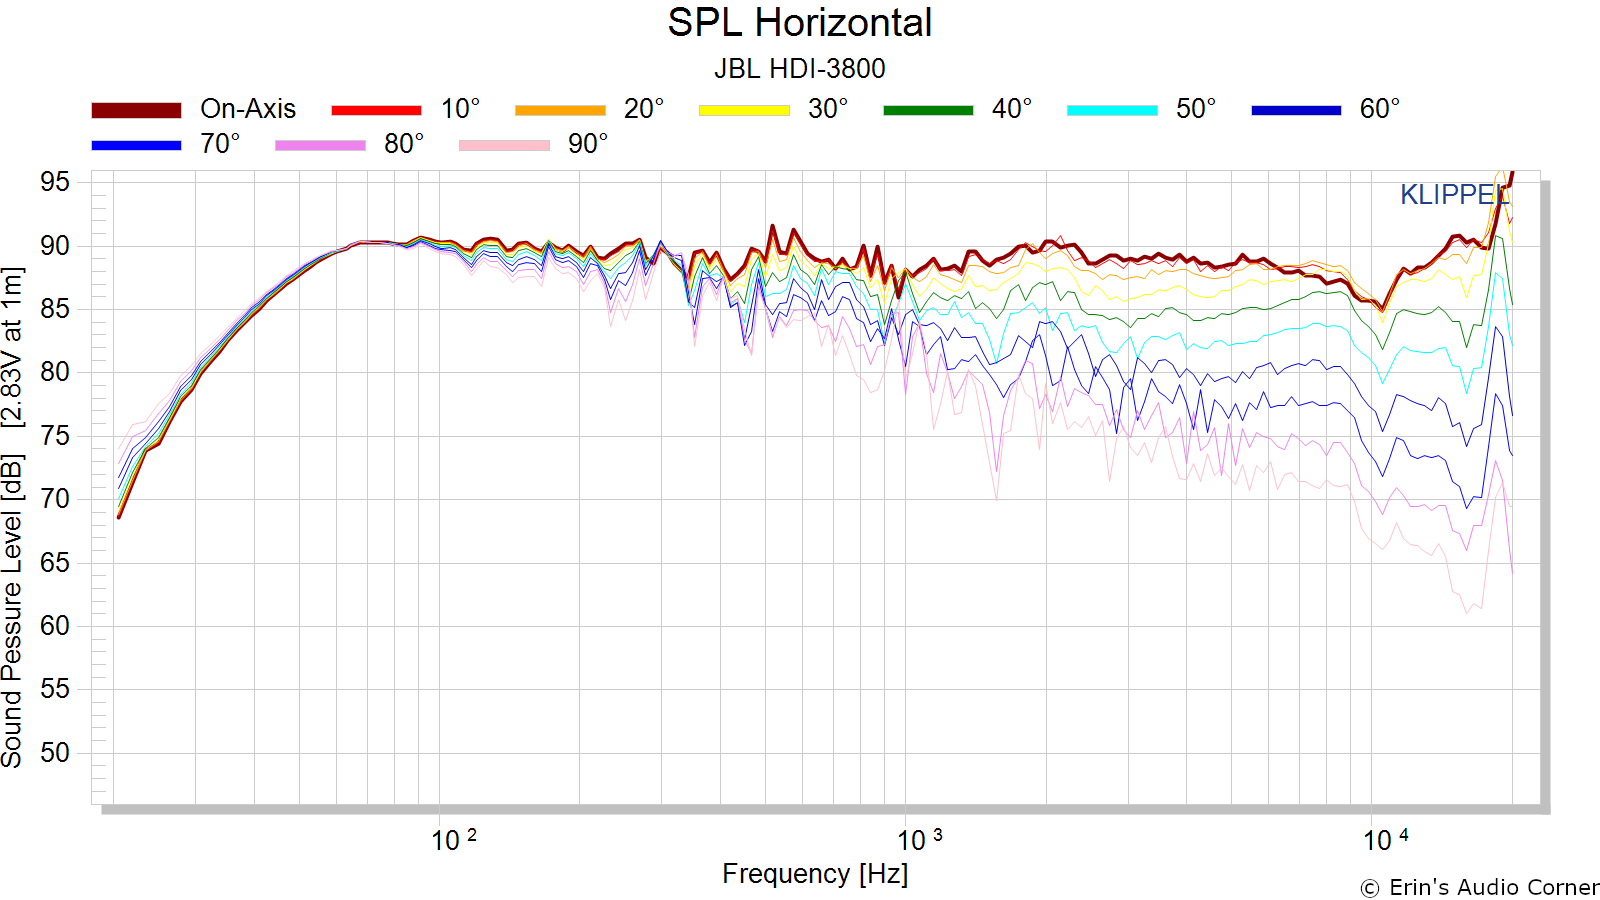
Horizontal Frequency Response (0° to ±90°):
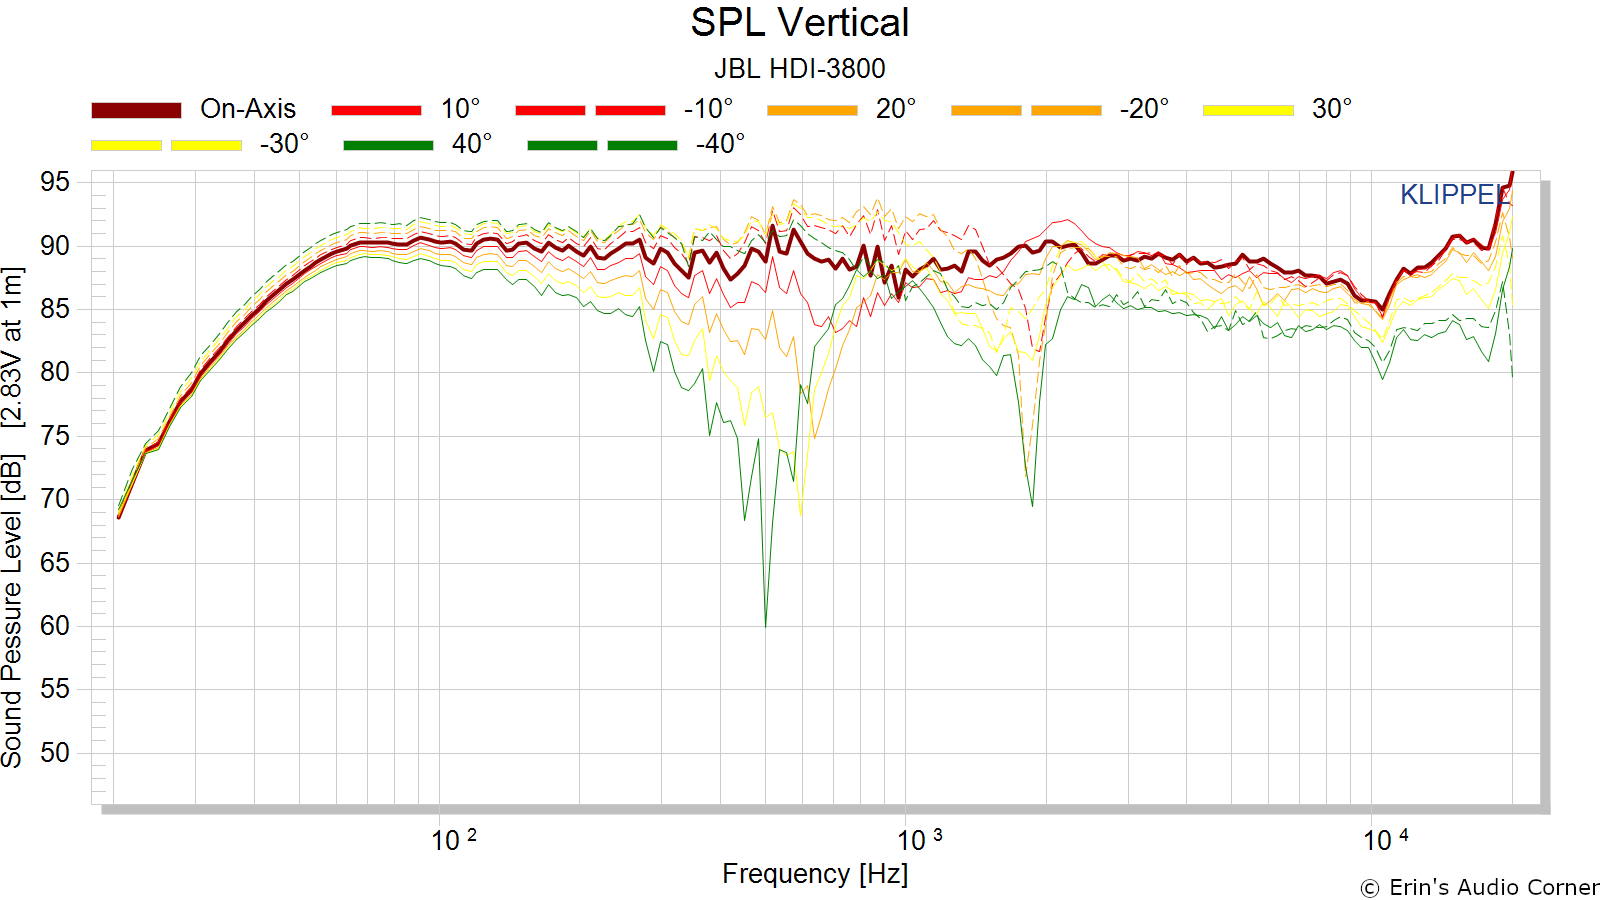
Vertical Frequency Response (0° to ±40°):
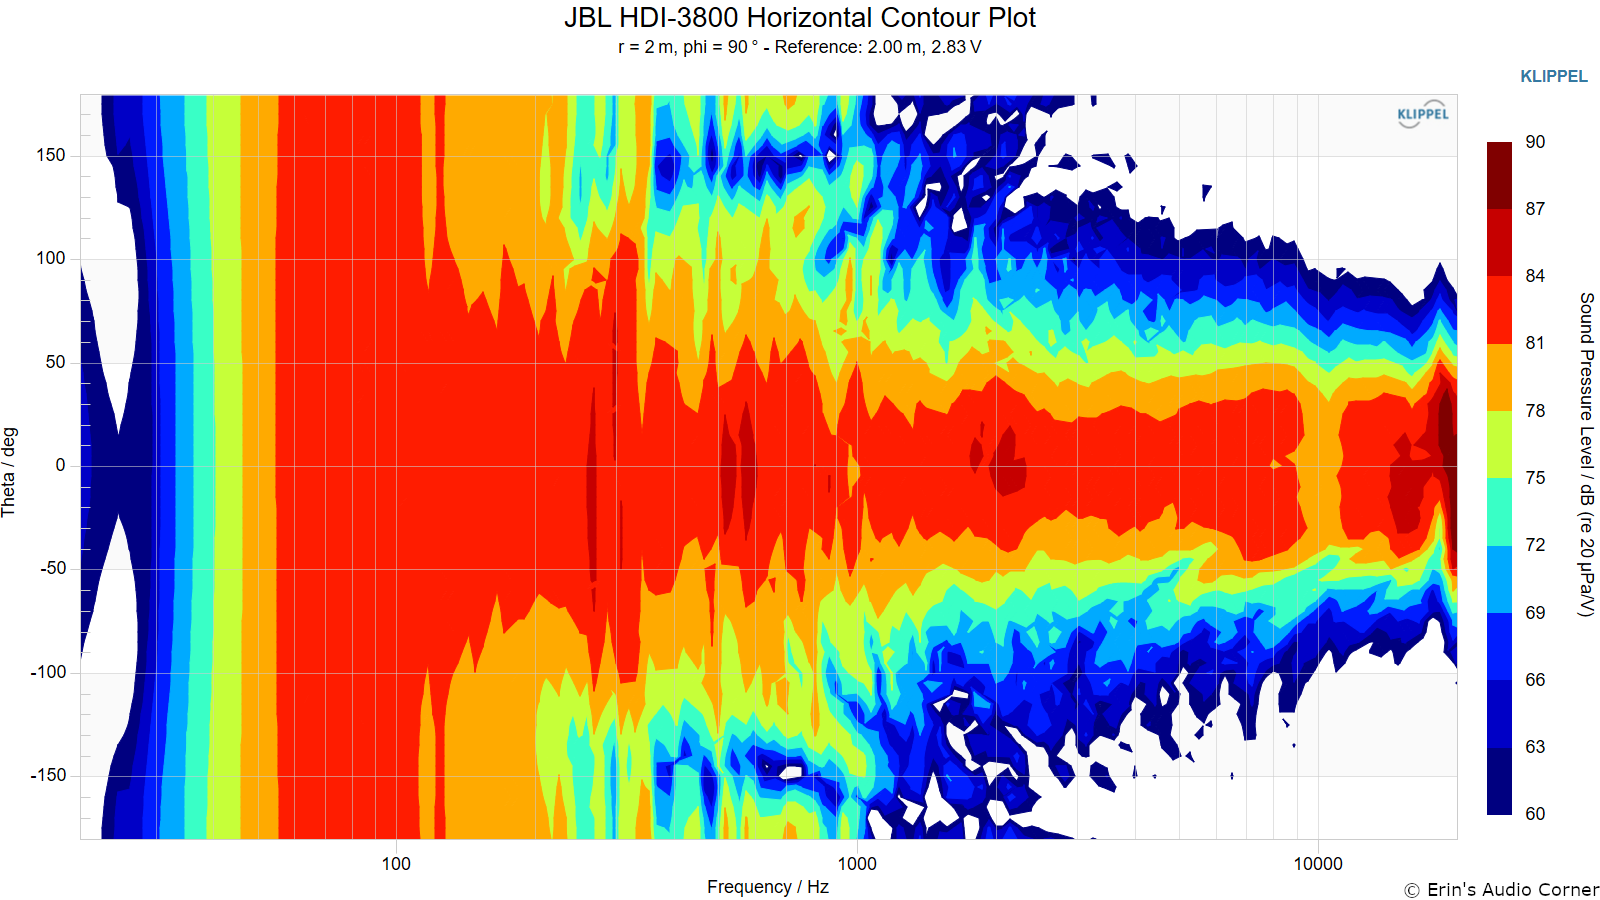
Horizontal Contour Plot (not normalized):
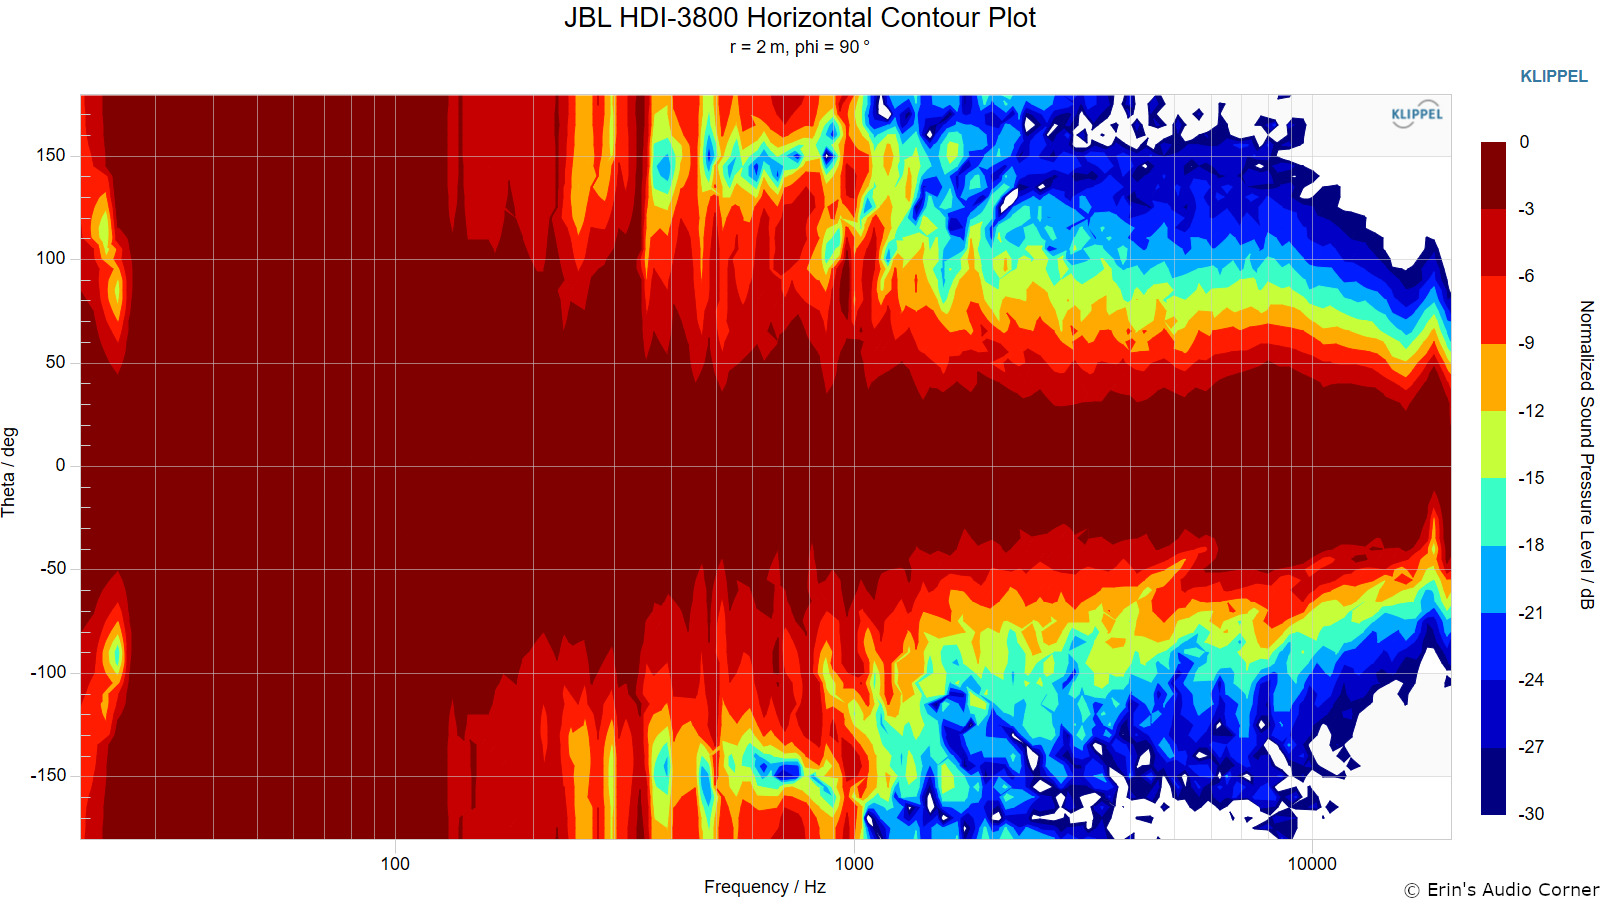
Horizontal Contour Plot (normalized):
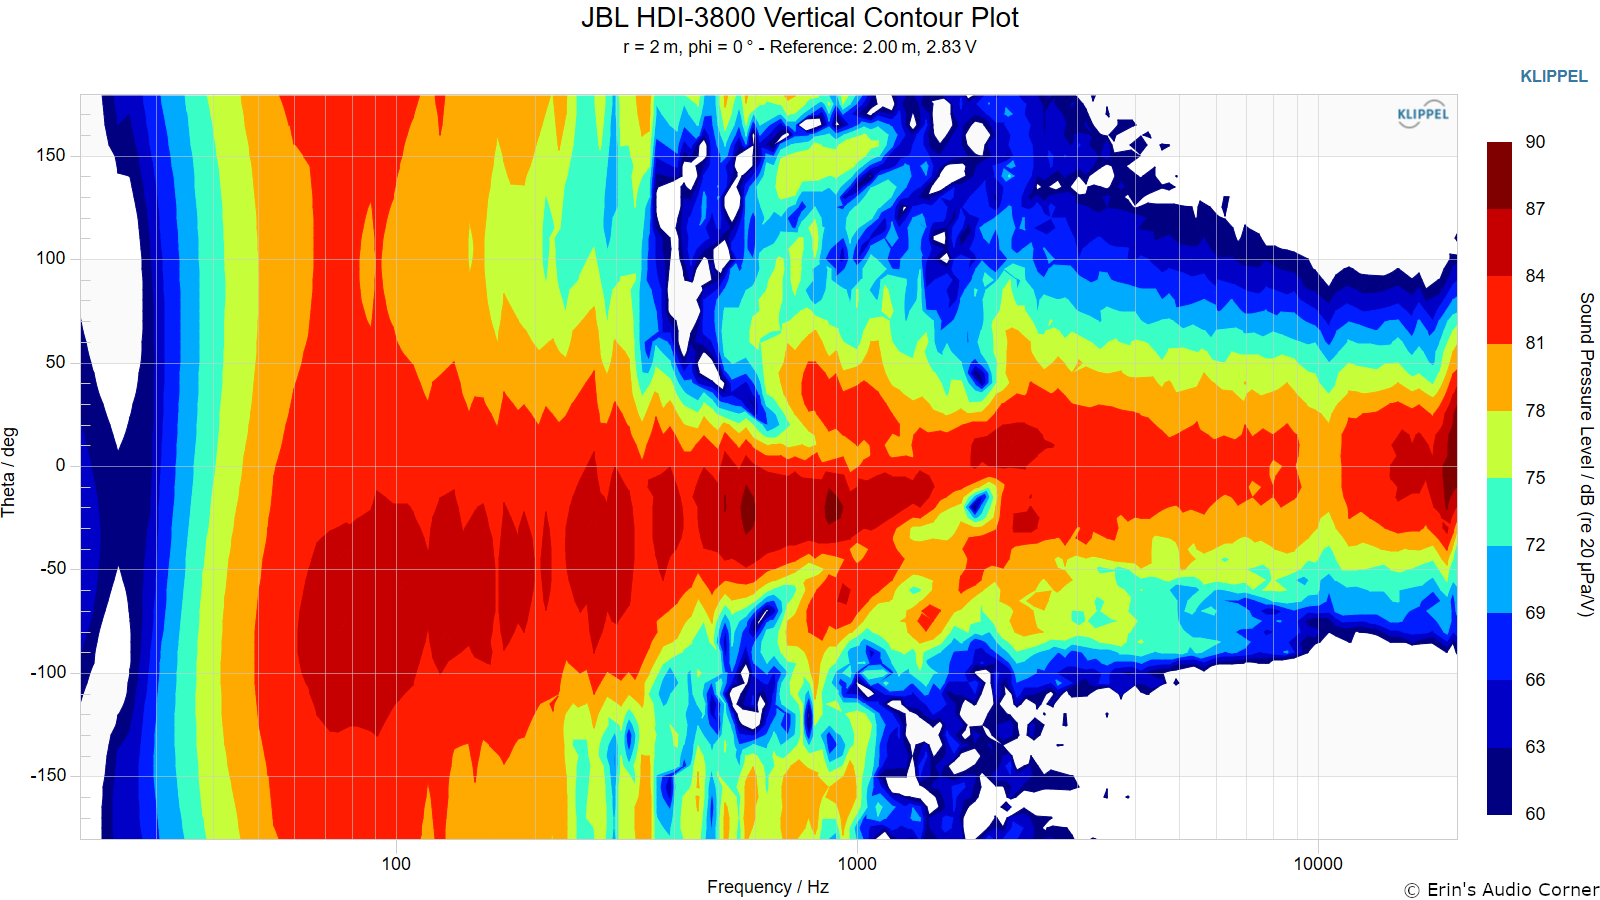
Vertical Contour Plot (not normalized):
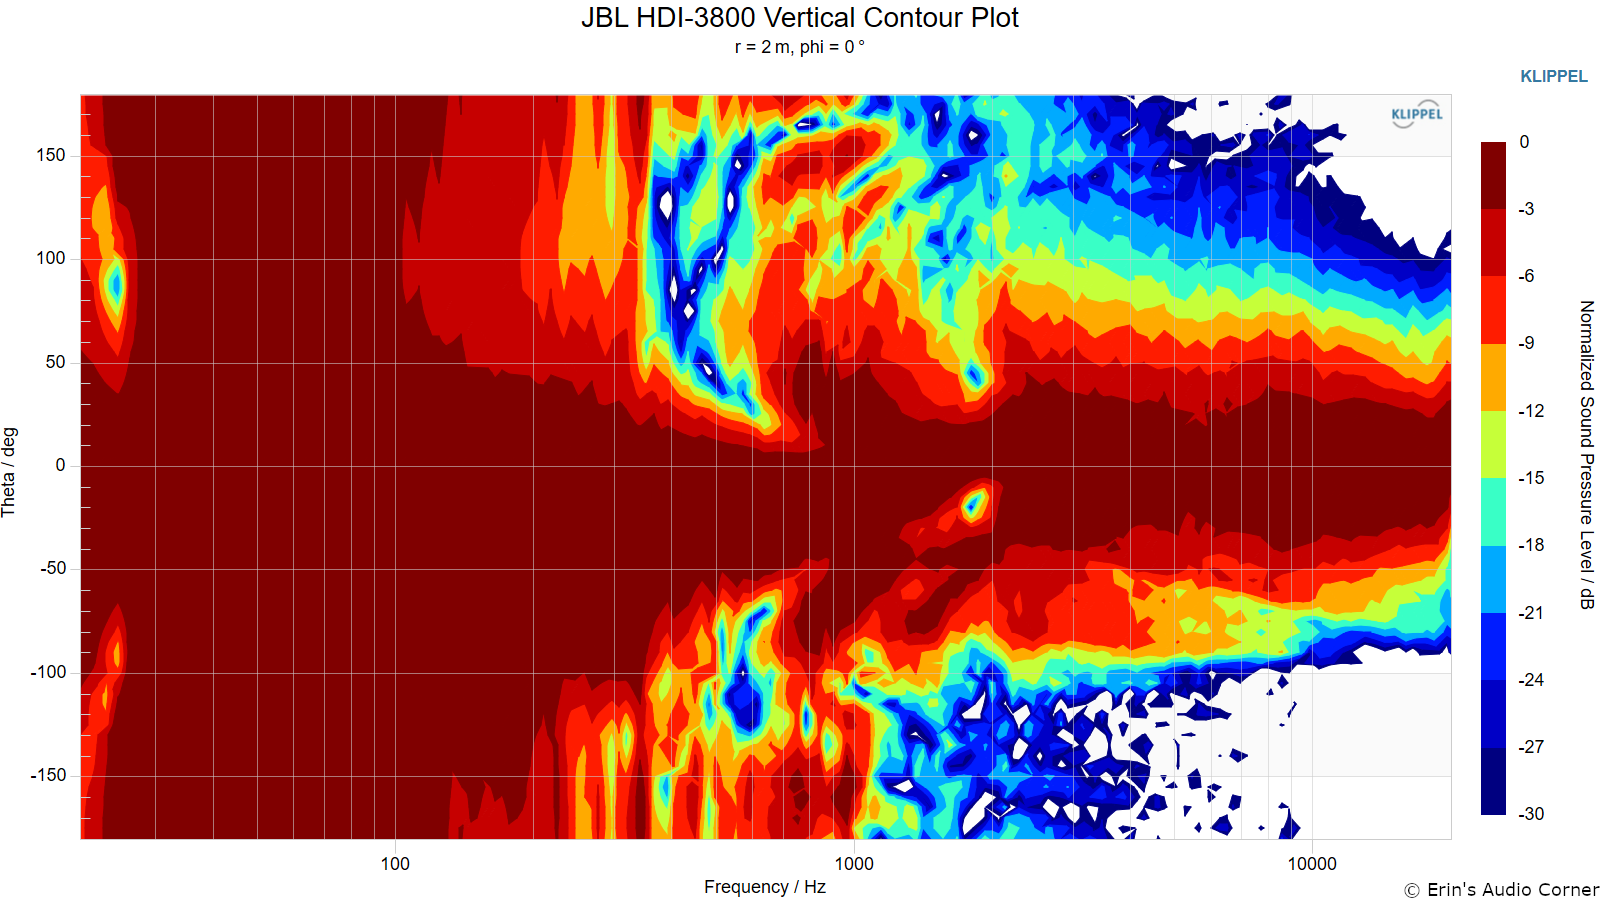
Vertical Contour Plot (normalized):
Additional Measurements
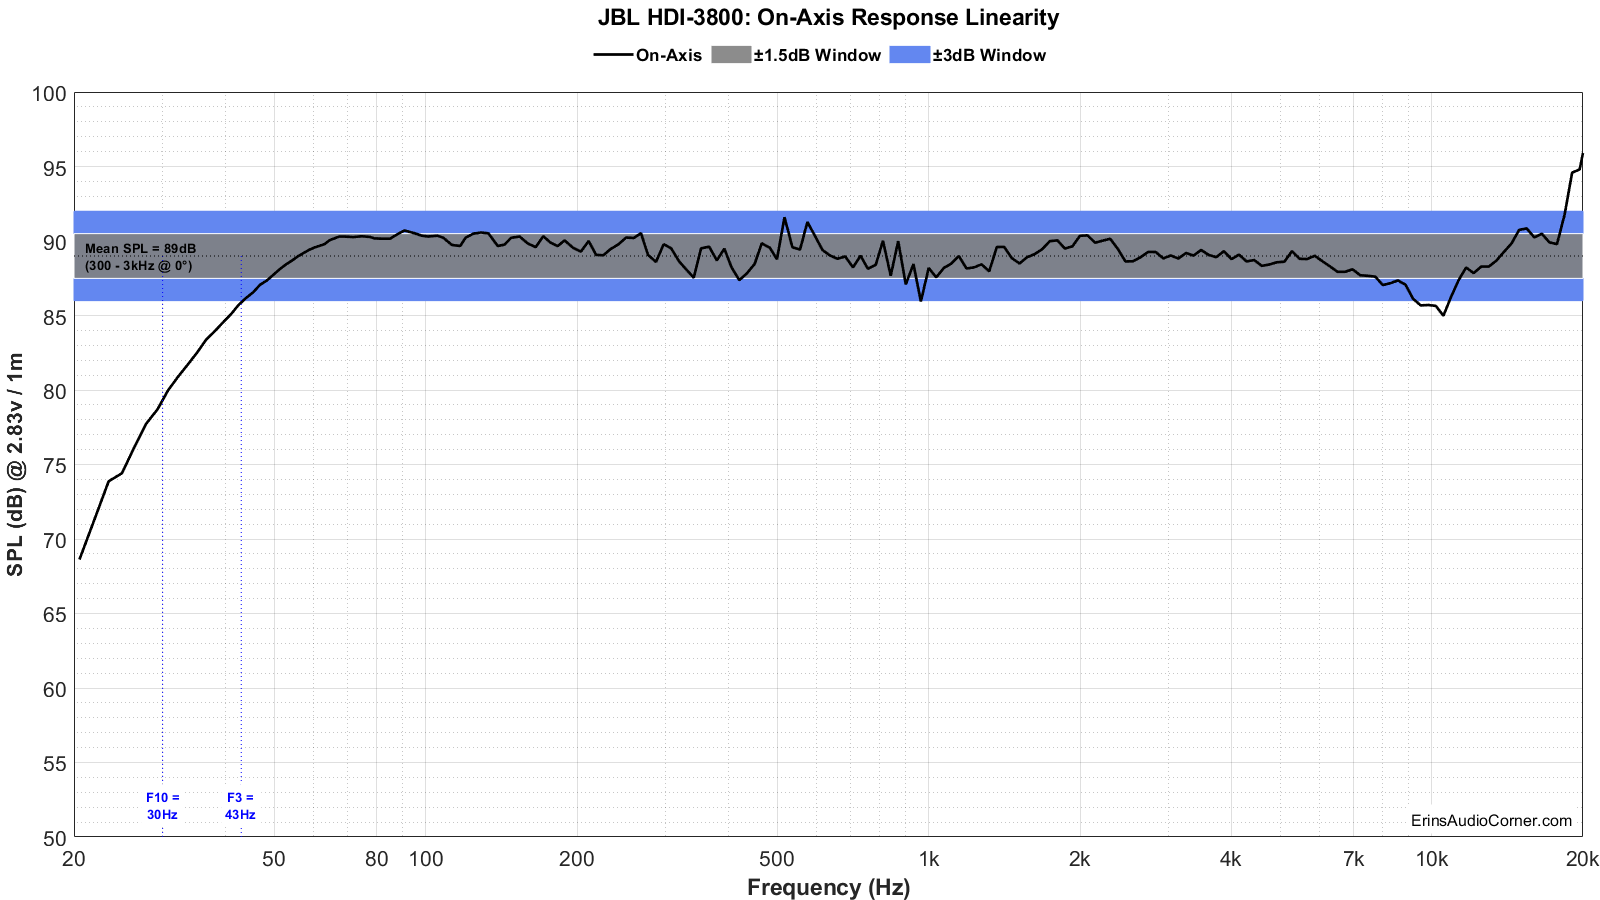
On-Axis Response Linearity
The mean SPL on-axis is 88.99 dB (300Hz to 3kHz). Response linearity is -4.01/+2.60 dB (80Hz to 16kHz).
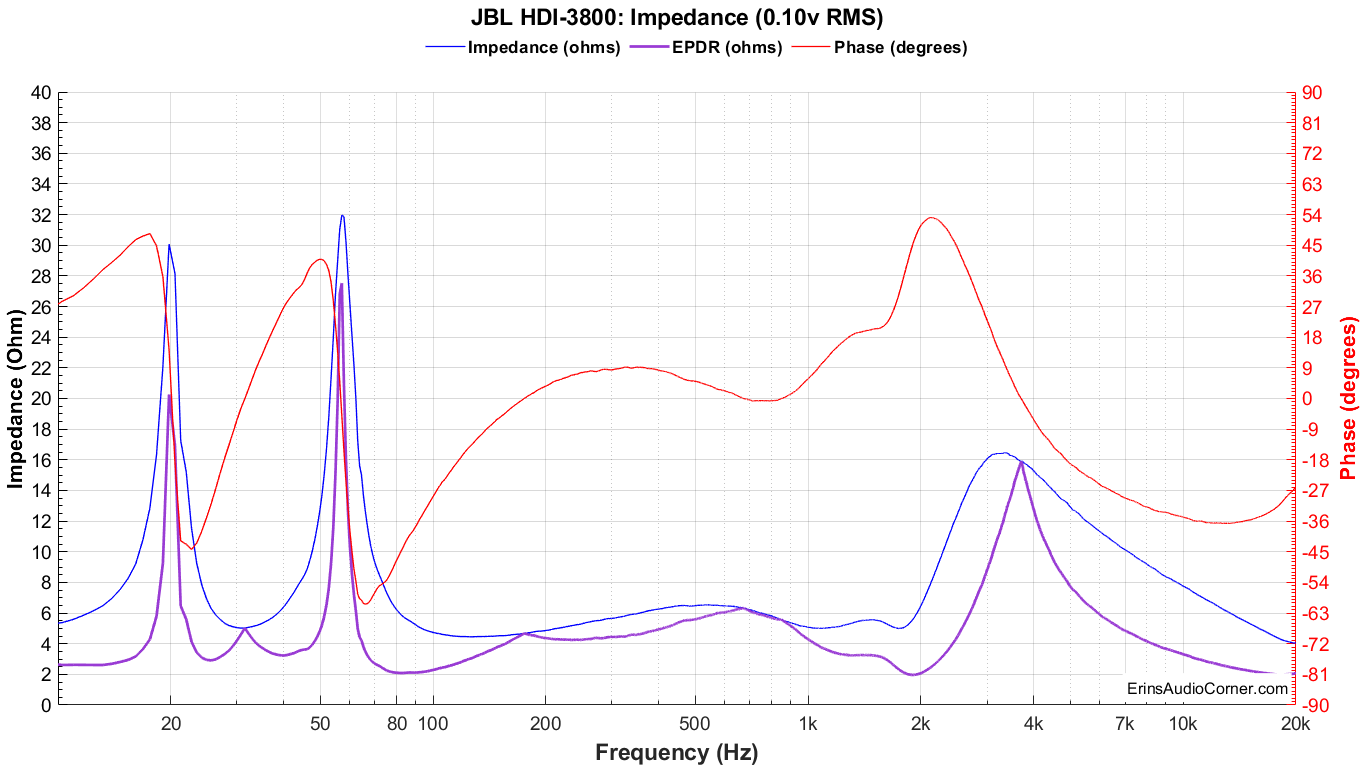
Impedance Magnitude and Phase + Equivalent Peak Dissipation Resistance (EPDR)
For those who do not know what EPDR is (ahem, myself until 2020), Keith Howard came up with this metric which he defined in a 2007 article for Stereophile as:
… simply the resistive load that would give rise to the same peak device dissipation as the speaker itself.
A note from Dr. Jack Oclee-Brown of Kef (who supplied the formula for calculating EPDR):
Just a note of caution that the EPDR derivation is based on a class-B output stage so it’s valid for typical class-AB amps but certainly not for class-A and probably has only marginal relevance for class-D amps (would love to hear from a class-D expert on this topic).
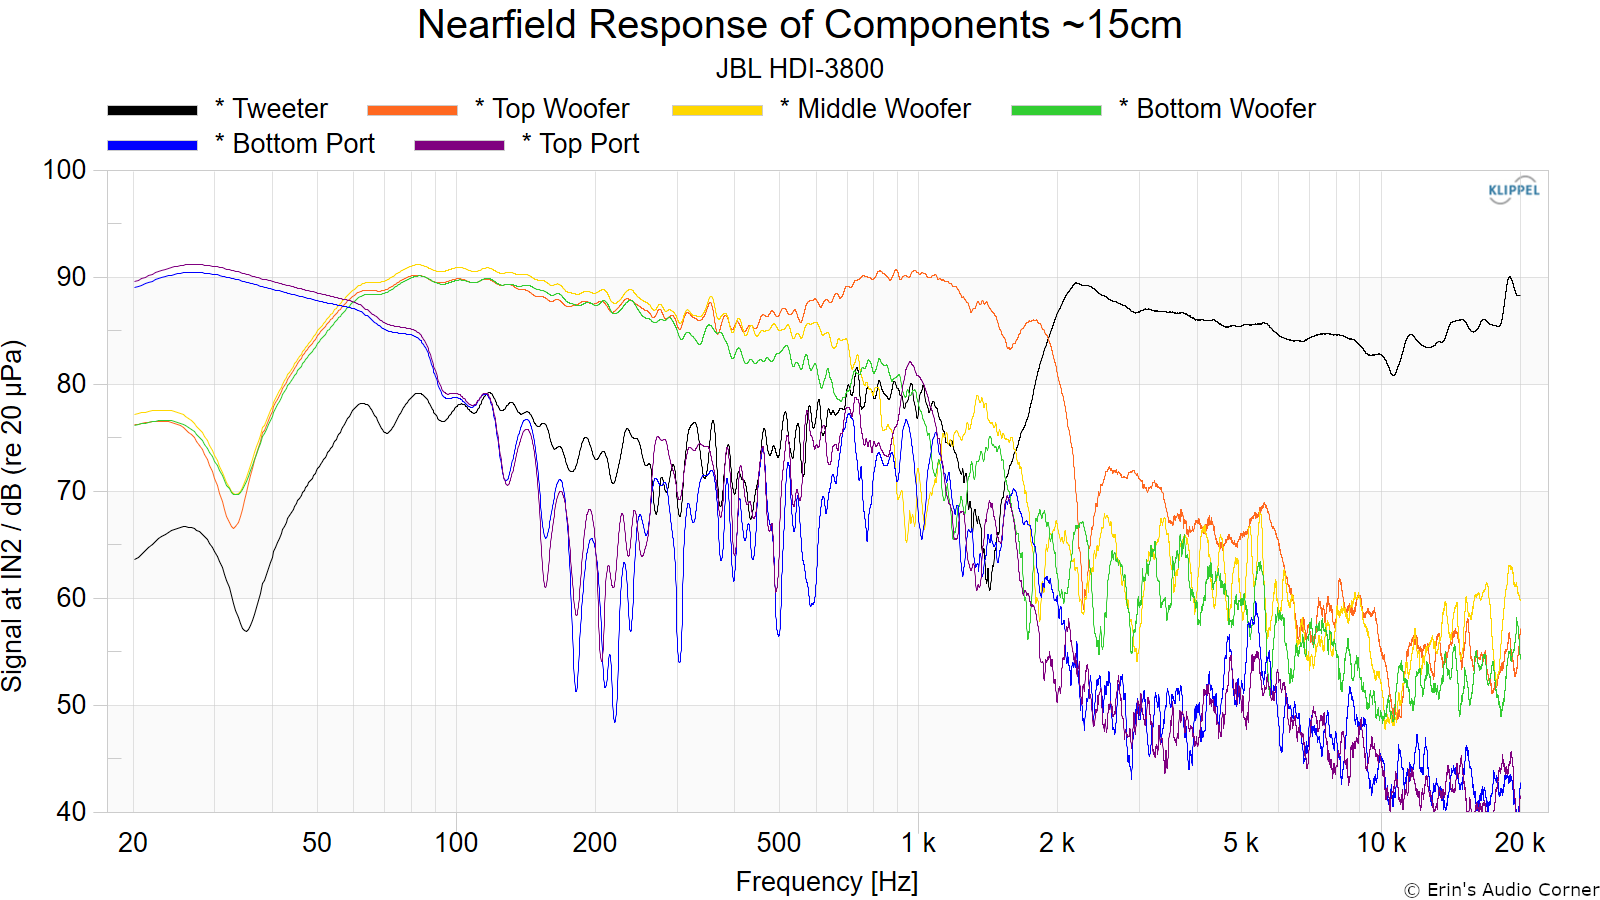
Near-Field Response
Nearfield response of individual drive units:
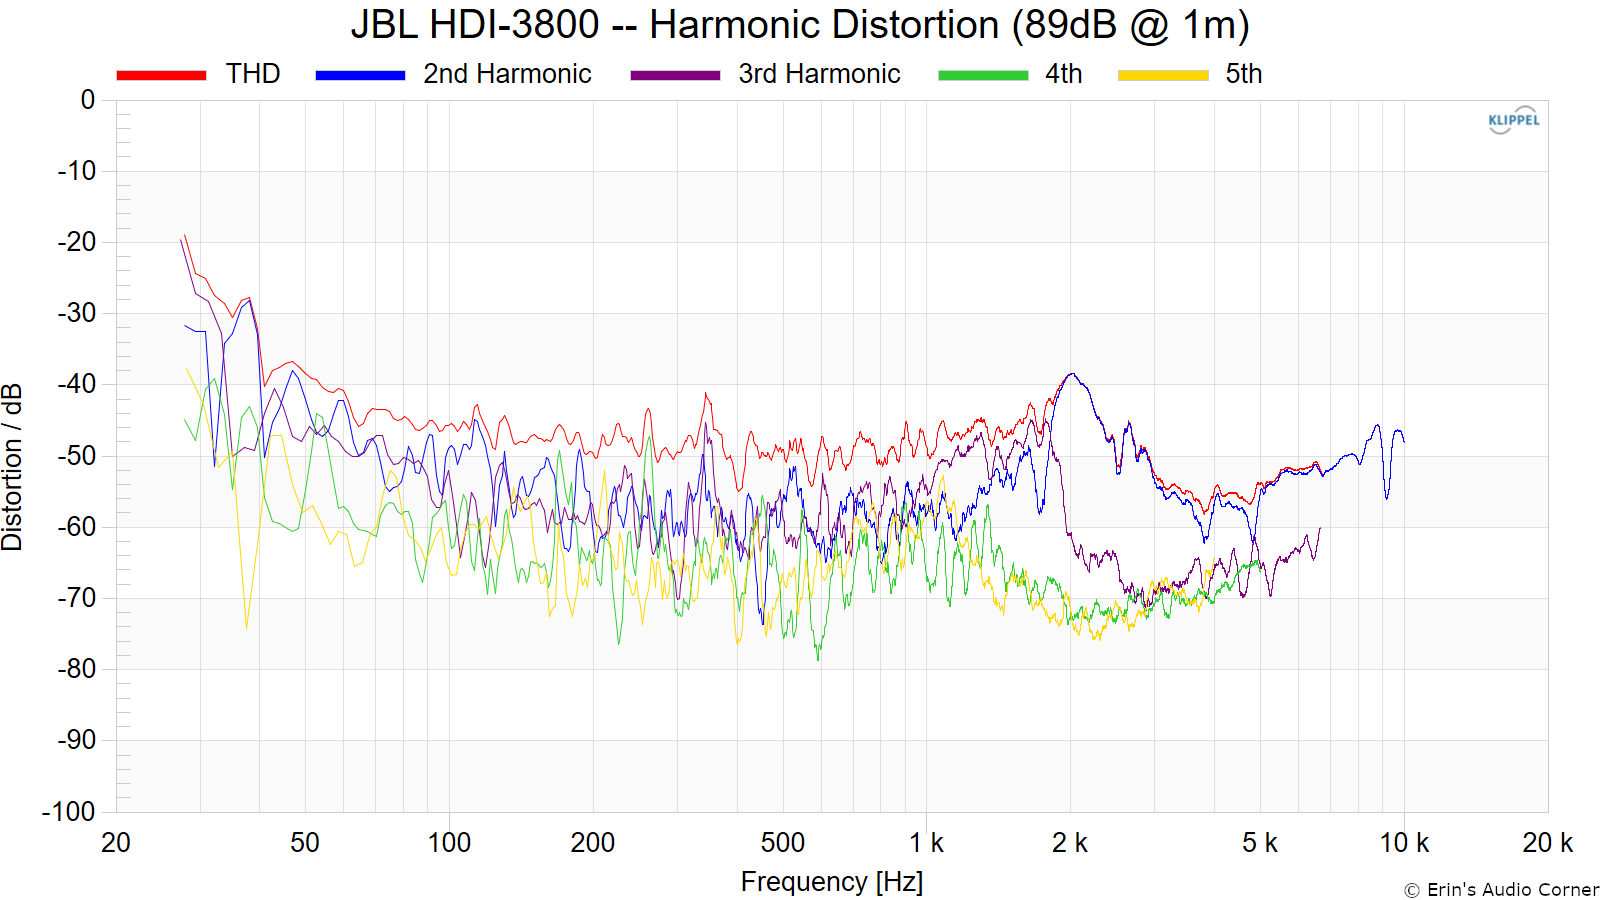
Harmonic Distortion
Harmonic Distortion at 89dB @ 1m:
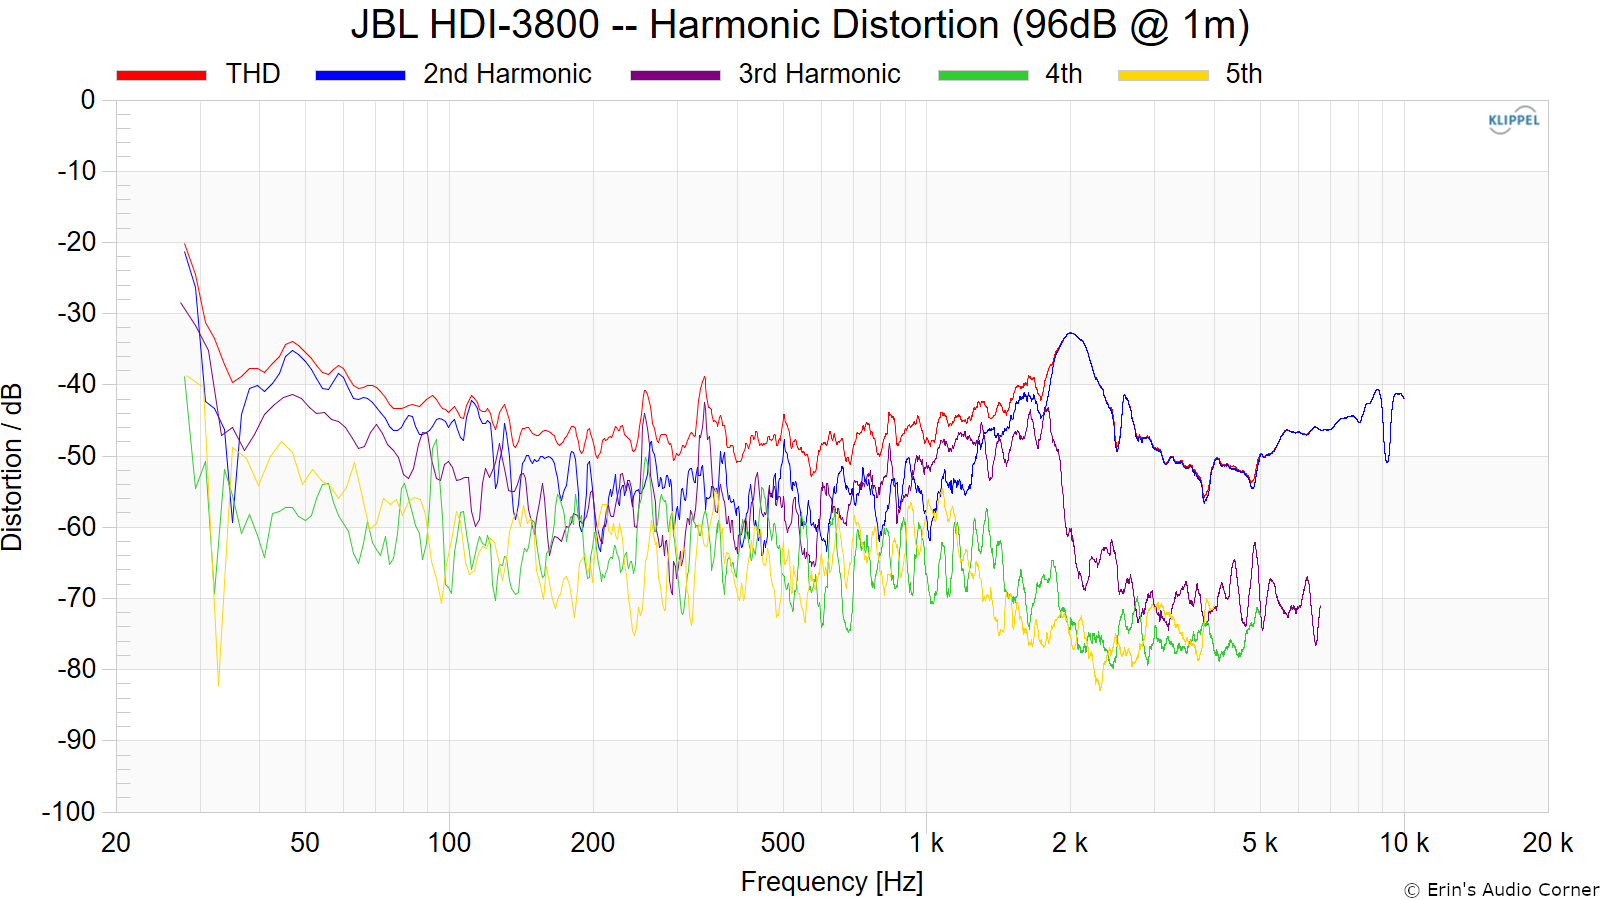
Harmonic Distortion at 96dB @ 1m:
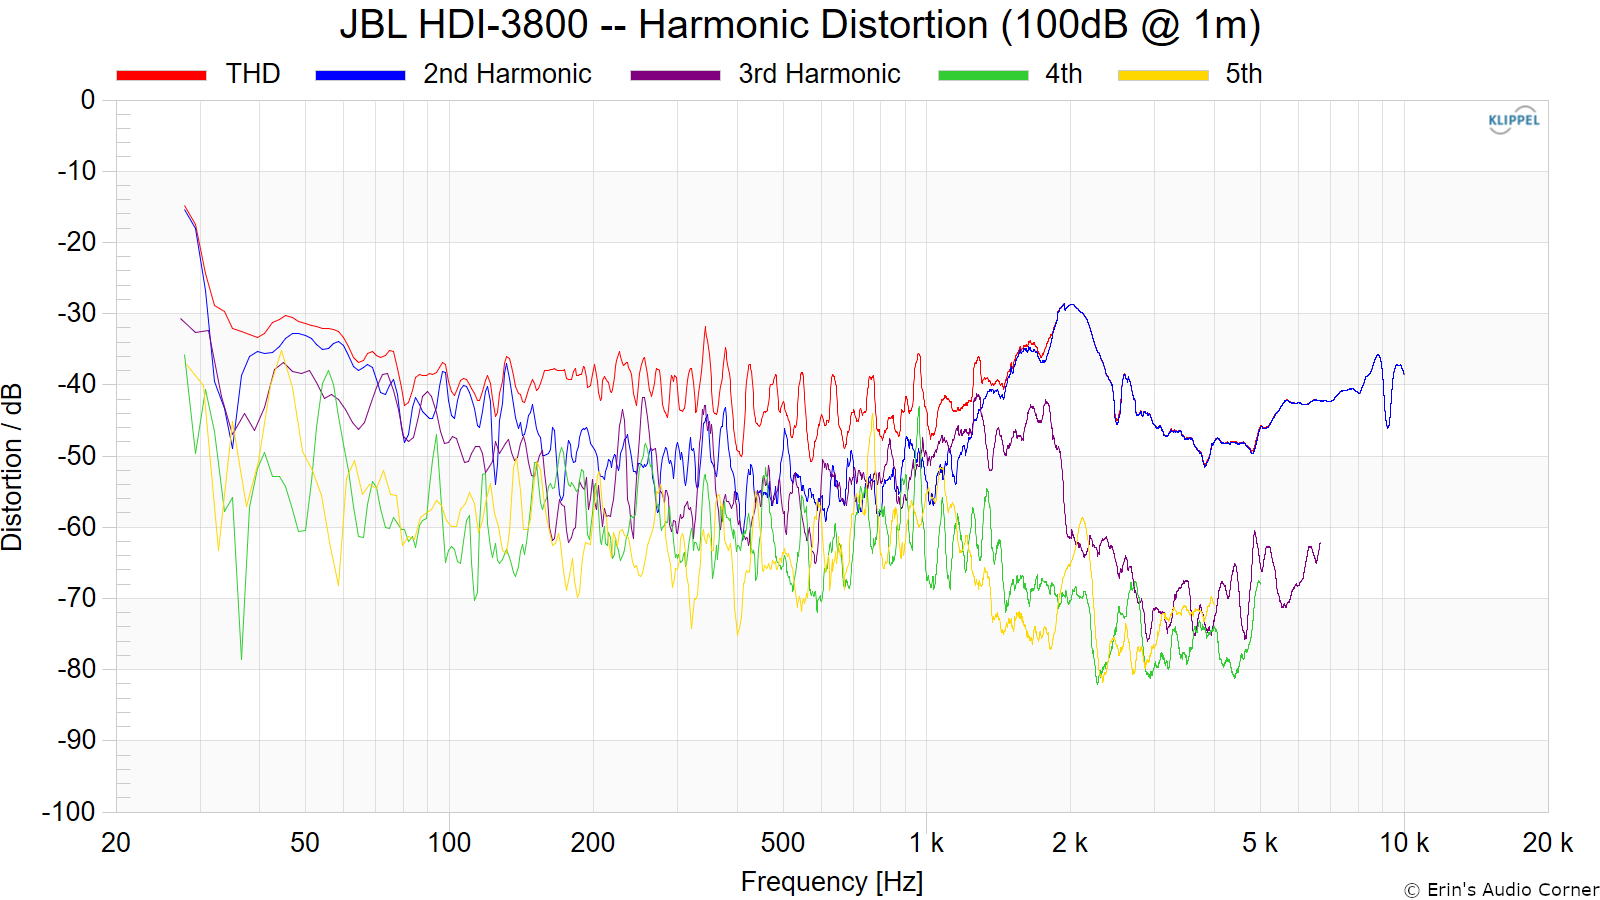
Harmonic Distortion at 100dB @ 1m:
“Globe” Plots
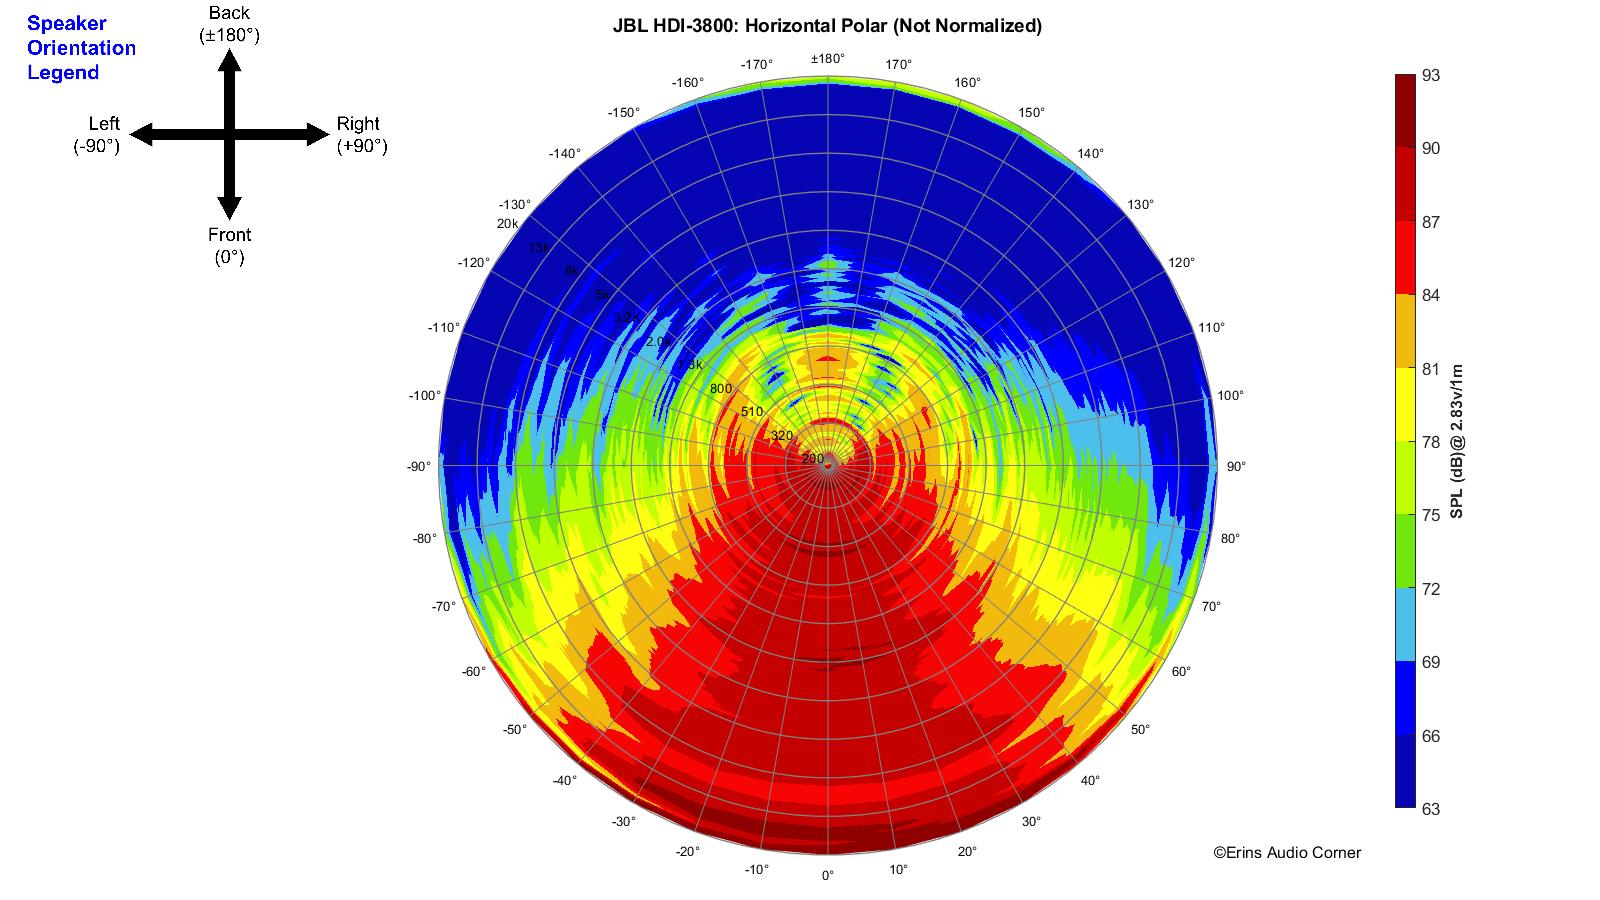
Horizontal Polar (Globe) Plot:
This represents the sound field at 2 meters - above 200Hz - per the legend in the upper left.
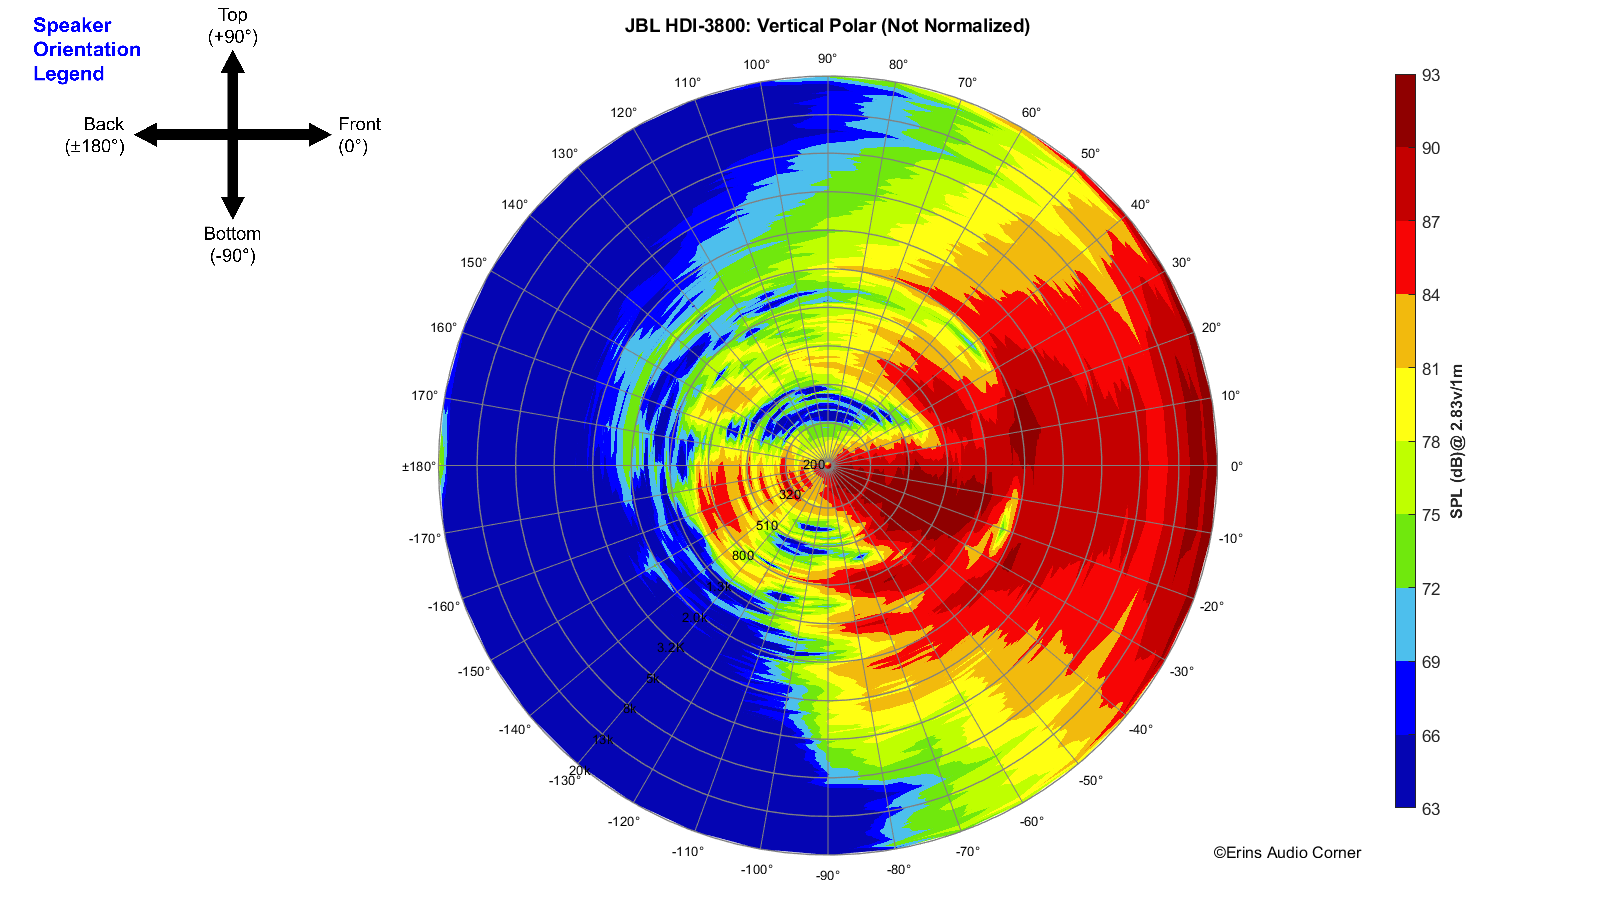
Vertical Polar (Globe) Plot:
This represents the sound field at 2 meters - above 200Hz - per the legend in the upper left.
Directivity Balloon
In-Room Measurements from the Listening Position
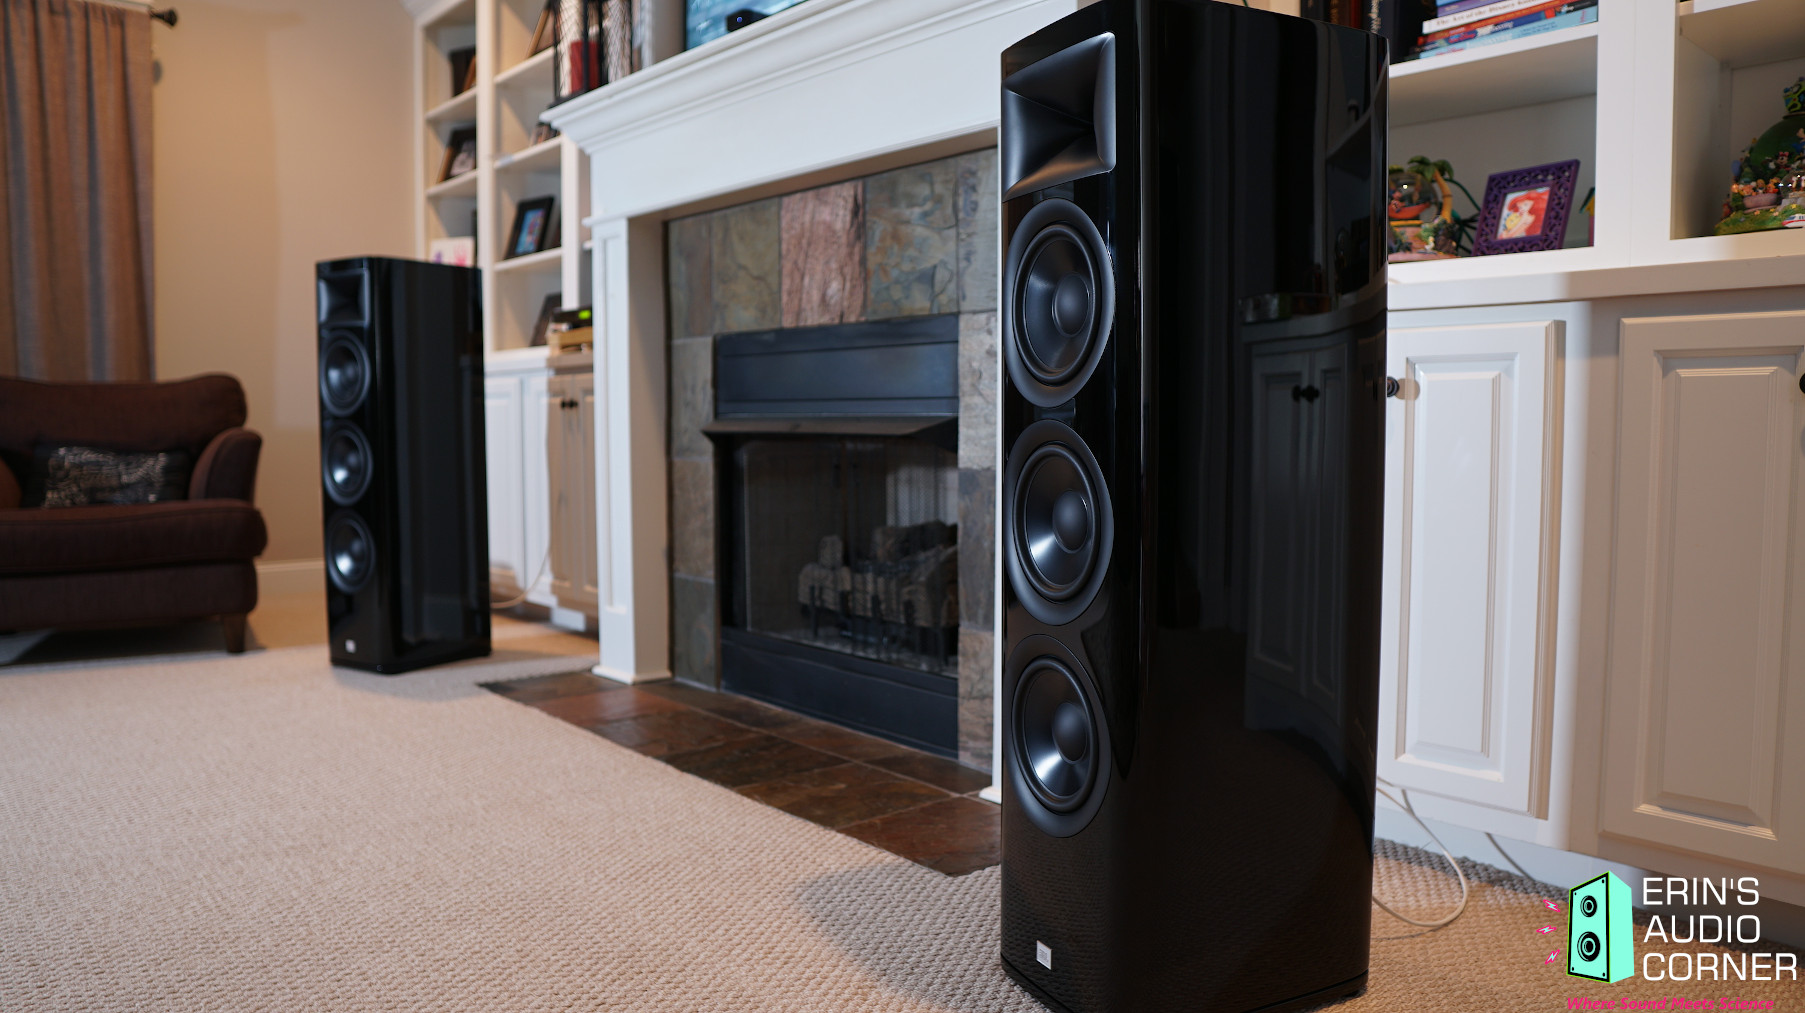
Below is a photograph of the speakers set up in my living room. The speakers were placed approximately 1.2m from the front wall (not the cabinets; but the actual wall). The listening position was approximately 4 meters from the speakers.
Below is the actual measured in-room response (with no DSP correction). This is a spatial average taken over approximately 1 cubic foot. As you can see, the actual in-room response aligns quite well with the prediction generated from the SPIN data. Pretty cool to see how anechoic measurements can reliably predict the actual in-room response. I feel many others often overlook this powerful benefit of the SPIN data.
Black = Predicted In-Room Response from SPIN data
Teal = Actual In-Room Measured Response from Main Listening Position
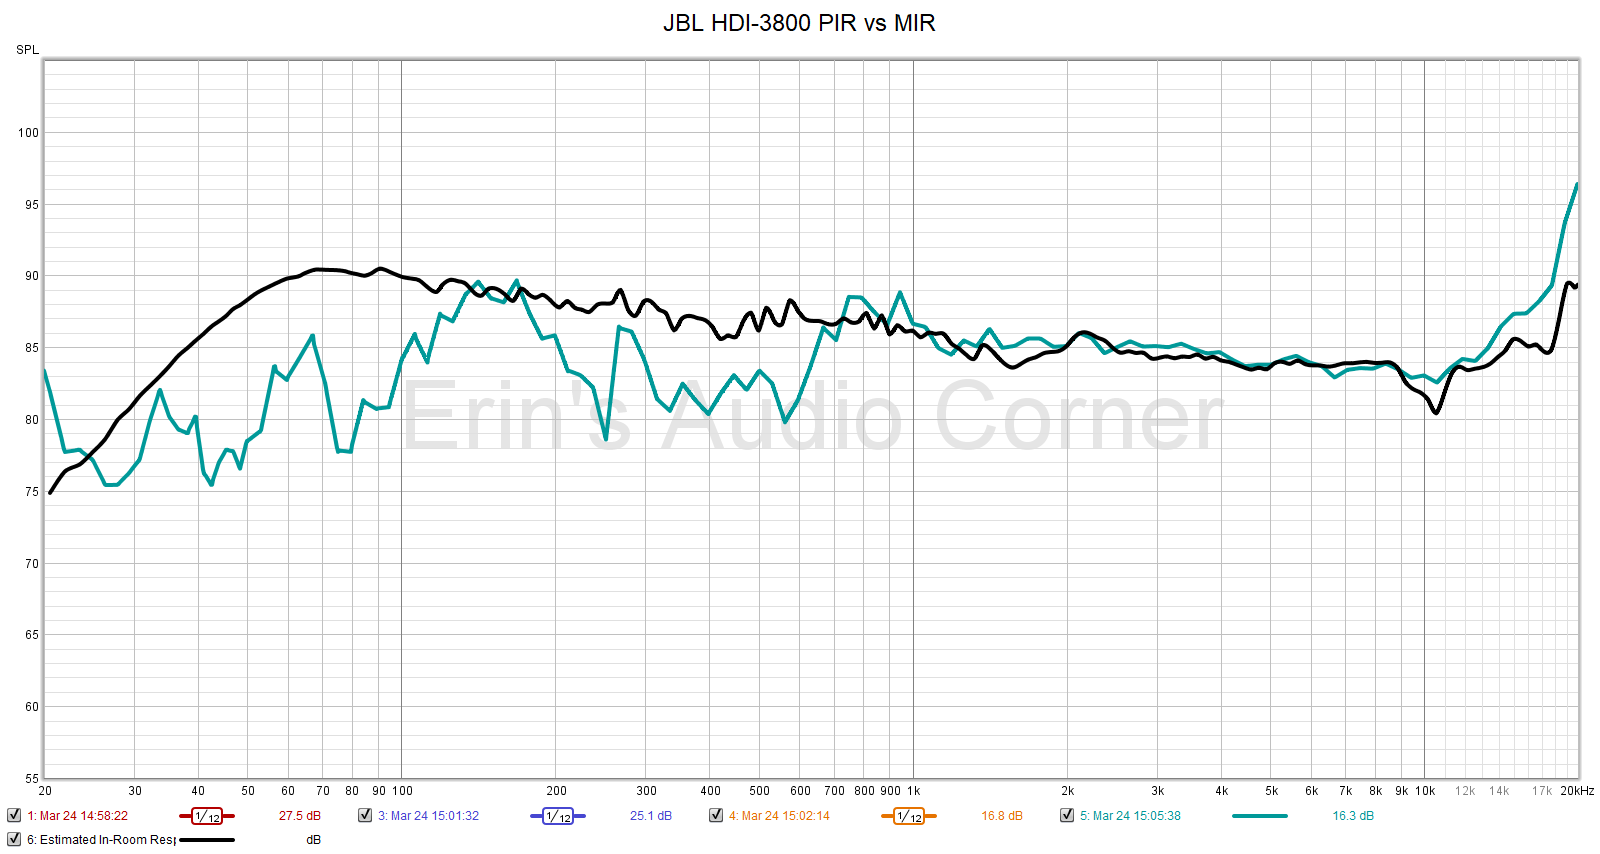
The prediction is quite accurate down to approximately 500Hz. Below this we see more deviation from the prediction. This is expected. The room takes over as you enter mid-to-low frequencies. Aside from the room dimensions, my couch, the back wall behind where I sit, the end table and the lamp near the listening position all influence the measured response. The dip from 150-400Hz is caused by the rear wall and/or couch as when the microphone is moved into the center of the room the dip fills in. Overall, what we see here is that the anechoic data can be conveniently used to predict the actual response one would expect to see in their own room.
Parting / Random Thoughts
I encourage you to watch my YouTube review for more details but a quick few notes:
- At 45-inches tall and 83 pounds of pure awesomeness with triple 8-inch woofers these speakers command your attention.
- Overall tonality of these speakers was good but I wouldn’t put them on par with their Revel counterparts.
- There was something in the lower midrange (I ballparked it at about 200-300Hz) that I just didn’t like where lower female vocals tended to sound more boxy than I felt was right. At this point, I’m not entirely sure what the culprit is. When looking at the horizontal radiation pattern you can see the data shows approximately a ±100° radiation pattern at around 300Hz but then sharply drops to about 50-60° by 350-400Hz. This could be what I was hearing as problematic in this region. This coincides with a slight ripple in the impedance graphic around this frequency as well. Food for thought.
- Horn designs tend to be looked at with this nostalgic tendency to think they are “shouty” or “boxy”. Good waveguided-horn designs to not exhibit this characteristic. The JBL HDI-3800 possesses a great waveguide. There is no “shoutiness” that plague the designs of old (or current, lesser designs). If you are predisposed to having that bias against a waveguide design you can throw that out the window here.
- Panned music heavy in midrange content was placed at the upper midrange drive unit and resulted in a discontinuity in soundstage height between the midrange and the tweeter (main listening axis). This stood out to me when I listened to Joe Walsh’s “Rocky Mountain Way” as the guitar at the intro is panned left, right and center. When panned to either side, the soundstage height was “split” between upper and mid frequencies. The vertical contour plot shows an angular shift in intensity as you move from midrange to treble frequencies. This is exactly what I heard.
- Imaging and focus (the ability to place items within the soundstage and provide proper “size” to those items) was quite excellent. There was no ambiguity as to where placement of instruments / singers were throughout the soundstage which is a testament, in my opinion, to the nice off-axis response control of the waveguide.
- While the horizontal radiation is well controlled, the soundstage wasn’t as wide as I personally prefer. I attribute this to the radiation pattern of ±50° (above the bass region) whereas other speakers I have preferred in this regard were closer to ±60-70°.
- The HDI-3800s get downright loud. The best part was there were no mechanical limits being reached (i.e., port chuffing, speakers bottoming out). I had these playing at 105dB at 4 meters and they could have kept going if I had a larger amplifier (I used a Parasound Integrated 200 which is rated at 110 watts at 4/8 Ohms).
- The speakers are very low in distortion. Objectively and subjectively.
- The relatively-high sensitivity helps provide more “dynamics” as the amplifier has more “headroom” to play at louder levels while still having enough dynamic range to hit higher peaks with well-produced music.
- I really feel these speakers would benefit from a subwoofer below 40 or 50Hz.
- I believe the sweet spot for these speakers lies in the use of a mixture of music and movies. While they don’t have the fidelity, in my humble opinion, of some other speakers I have tested, they do have a mostly neutral response, plenty of output capability and do not require much power to get loud. I think this is a tradeoff for a speaker used in a setting where the listener will use them both for music listening and movie watching.
As stated in the Foreword, this written review is purposely a cliff’s notes version. For more details about the performance (objectively and subjectively) please watch the YouTube video.
Support the Cause
If you like what you see here and want to help support the cause you might be interested in joining my Patreon, here. You can also contribute via PayPal (the big yellow button below).
Your support helps me pay for new items to test, hardware, miscellaneous items and costs of the site’s server space and bandwidth. All of which I otherwise pay out of pocket. So, if you can help chip in a few bucks, know that it is very much appreciated.
You can also join my Facebook and YouTube pages if you’d like to follow along with updates.