Foreword / YouTube Video Review
The review on this website is a brief overview and summary of the objective performance of this speaker. It is not intended to be a deep dive. Moreso, this is information for those who prefer “just the facts” and prefer to have the data without the filler.
However, for those who want more - a detailed explanation of the objective performance, and my subjective evaluation (what I heard, what I liked, etc) - please watch the below video where I go more in-depth.
Information and Photos
I have provided a introduction to this speaker on my YouTube channel and provided below.
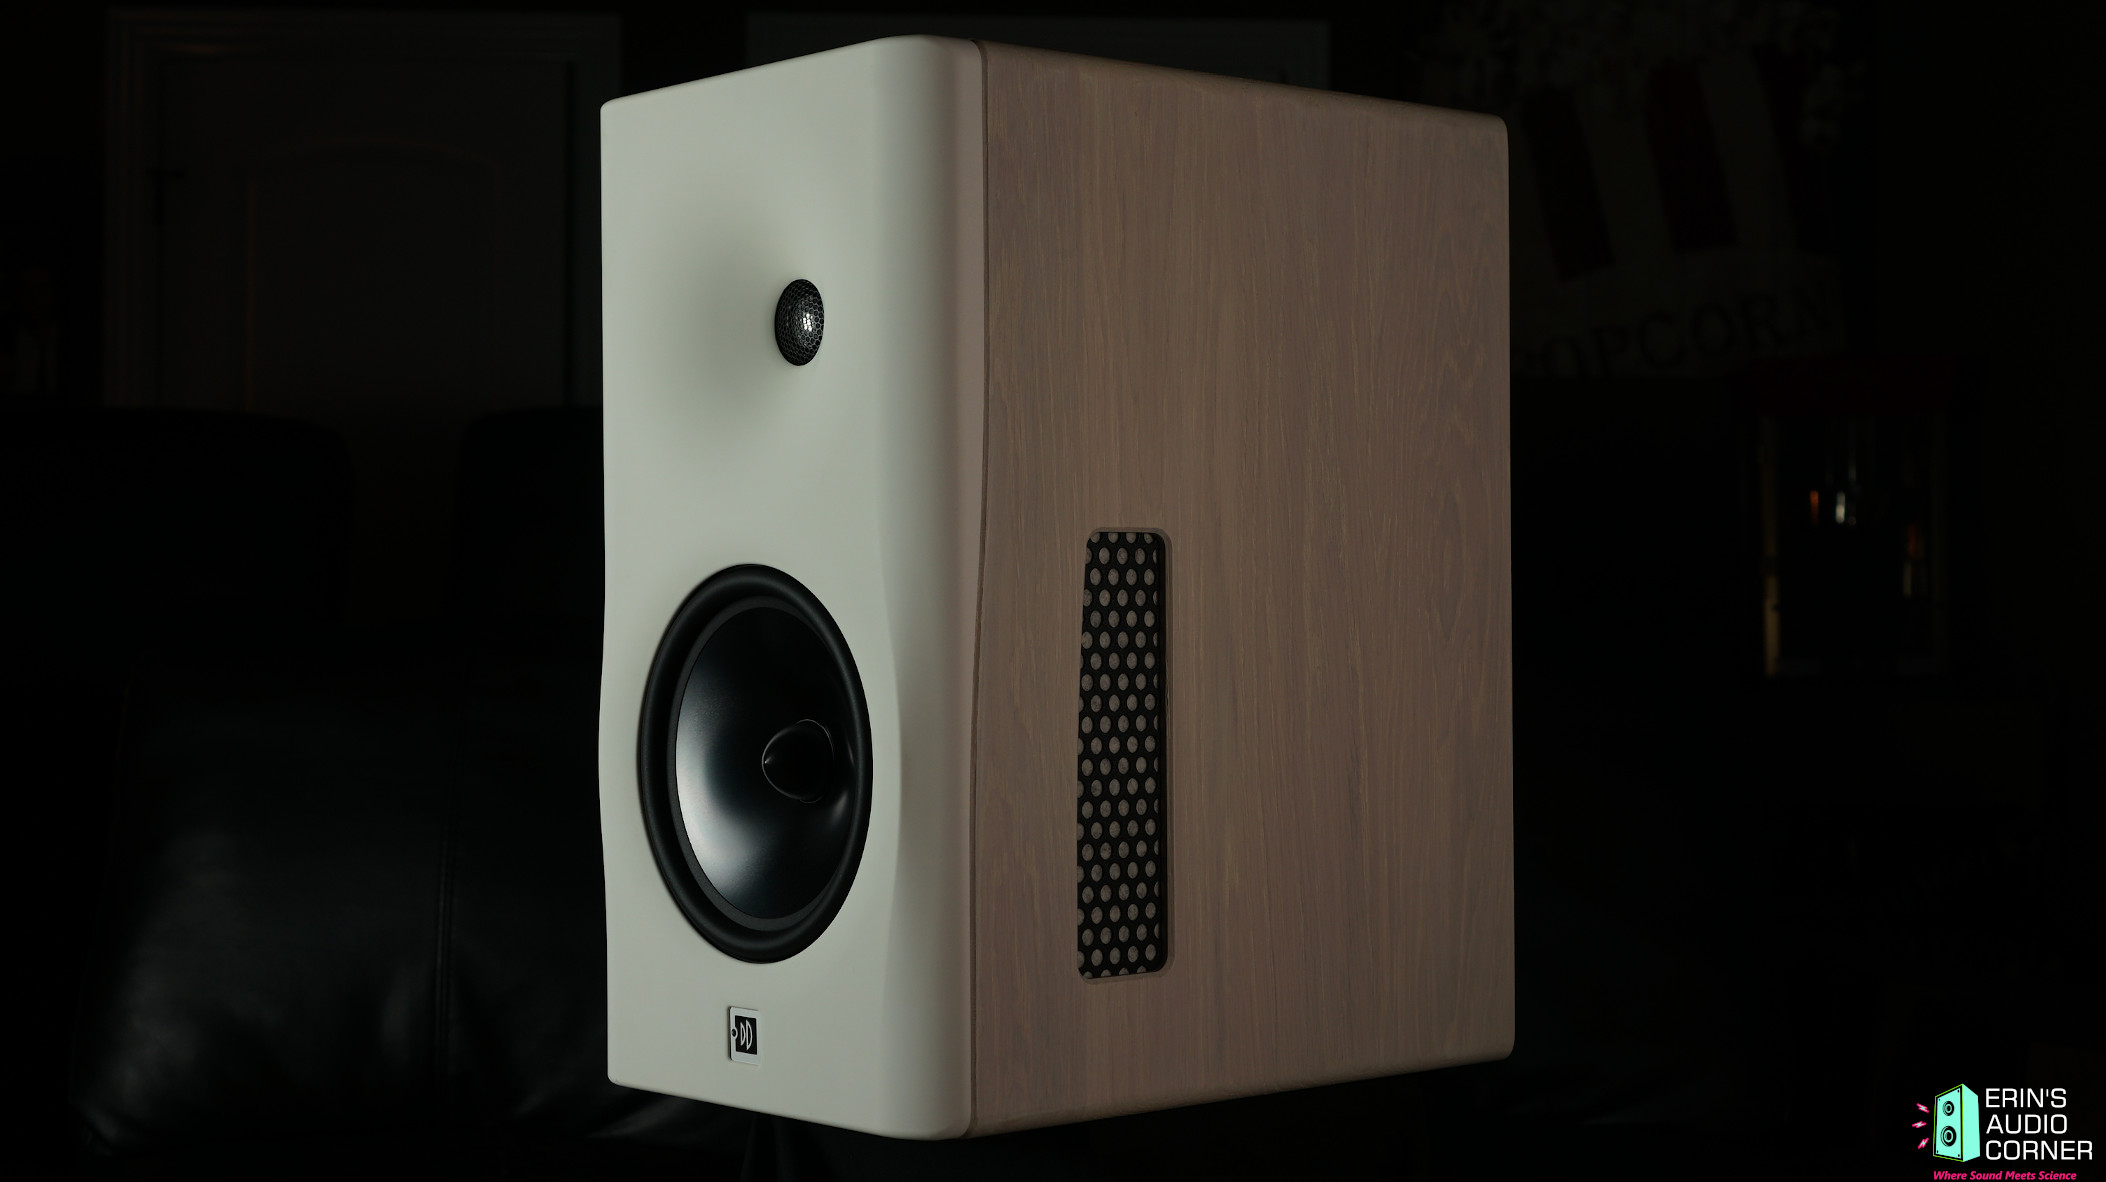
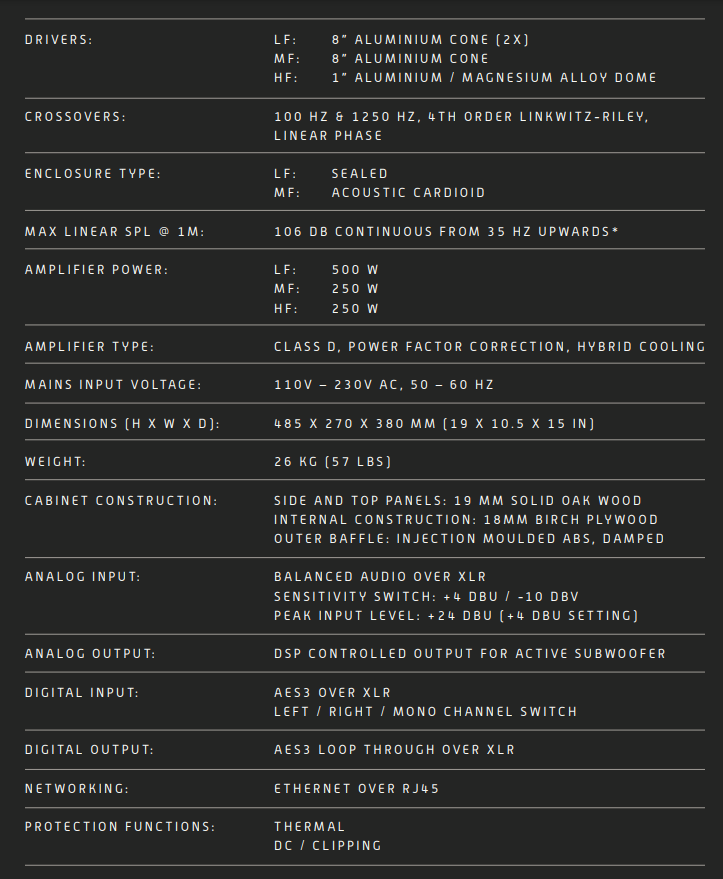
The Dutch & Dutch 8c is a powered bookshelf speaker that is quite the departure from the typical bookshelf speaker. Its cardioid design means it is practically all forward-firing above approximately 100Hz. This enables the listener to place the speakers very close to a rear wall and get the benefit of boundary reinforcement without the negative characteristic of rear-wall reflections. It’s quite a neat theory that also has remarkable sonic achievements in practice.
The front of the speaker features a 1-inch dome tweeter and 8-inch midrange. The crossover between these two driver units is 1250Hz. The front baffle is one piece that fits over the drivers, resulting in a very smooth waveguide for the tweeter (notice the lack of screw heads and holes) as well as a smooth lip even on the midrange.
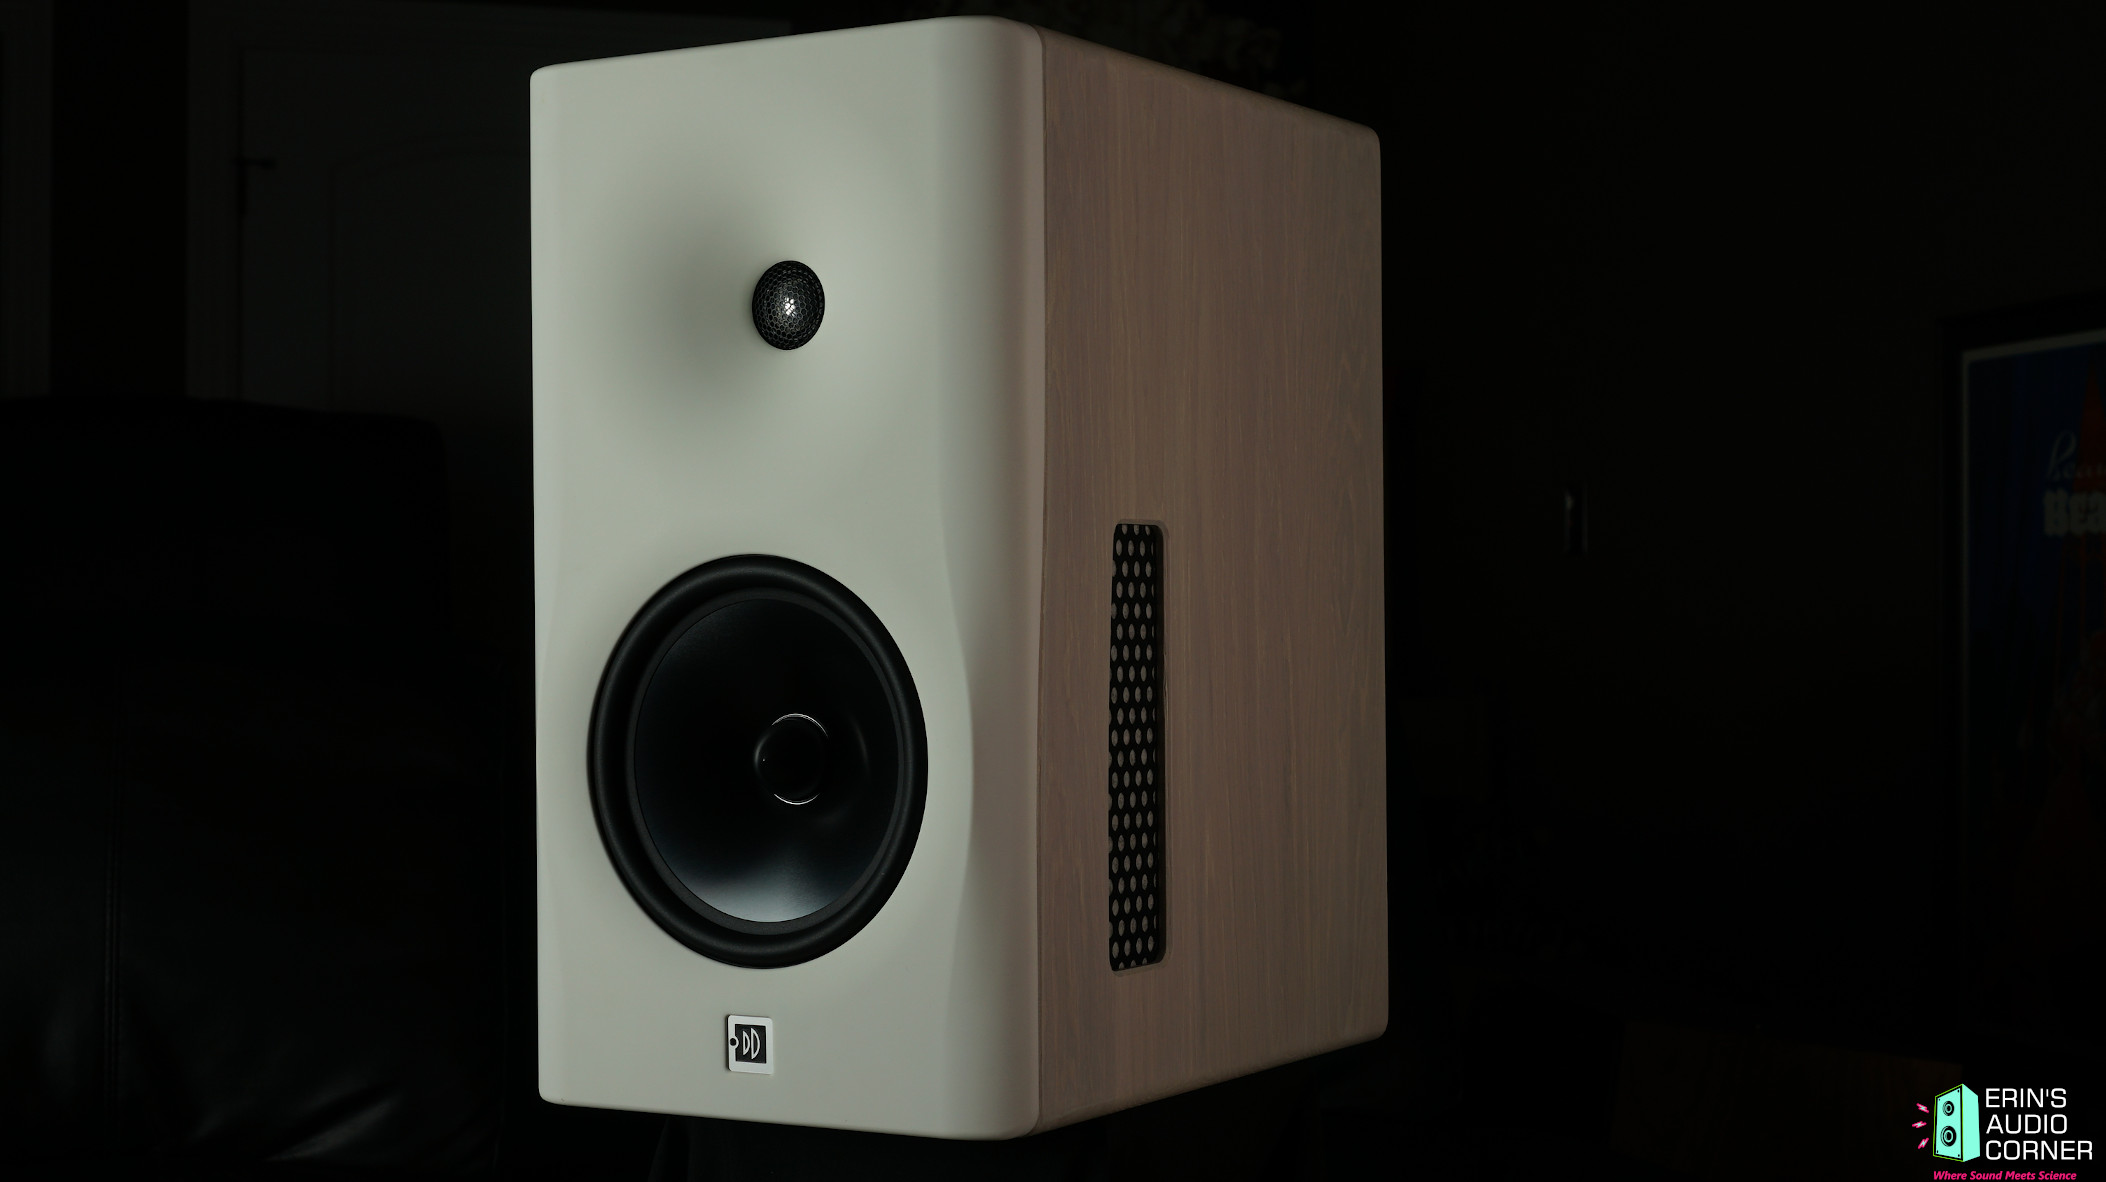
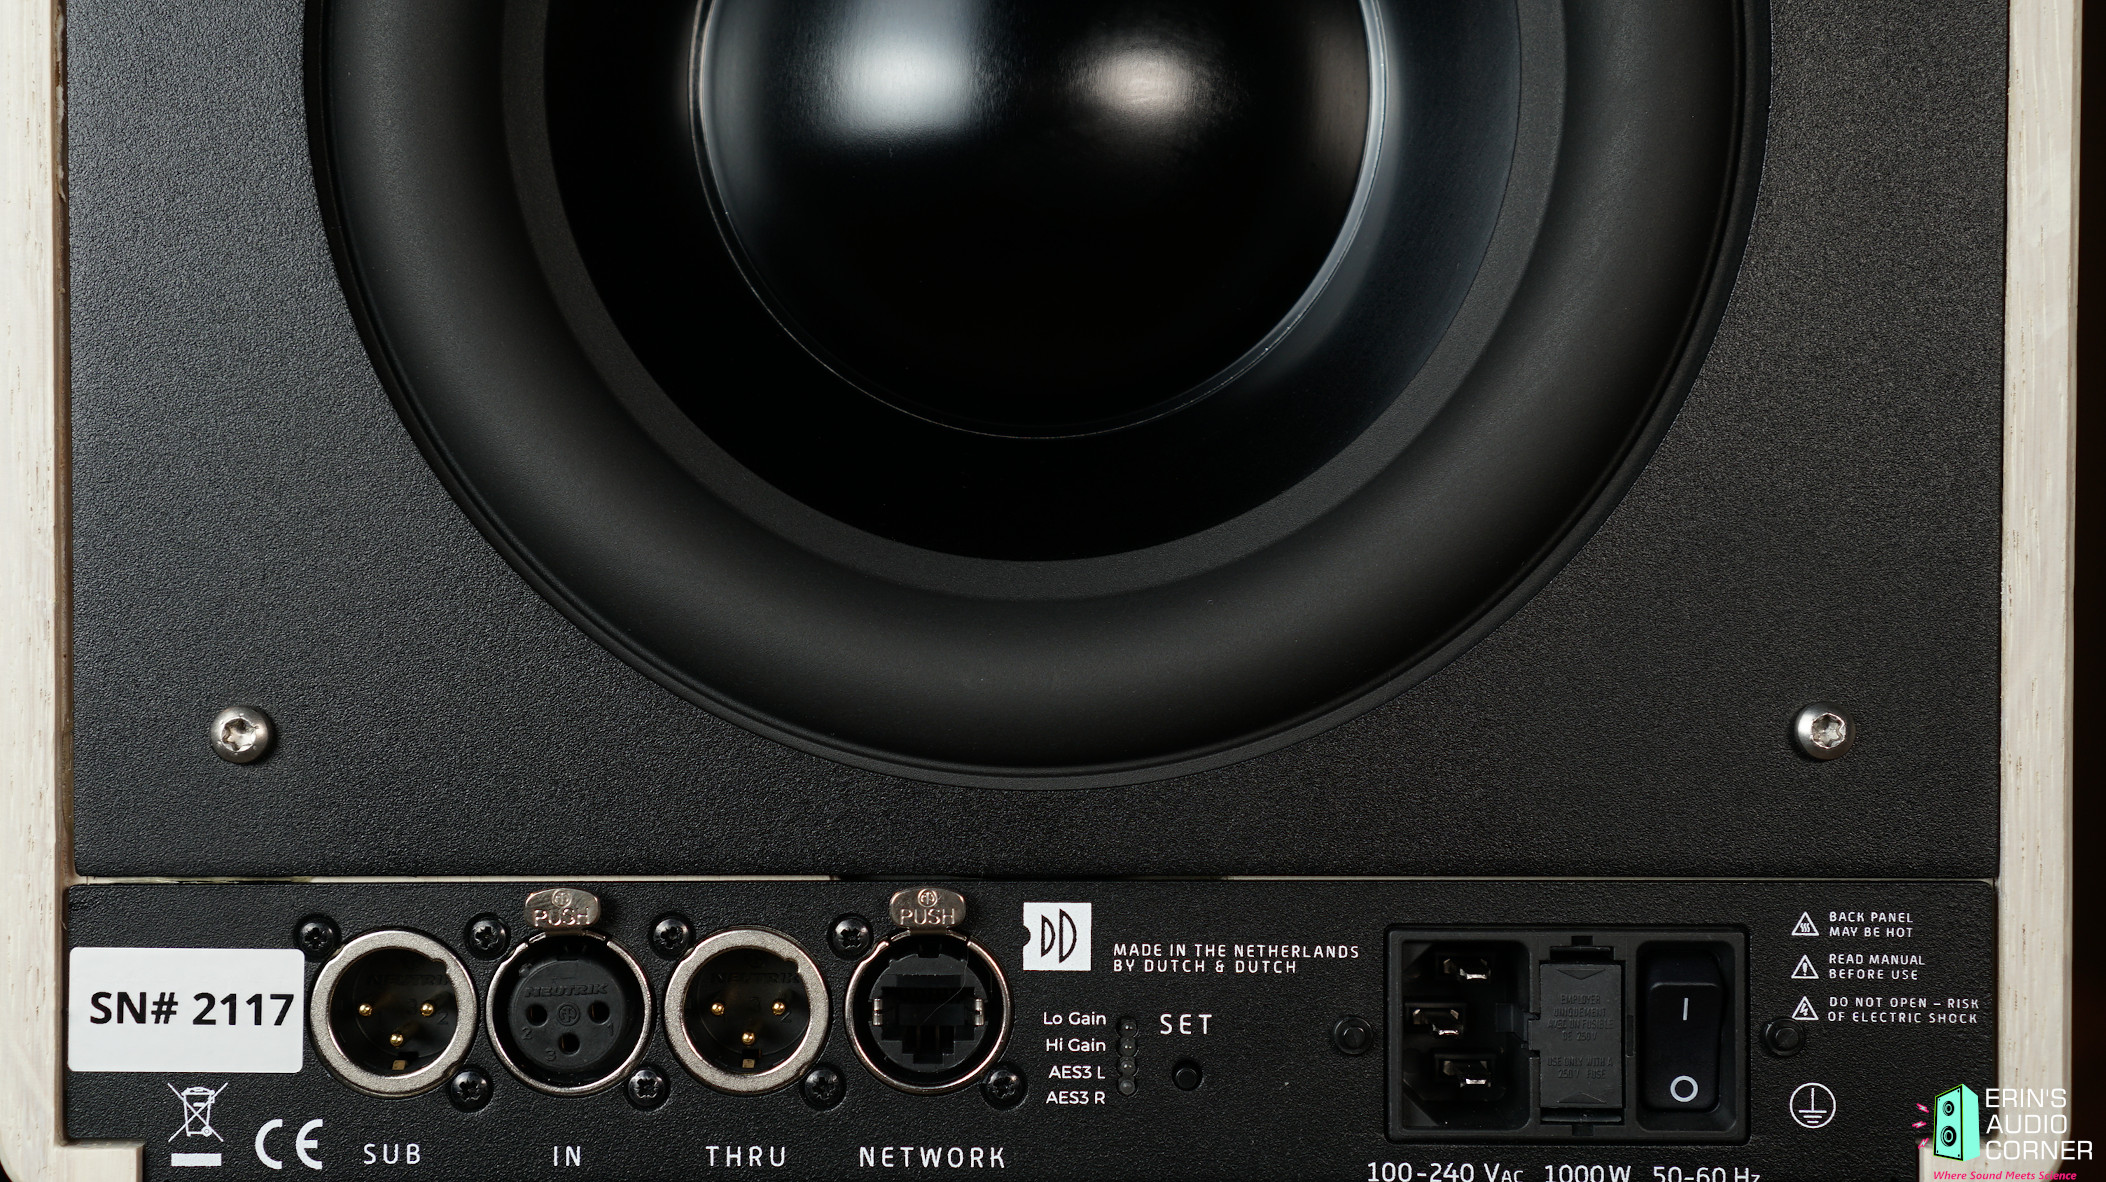
The rear features dual 8-inch subwoofers which play below 100Hz. The rear also contains the I/O ports (AES digital, as well as balanced analog via XLR) and even a pass through for a separate subwoofer.
The Dutch & Dutch 8c is an “all in one” product. It features a built-in amplifier with DSP allowing the user to tailor the speaker to their own tonal desires (bass, mid and treble adjustments). The 8c is also designed to integrate with Room EQ Wizard for room equalization. This feature works very well and is very easy to navigate and implement. The speaker connects to your network via wired ethernet cable. Once connected you can access the speaker’s DSP, volume control, source selection (analog/AES), etc. via your web browser. It is really quite easy and convenient.
Current street price for a pair of these speakers is approximately $12,500 USD.
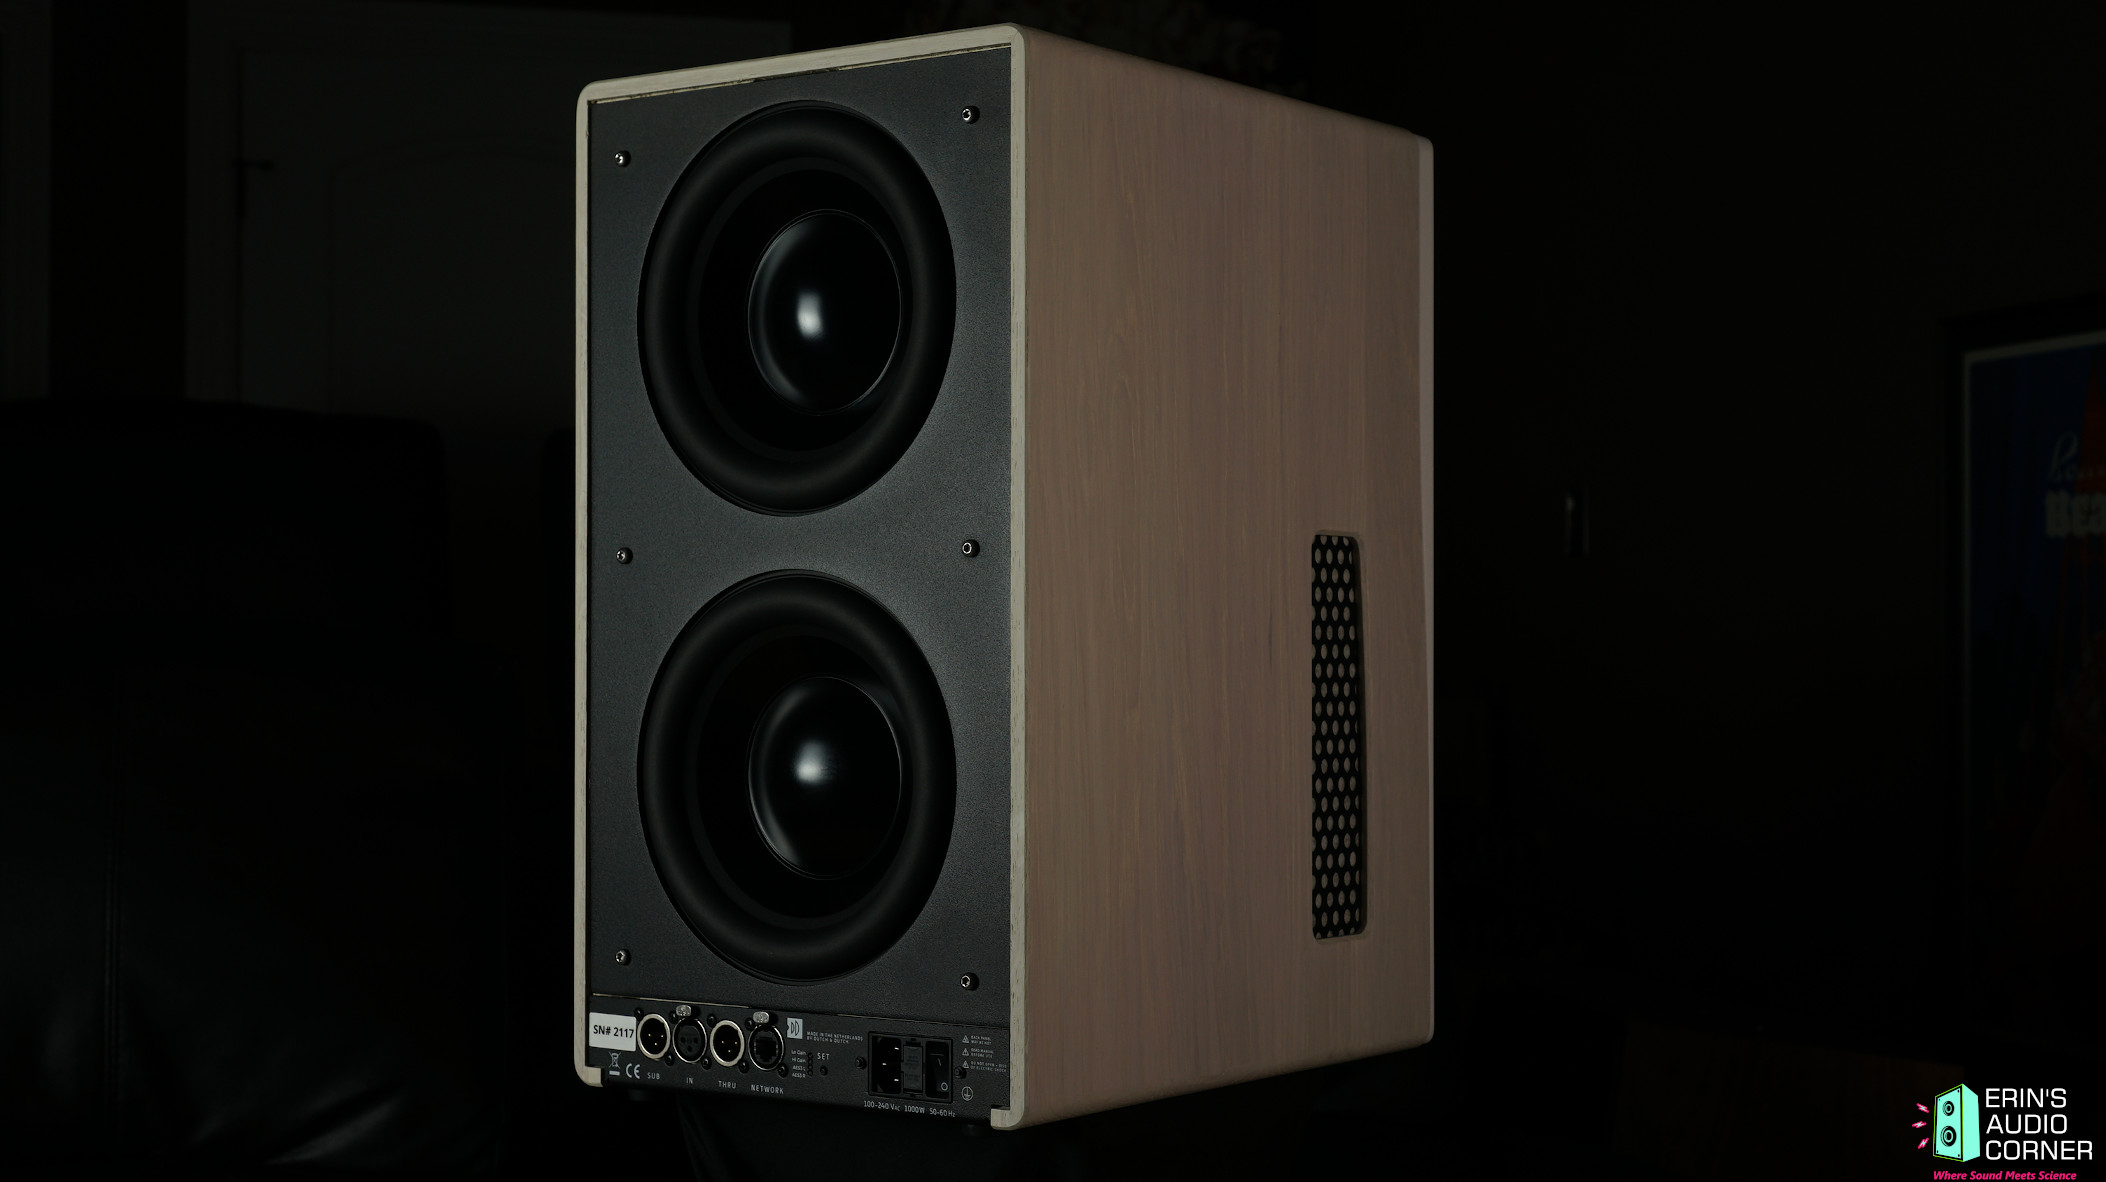
I have taken the liberty of providing a screenshot of the technical specs from the manufacturer’s page, provided below:
CTA-2034 (SPINORAMA) and Accompanying Data
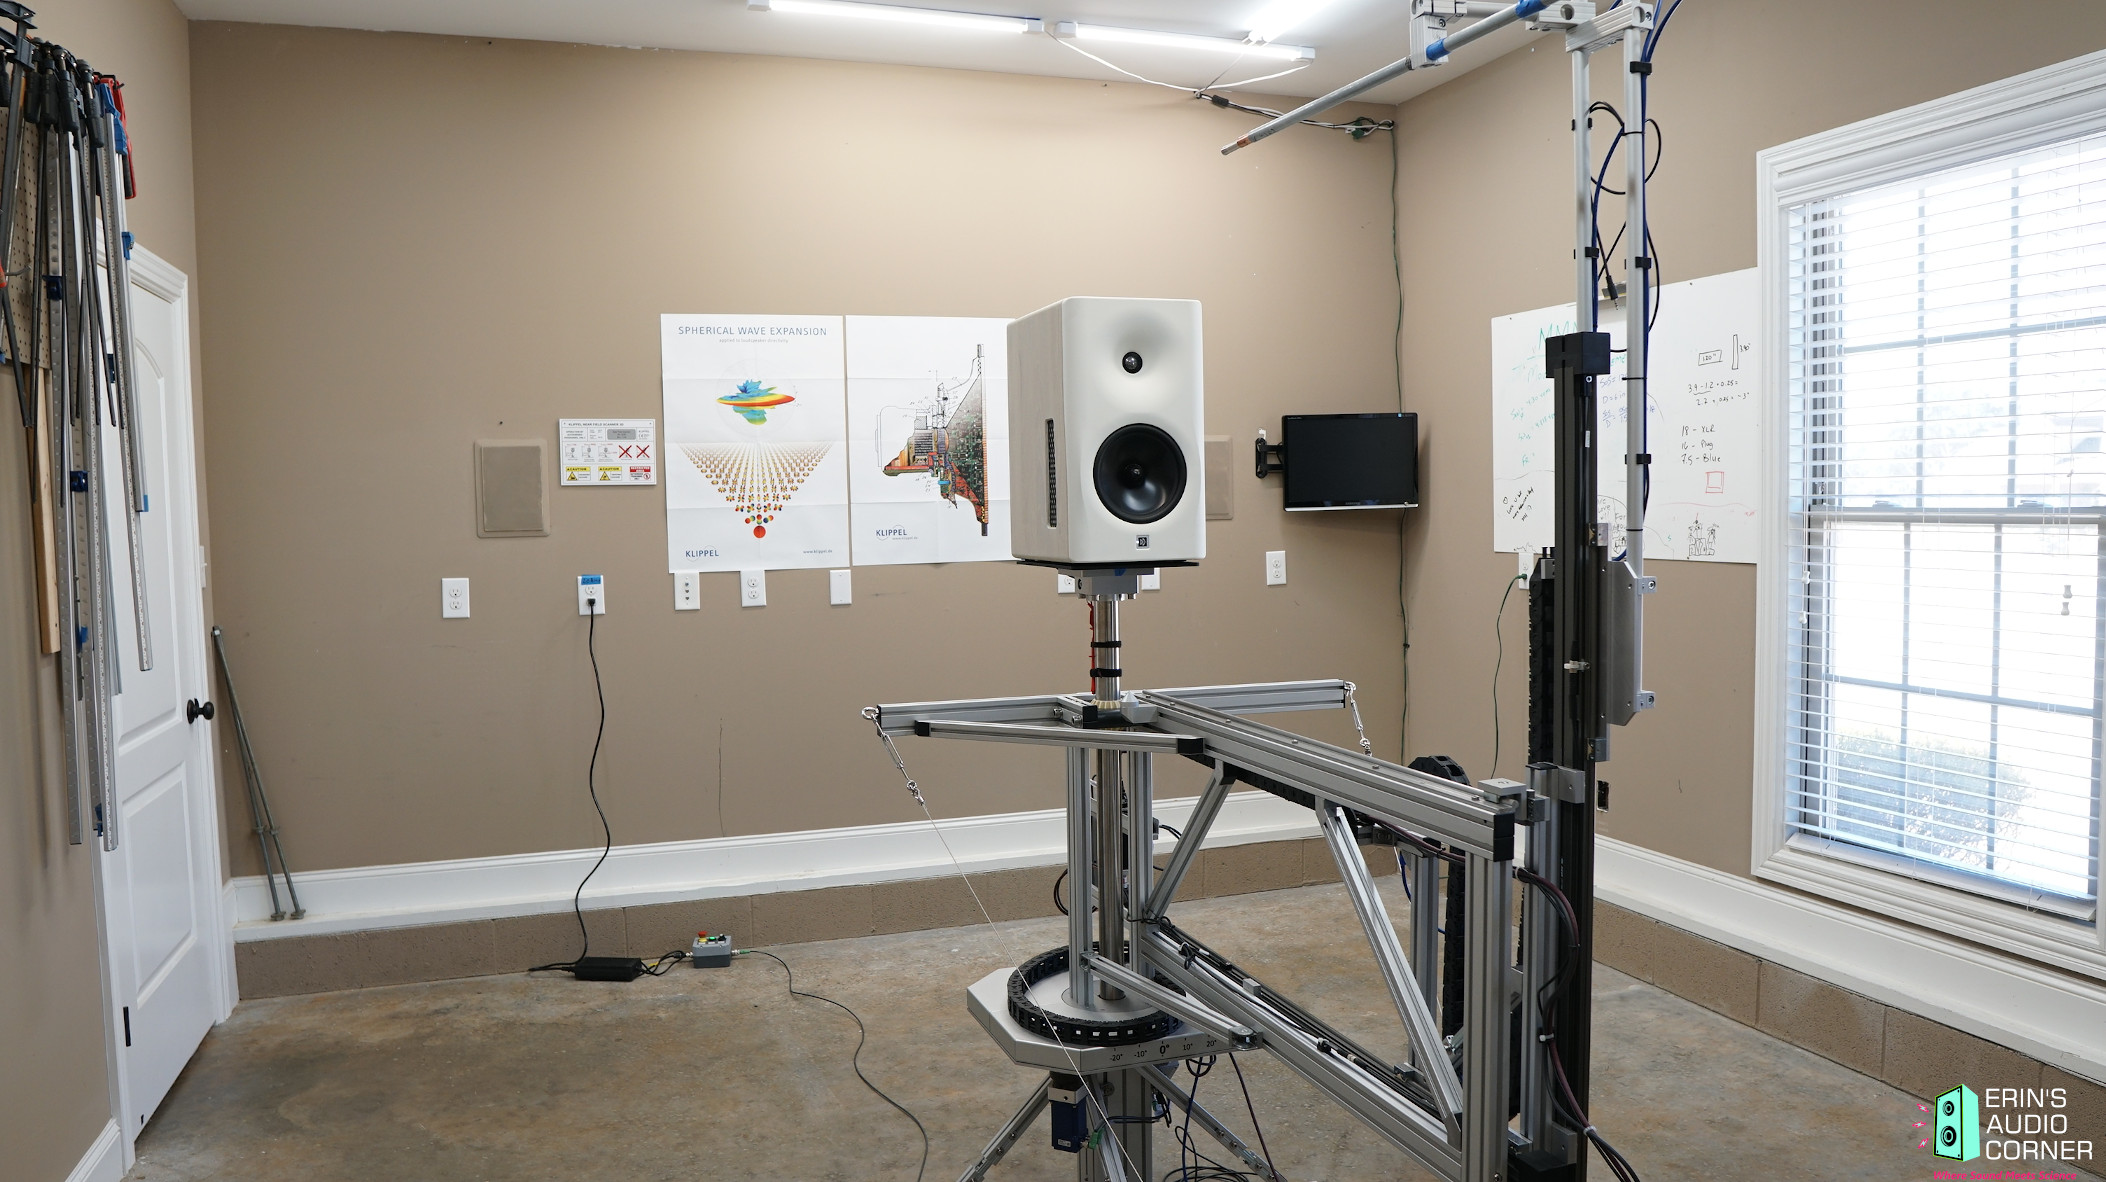
All data collected using Klippel’s Near-Field Scanner. The Near-Field-Scanner 3D (NFS) offers a fully automated acoustic measurement of direct sound radiated from the source under test. The radiated sound is determined in any desired distance and angle in the 3D space outside the scanning surface. Directivity, sound power, SPL response and many more key figures are obtained for any kind of loudspeaker and audio system in near field applications (e.g. studio monitors, mobile devices) as well as far field applications (e.g. professional audio systems). Utilizing a minimum of measurement points, a comprehensive data set is generated containing the loudspeaker’s high resolution, free field sound radiation in the near and far field. For a detailed explanation of how the NFS works and the science behind it, please watch the below discussion with designer Christian Bellmann:
A picture of the setup in my garage:
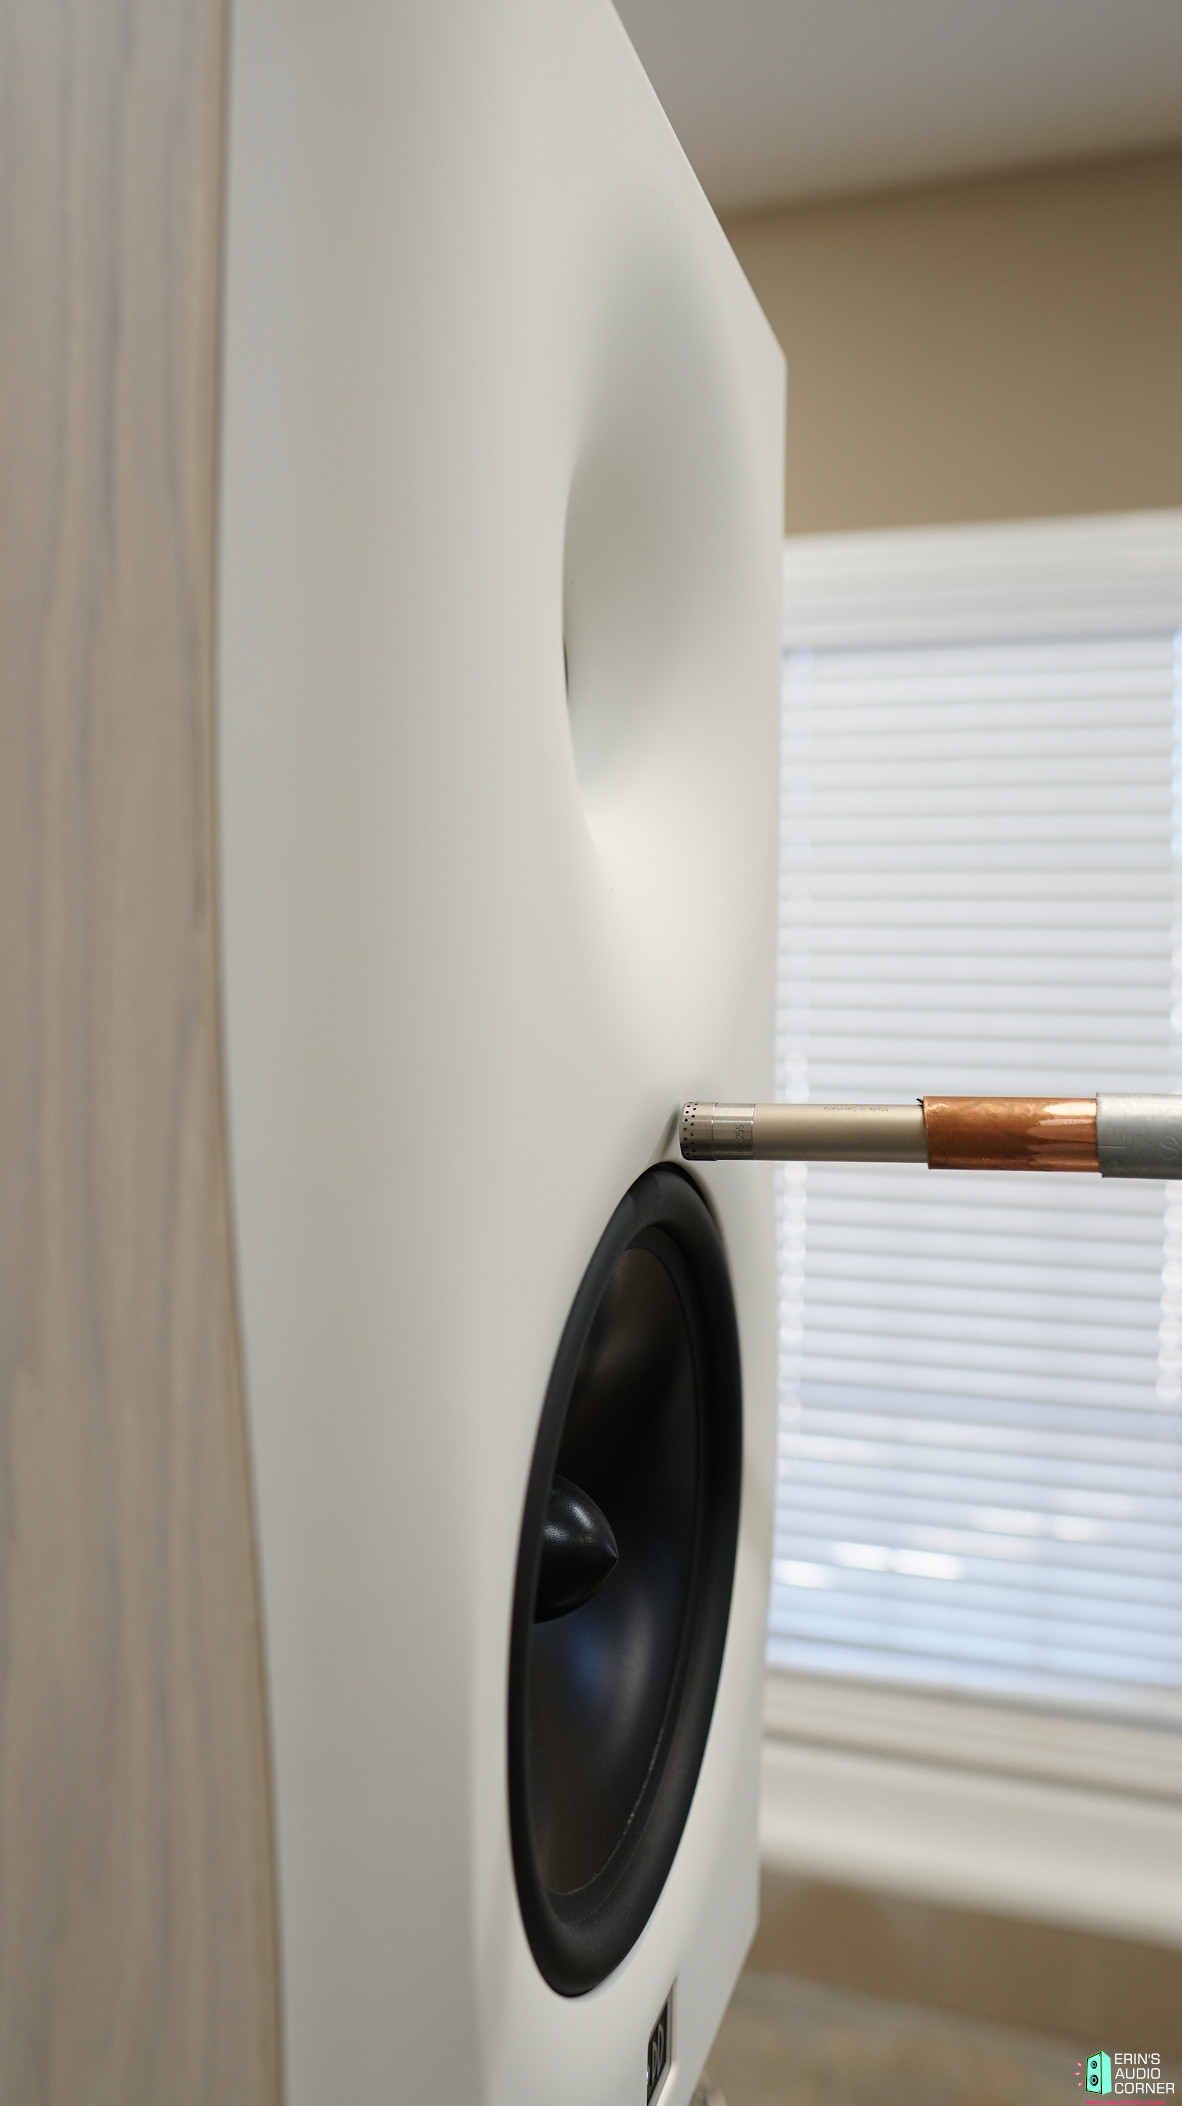
The reference plane in this test is halfway between the tweeter and the midrange, as shown in the image below:
Measurements are provided in a format in accordance with the Standard Method of Measurement for In-Home Loudspeakers (ANSI/CTA-2034-A R-2020). For more information, please see this link.
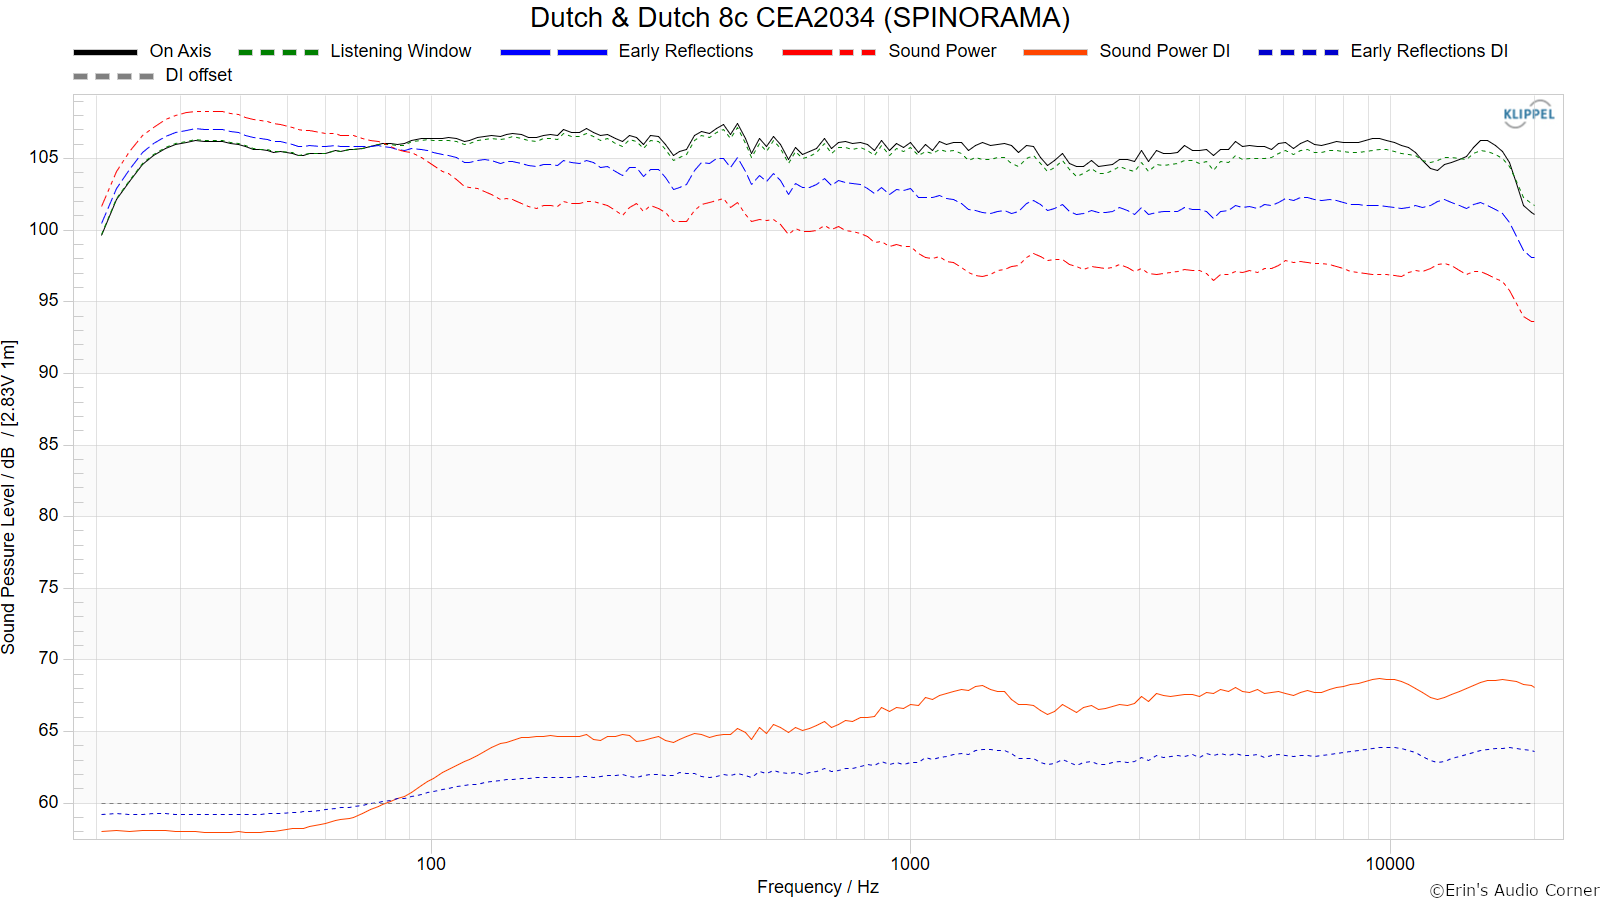
CTA-2034 / SPINORAMA:
The On-axis Frequency Response (0°) is the universal starting point and in many situations it is a fair representation of the first sound to arrive at a listener’s ears.
The Listening Window is a spatial average of the nine amplitude responses in the ±10º vertical and ±30º horizontal angular range. This encompasses those listeners who sit within a typical home theater audience, as well as those who disregard the normal rules when listening alone.
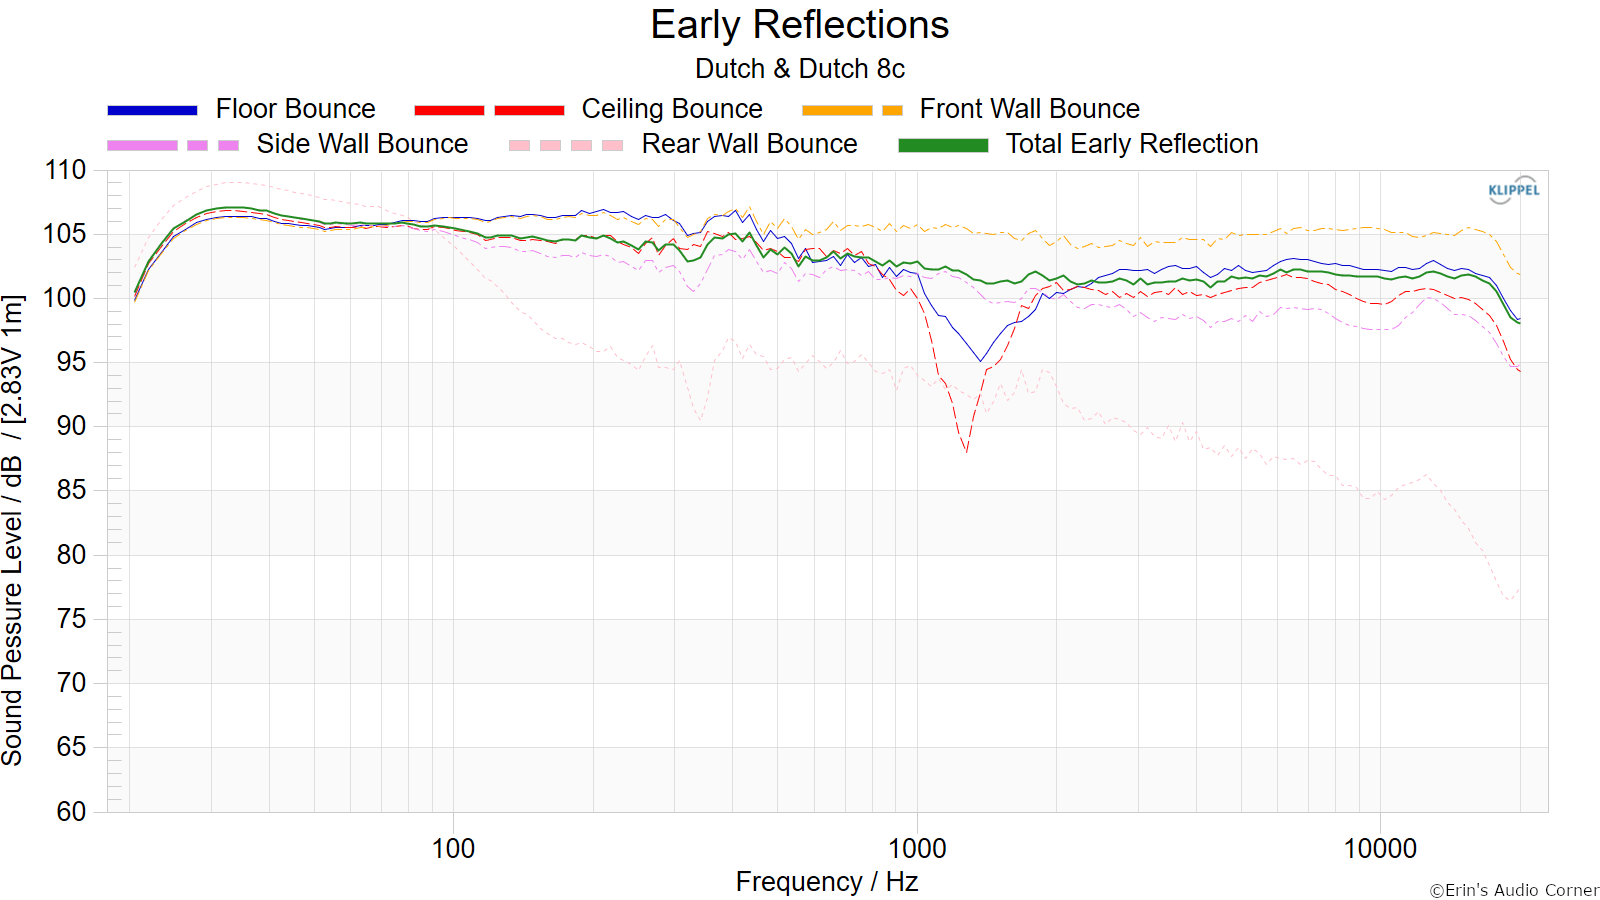
The Early Reflections curve is an estimate of all single-bounce, first-reflections, in a typical listening room.
Sound Power represents all of the sounds arriving at the listening position after any number of reflections from any direction. It is the weighted rms average of all 70 measurements, with individual measurements weighted according to the portion of the spherical surface that they represent.
Sound Power Directivity Index (SPDI): In this standard the SPDI is defined as the difference between the listening window curve and the sound power curve.
Early Reflections Directivity Index (EPDI): is defined as the difference between the listening window curve and the early reflections curve. In small rooms, early reflections figure prominently in what is measured and heard in the room so this curve may provide insights into potential sound quality.
Note: Since this is a powered speaker, the SPL readings in the below graphics was not the SPL tested. Per the CTA-2034 spec, the input voltage is 2.83v. However, this speaker was tested at a level more in line with approximately 86dB at 1m (0.30vRMS input). The output SPL is scaled based on the 2.83v, though. Therefore, at 2.83v input to this speaker, the output is shown as below.
Note 2: The 8c is intended to be placed near a wall to increase the sub-bass output. However, per the CTA-2034, tests are conducted in anechoic fashion. In this case, the DSP setting for the “Front Wall” in the 8c was set to “free”; or, no boundary. Yet, the response is flat until 25Hz. Impressive to say the least. I conducted additional tests shown in a later section that illustrate the benefit of the front wall gain and the effect of setting the DSP to account for such things.
Early Reflections Breakout:
Floor bounce: average of 20º, 30º, 40º down
Ceiling bounce: average of 40º, 50º, 60º up
Front wall bounce: average of 0º, ± 10º, ± 20º, ± 30º horizontal
Side wall bounces: average of ± 40º, ± 50º, ± 60º, ± 70º, ± 80º horizontal
Rear wall bounces: average of 180º, ± 90º horizontal
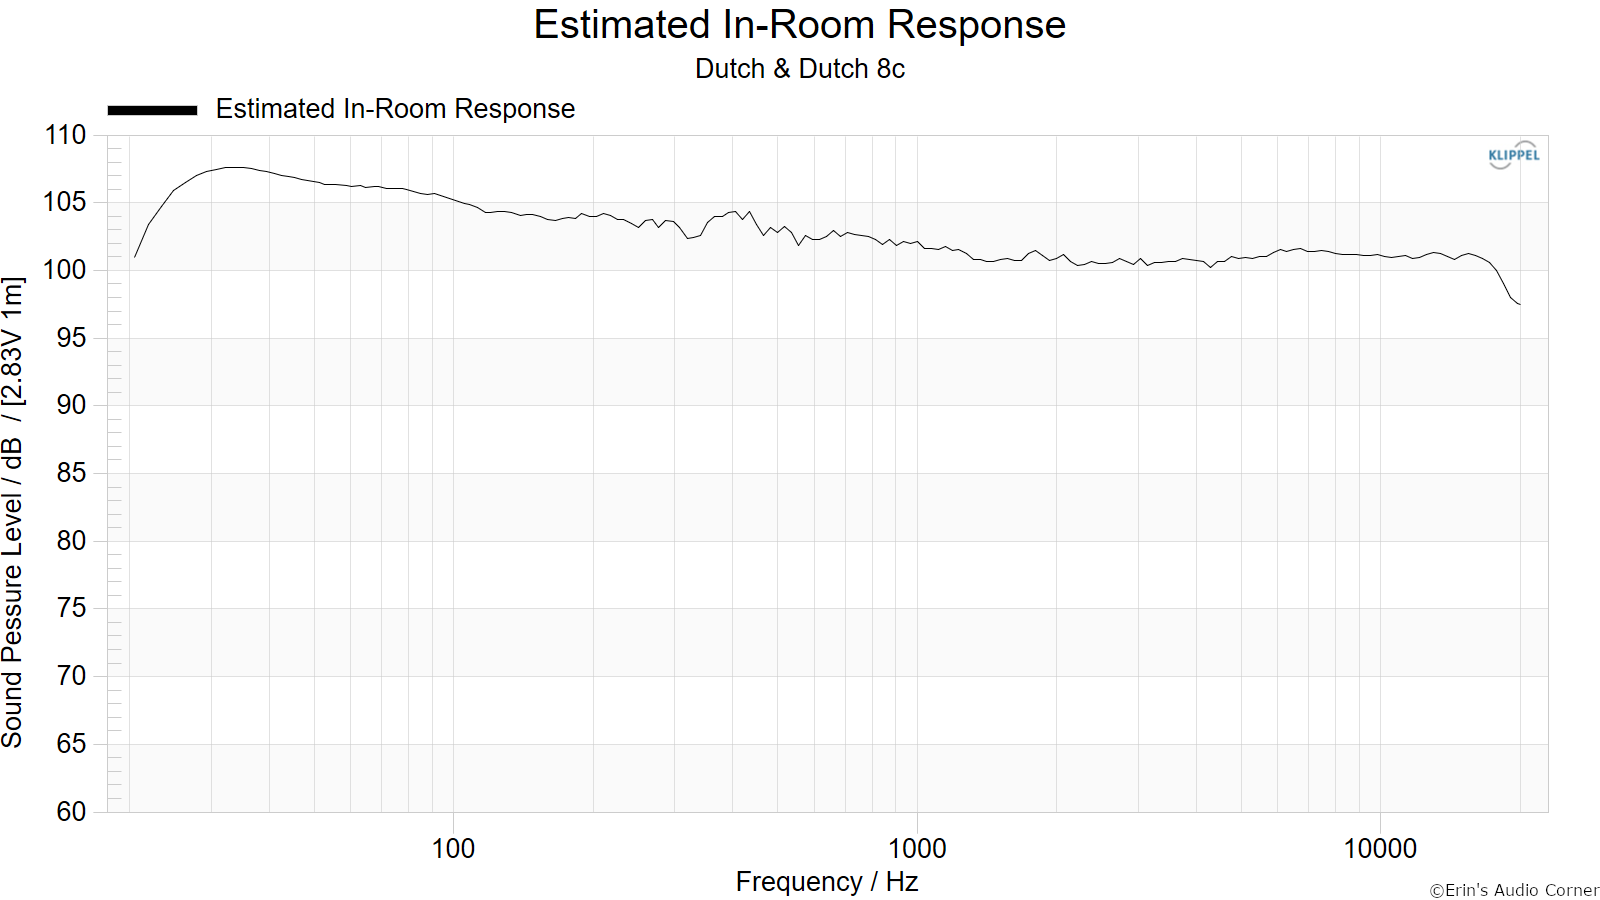
Estimated In-Room Response:
In theory, with complete 360-degree anechoic data on a loudspeaker and sufficient acoustical and geometrical data on the listening room and its layout it would be possible to estimate with good precision what would be measured by an omnidirectional microphone located in the listening area of that room. By making some simplifying assumptions about the listening space, the data set described above permits a usefully accurate preview of how a given loudspeaker might perform in a typical domestic listening room. Obviously, there are no guarantees, because individual rooms can be acoustically aberrant. Sometimes rooms are excessively reflective (“live”) as happens in certain hot, humid climates, with certain styles of interior décor and in under-furnished rooms. Sometimes rooms are excessively “dead” as in other styles of décor and in some custom home theaters where acoustical treatment has been used excessively. This form of post processing is offered only as an estimate of what might happen in a domestic living space with carpet on the floor and a “normal” amount of seating, drapes and cabinetry.
For these limited circumstances it has been found that a usefully accurate Predicted In-Room (PIR) amplitude response, also known as a “room curve” is obtained by a weighted average consisting of 12 % listening window, 44 % early reflections and 44 % sound power. At very high frequencies errors can creep in because of excessive absorption, microphone directivity, and room geometry. These discrepancies are not considered to be of great importance.
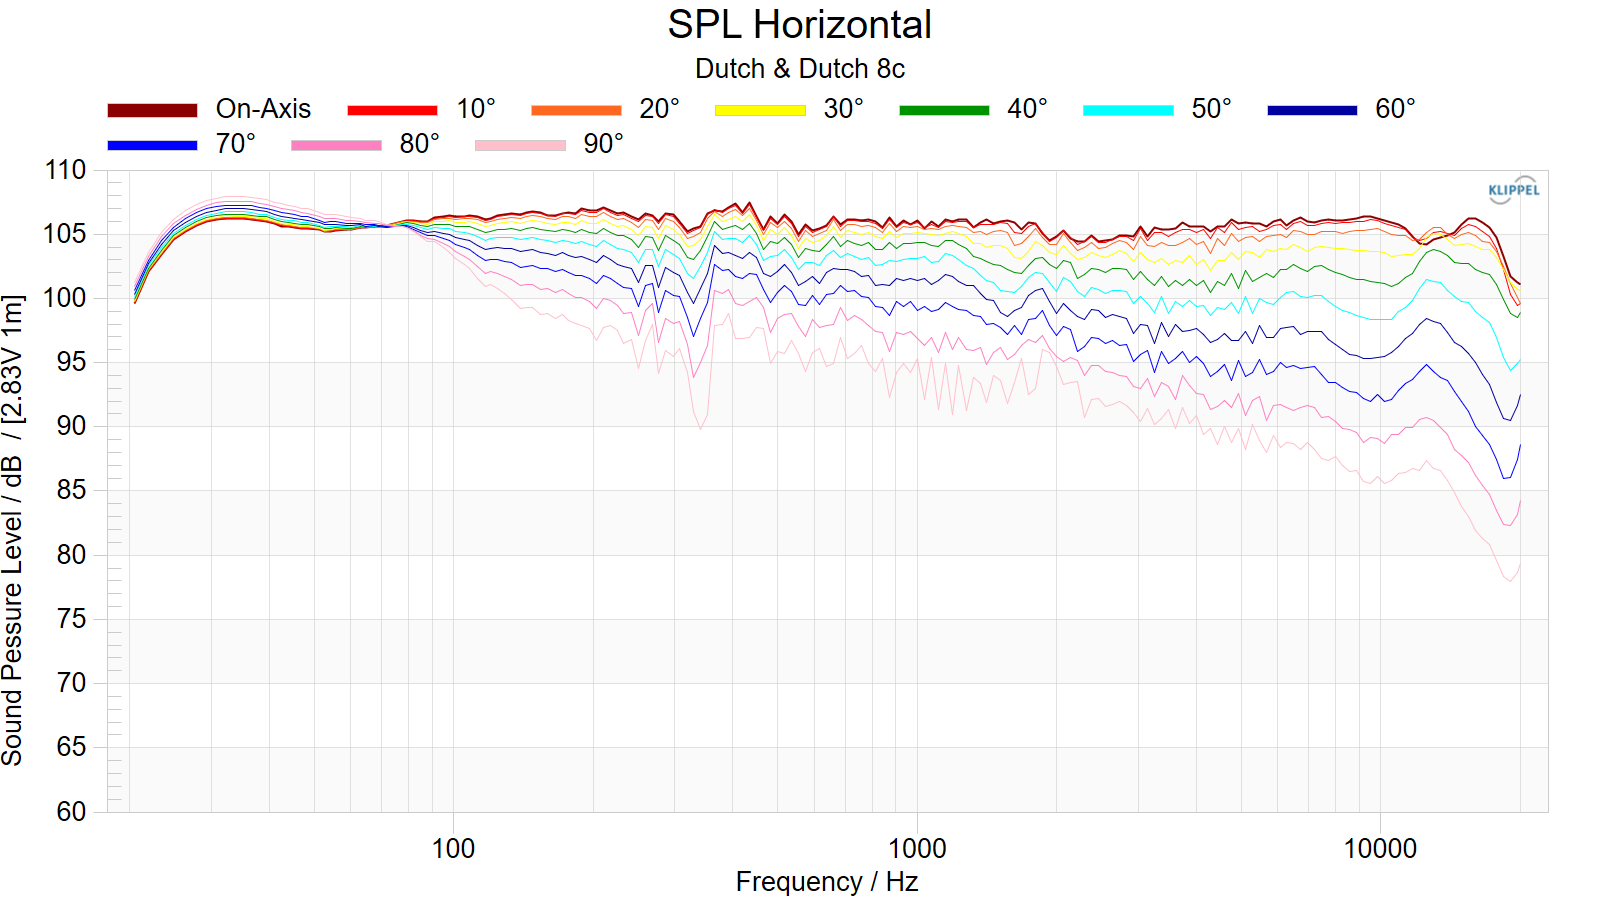
Horizontal Frequency Response (0° to ±90°):
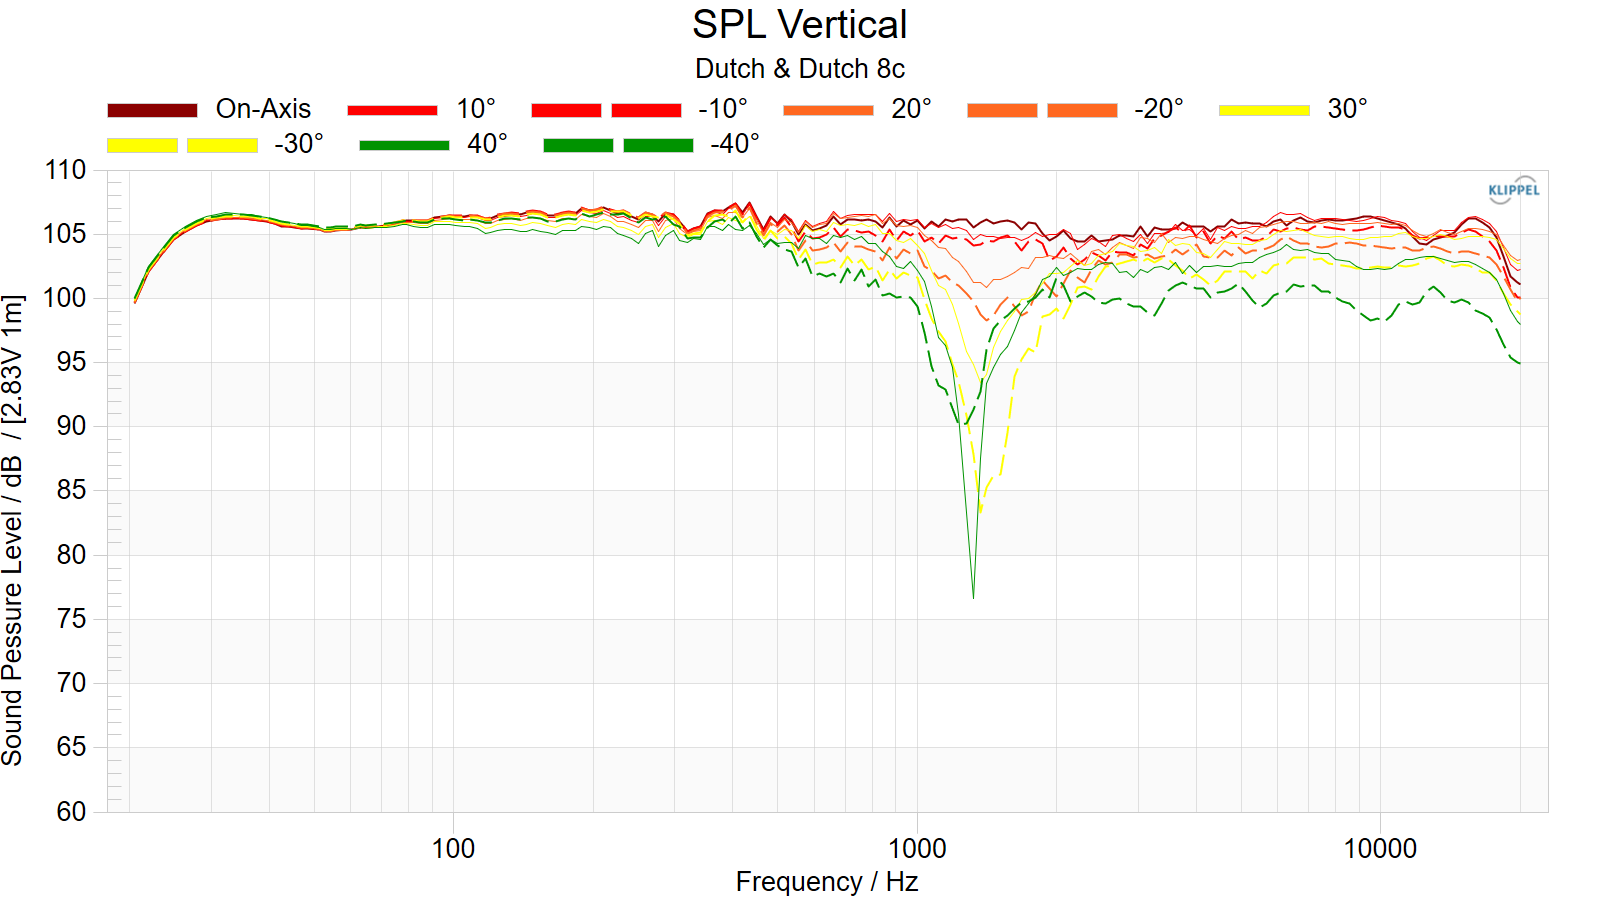
Vertical Frequency Response (0° to ±30°):
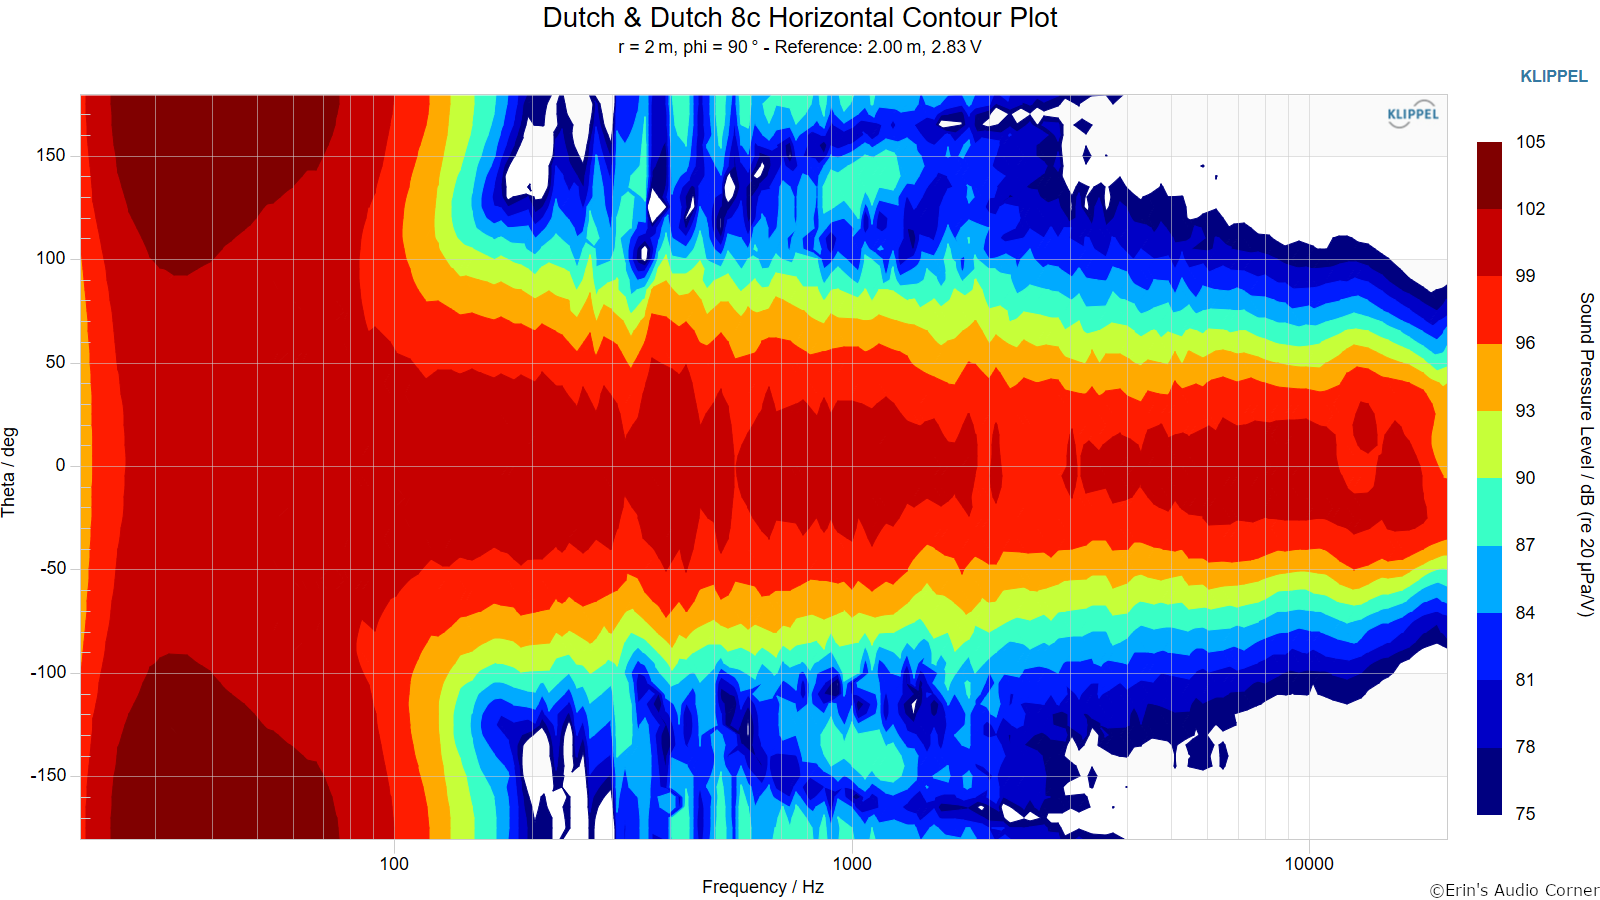
Horizontal Contour Plot (not normalized):
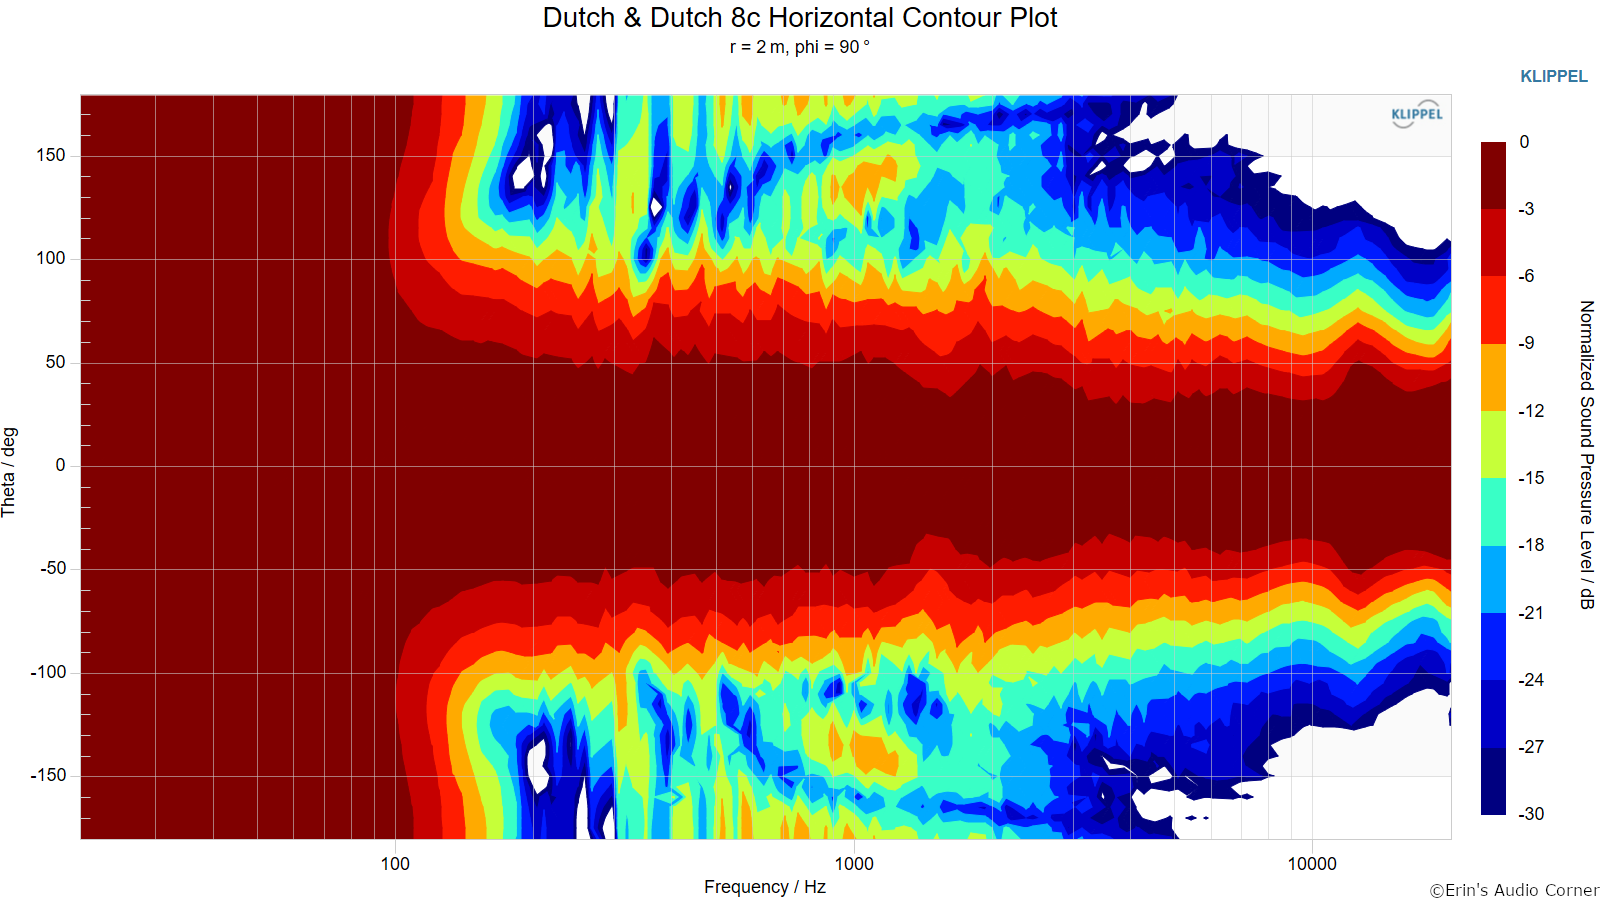
Horizontal Contour Plot (normalized):
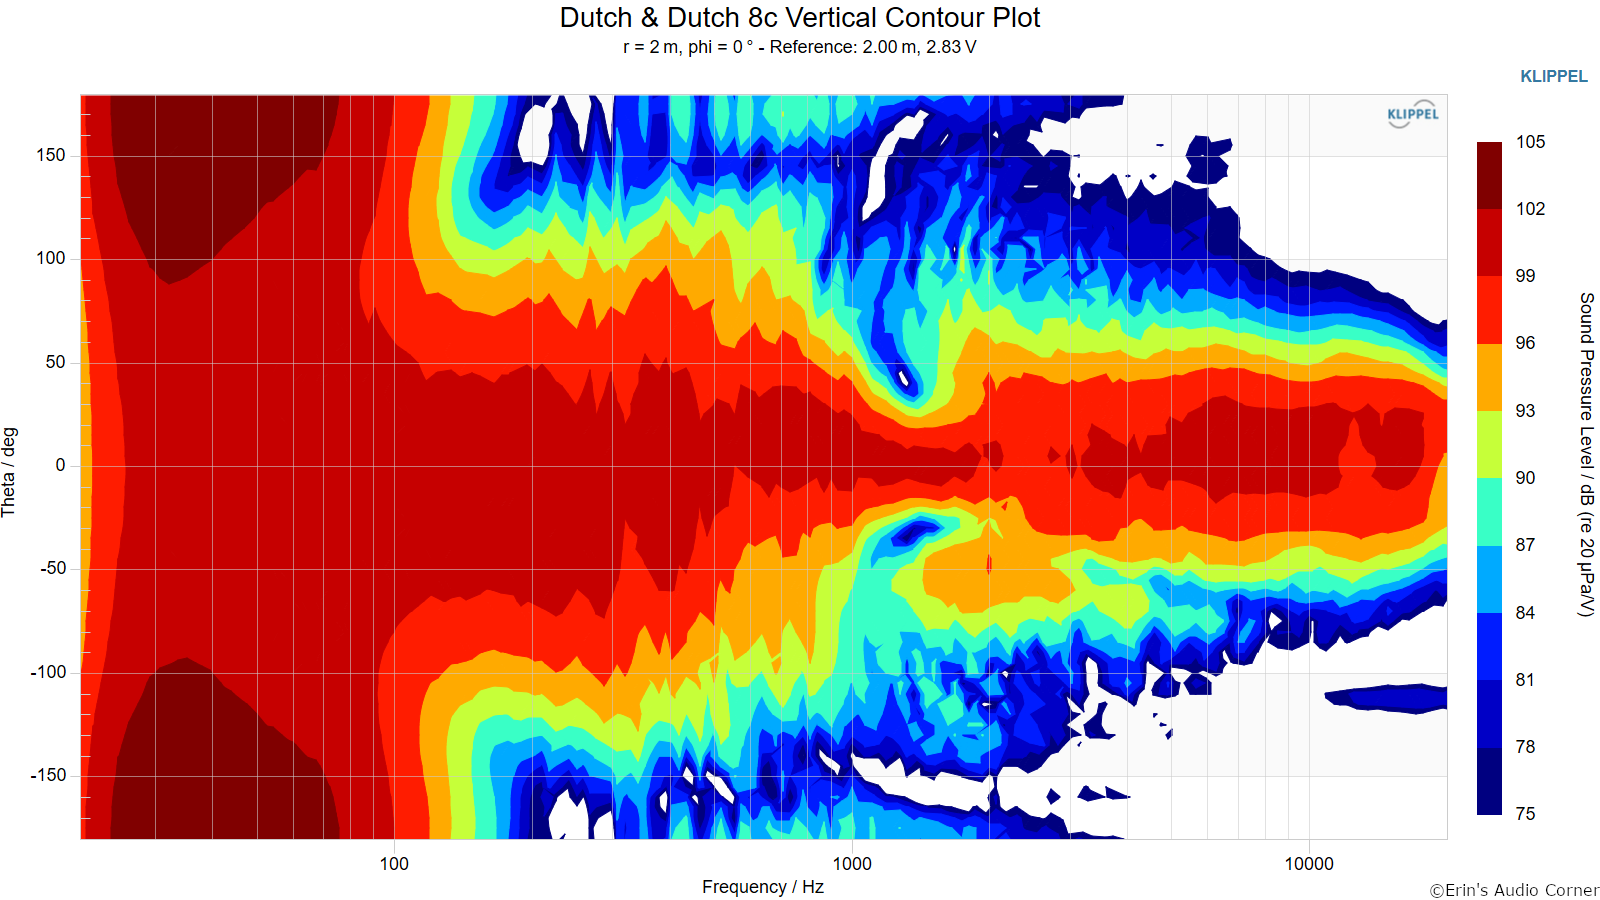
Vertical Contour Plot (not normalized):
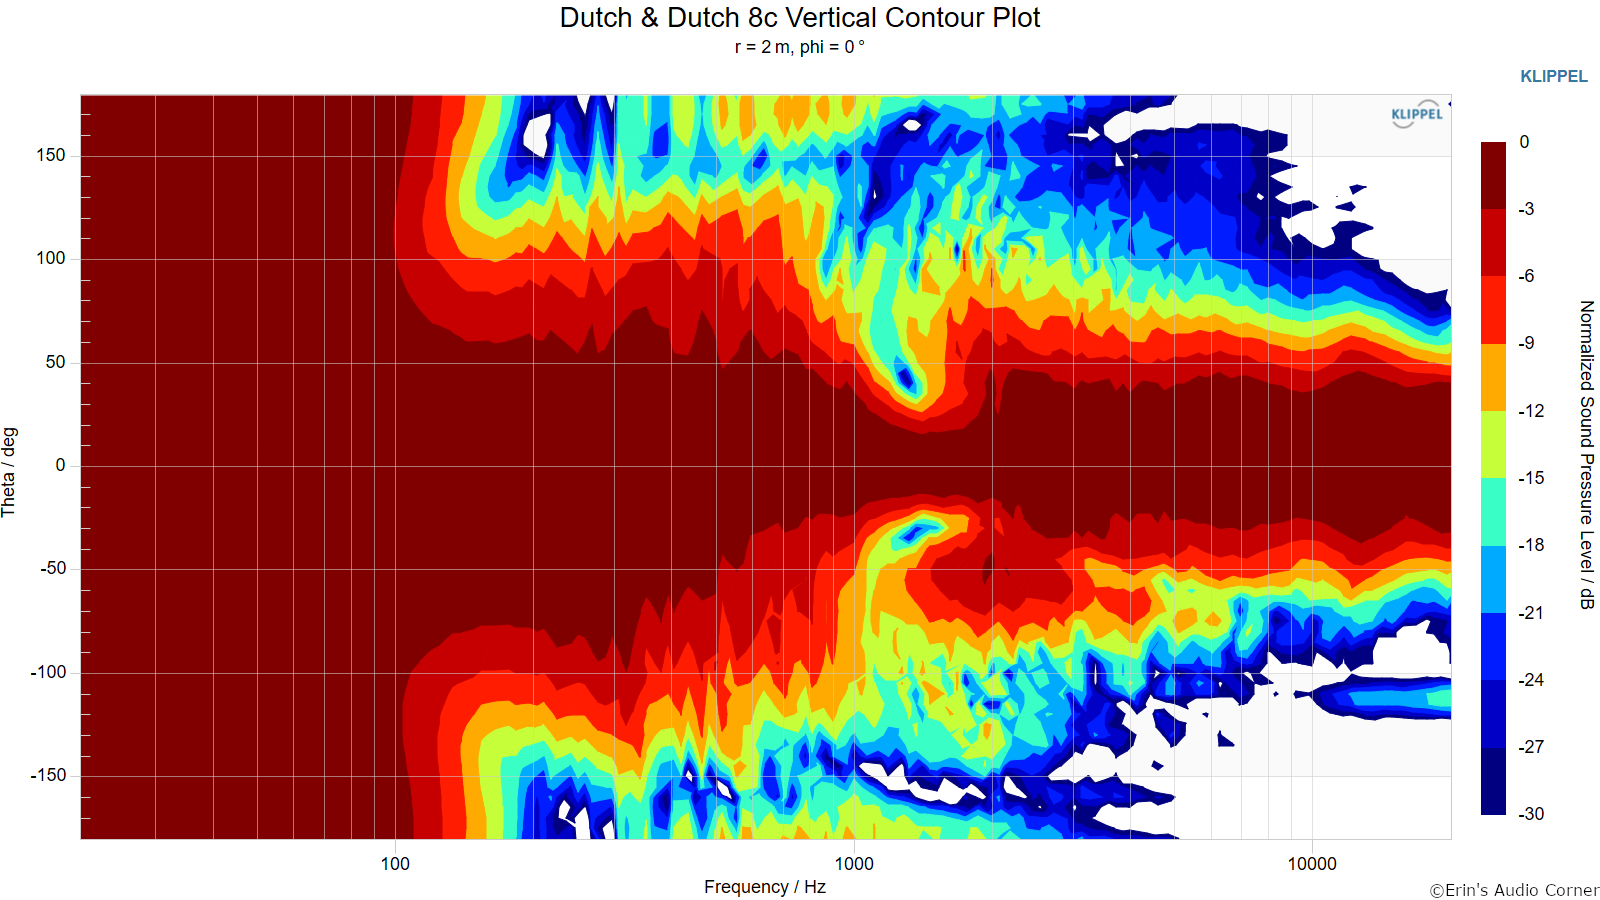
Vertical Contour Plot (normalized):
Additional Measurements
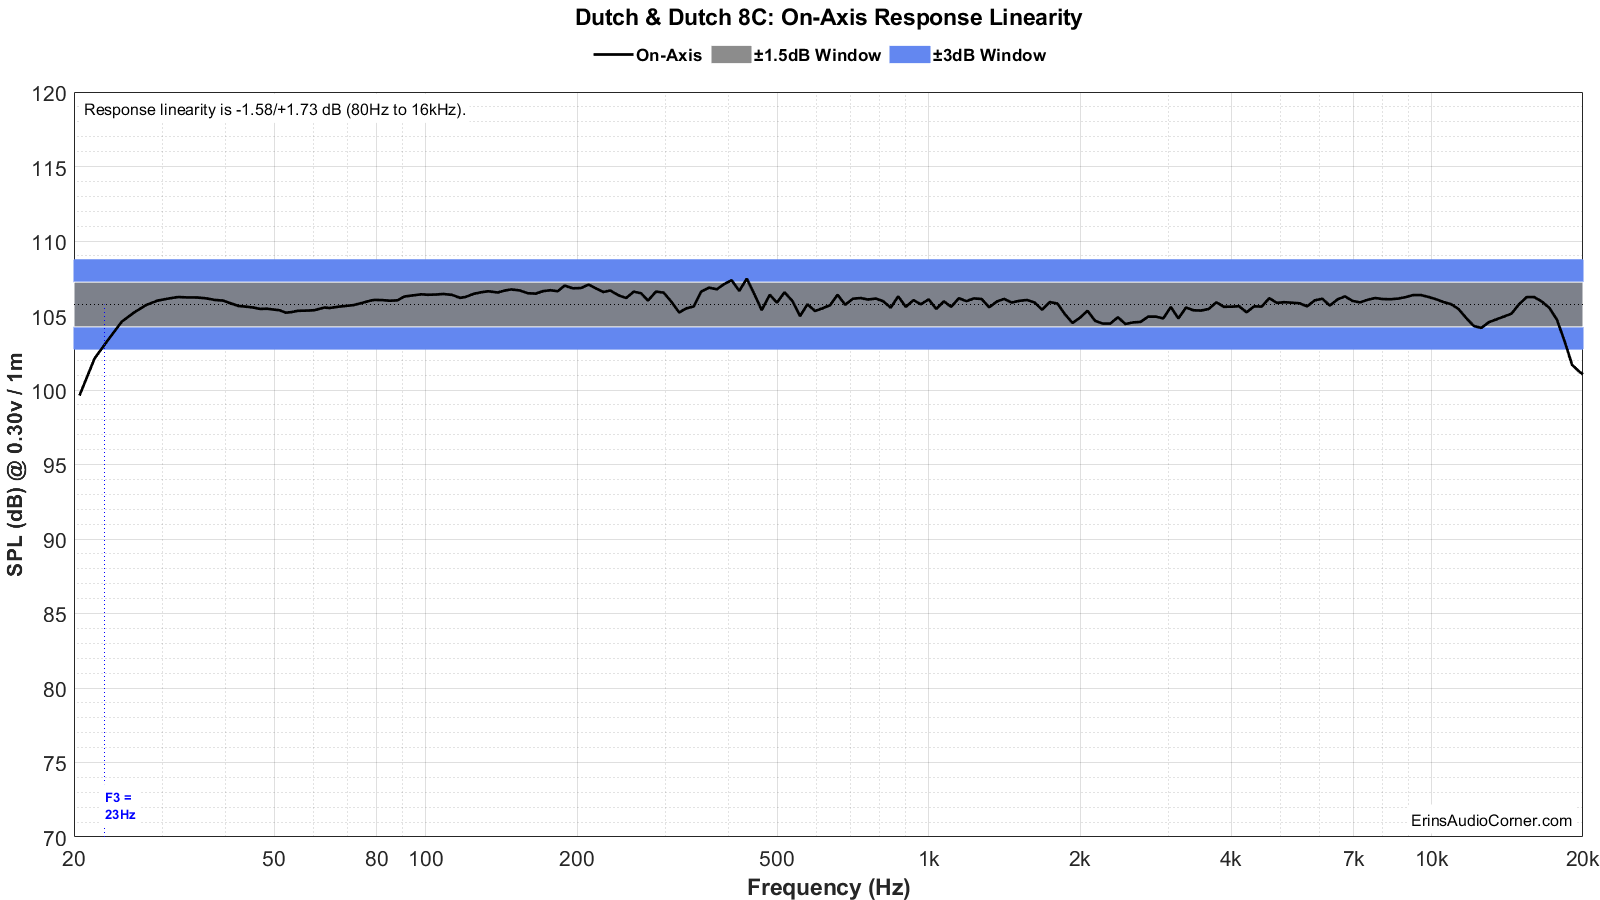
On-Axis Response Linearity
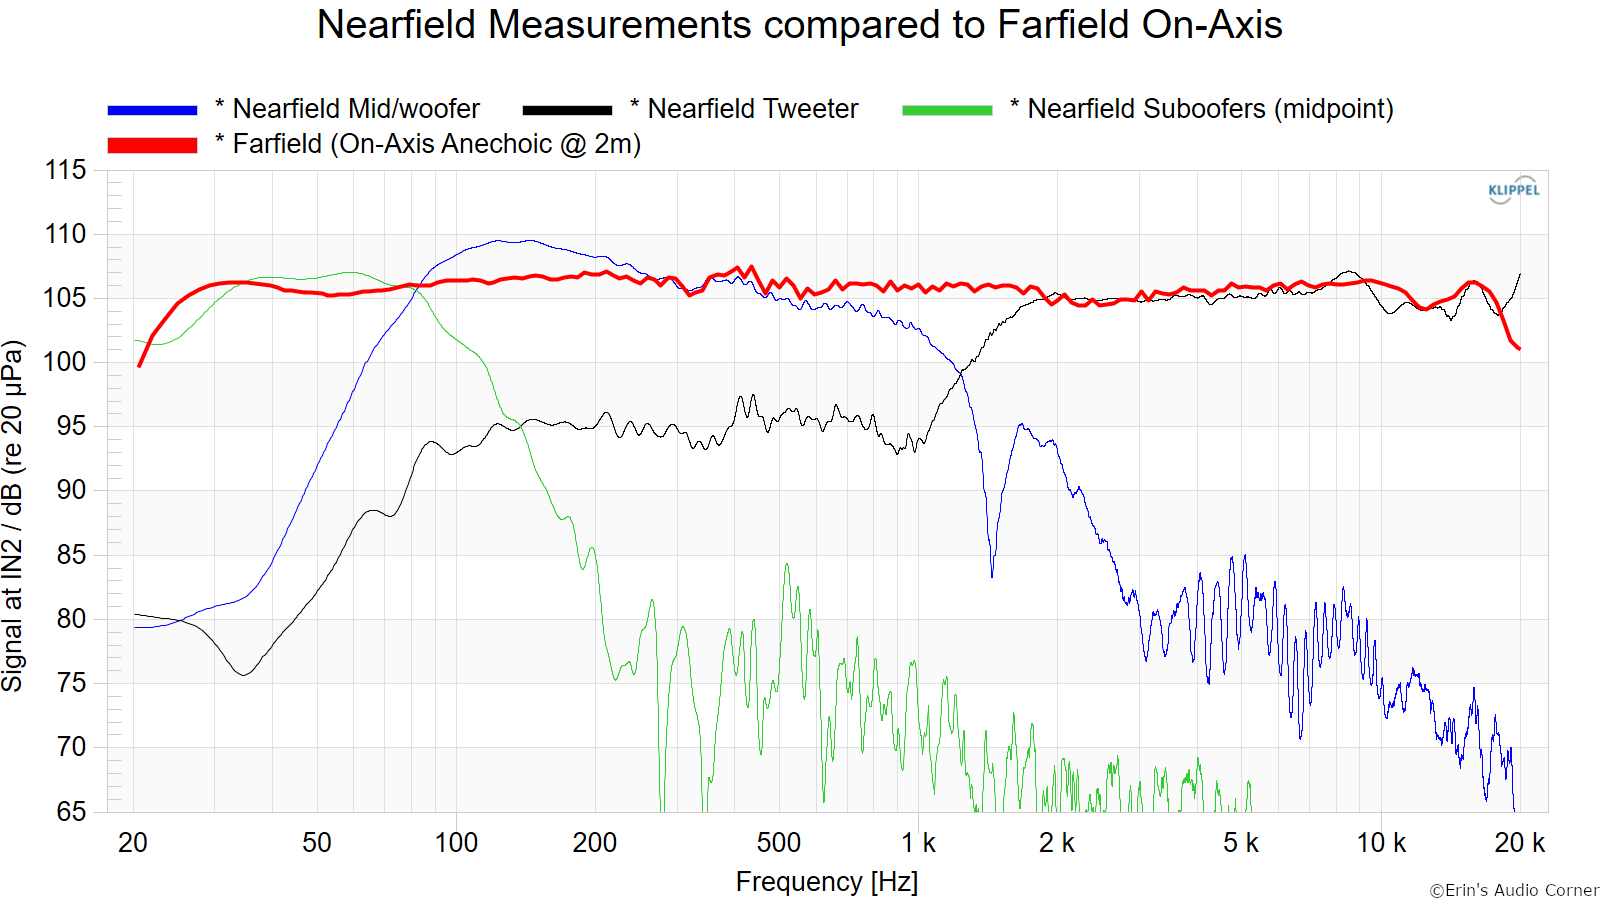
Near-Field Response
Nearfield response of individual drive units with anechoic on-axis response:
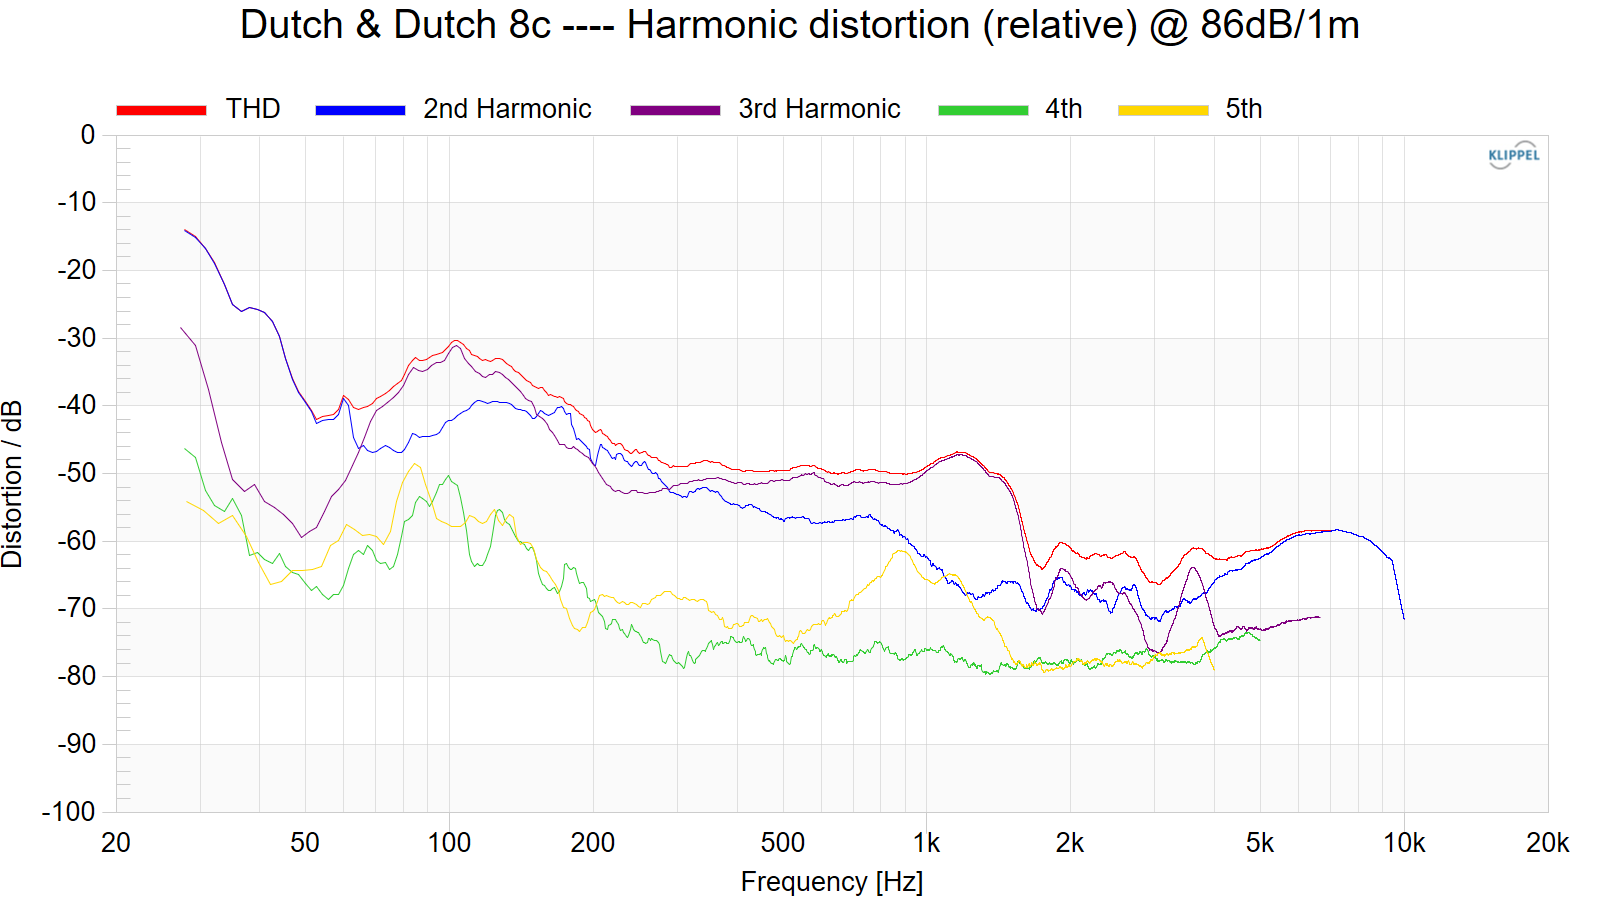
Harmonic Distortion
Harmonic Distortion at 86dB @ 1m:
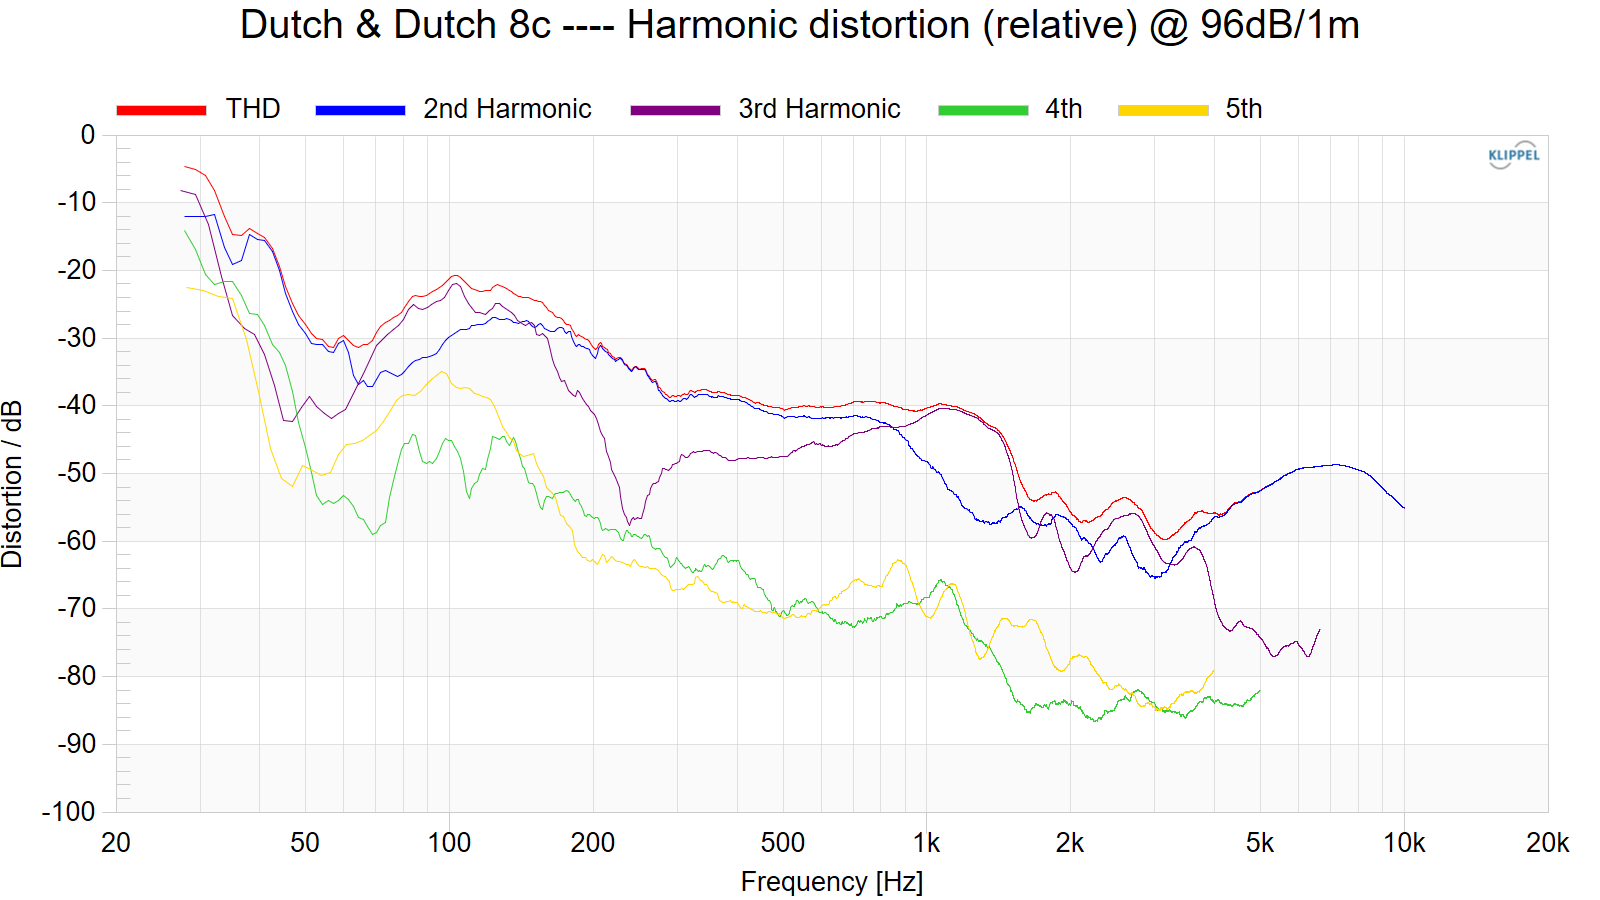
Harmonic Distortion at 96dB @ 1m:
“Globe” Plots
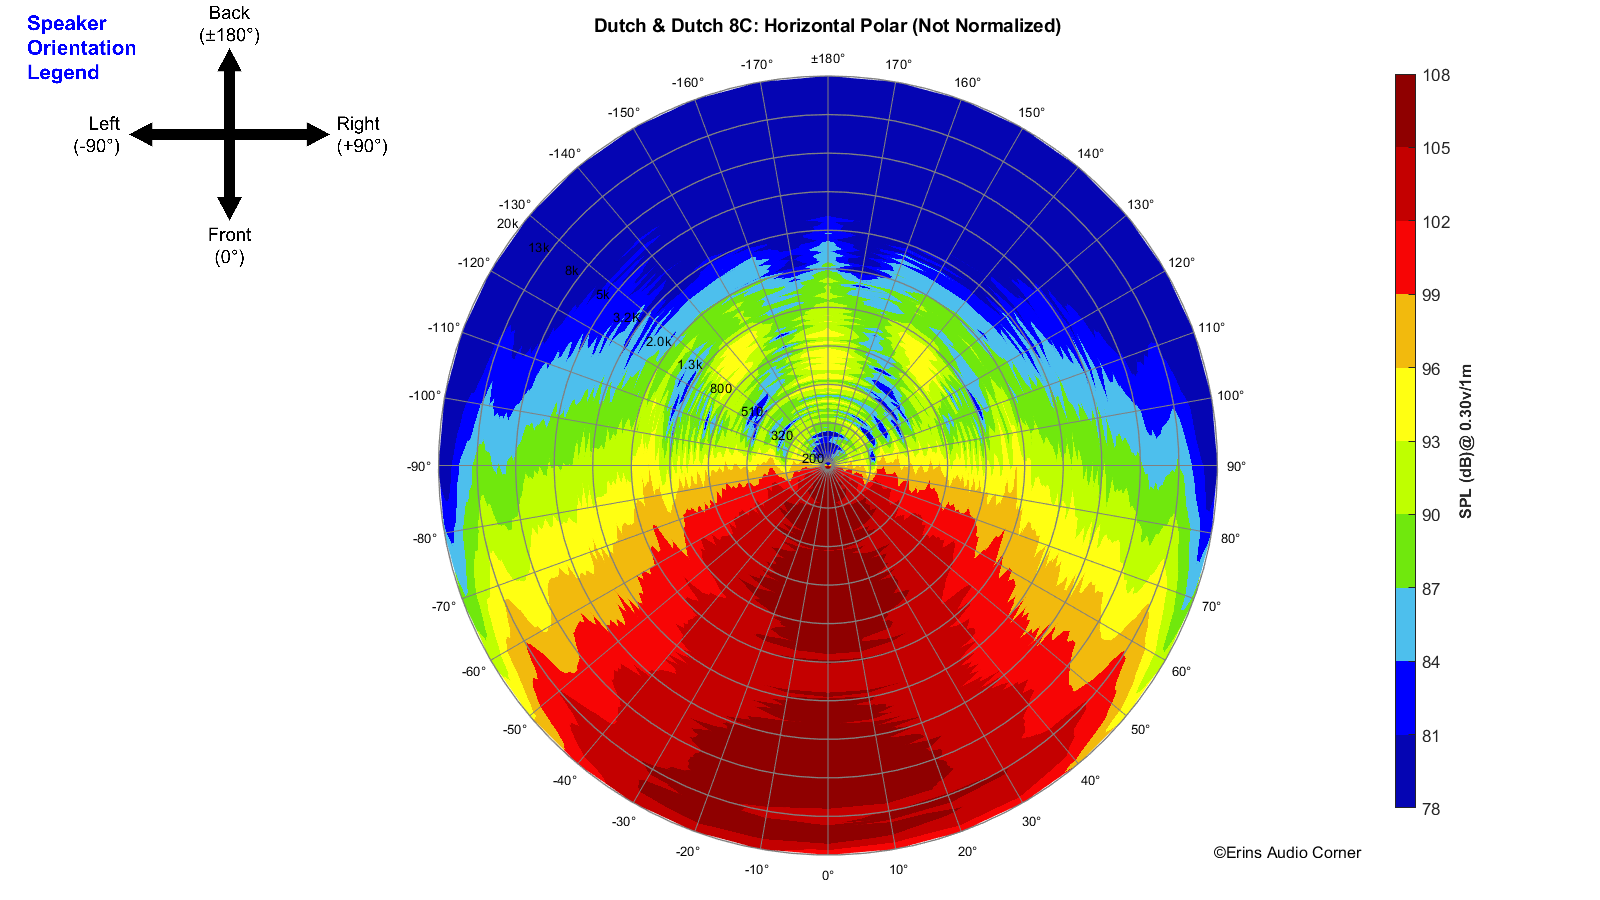
Horizontal Polar (Globe) Plot:
This represents the sound field at 2 meters - above 200Hz - per the legend in the upper left.
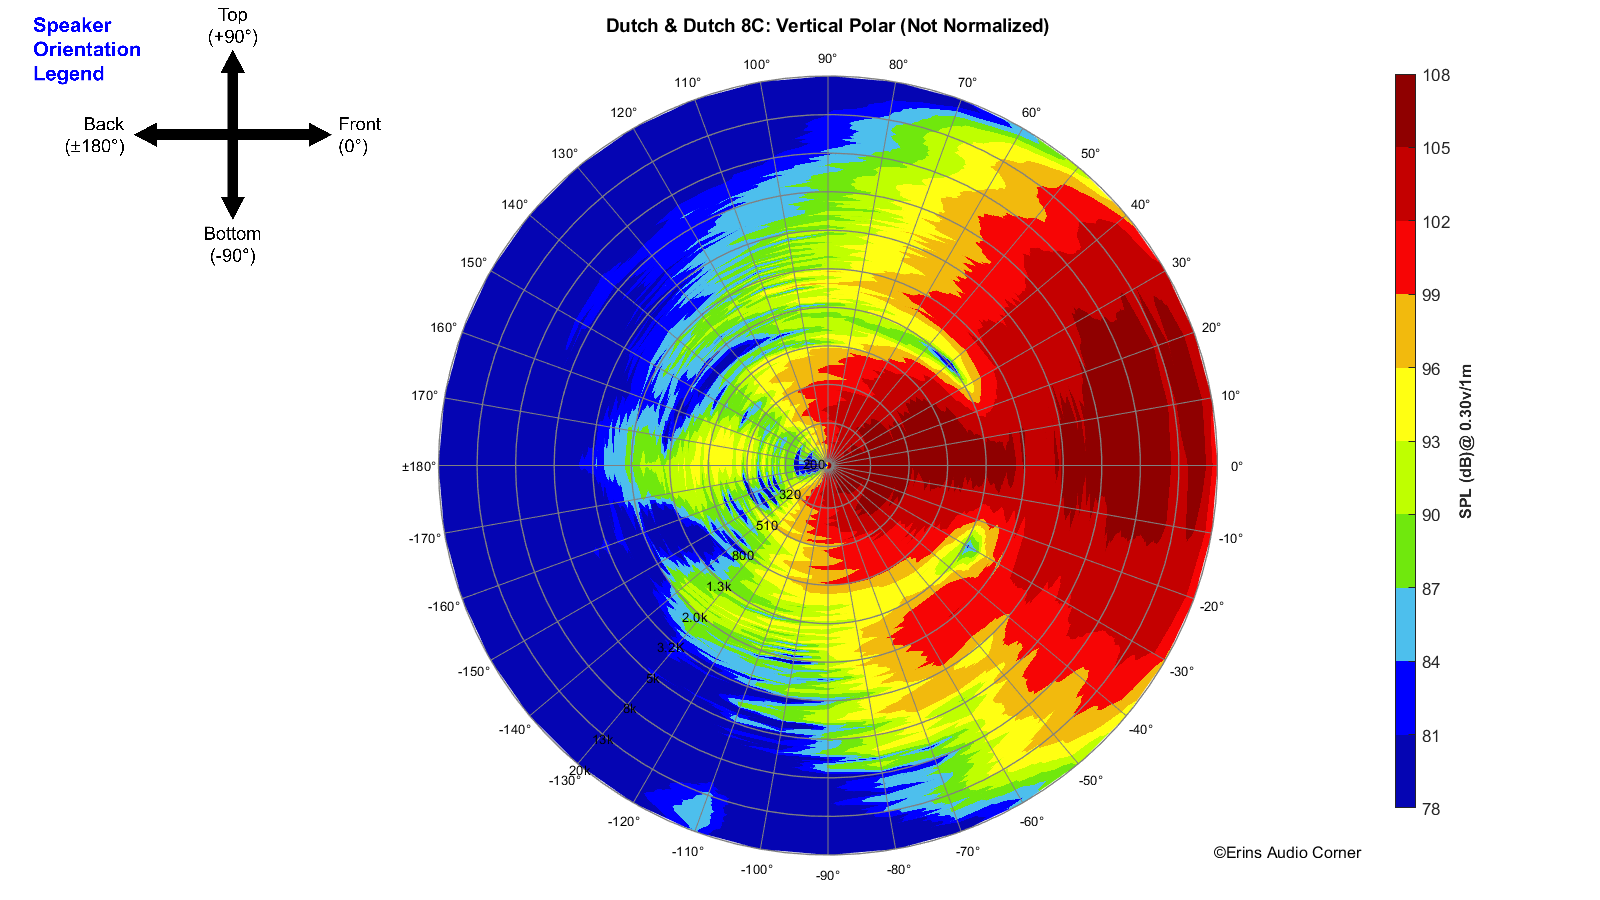
Vertical Polar (Globe) Plot:
This represents the sound field at 2 meters - above 200Hz - per the legend in the upper left.
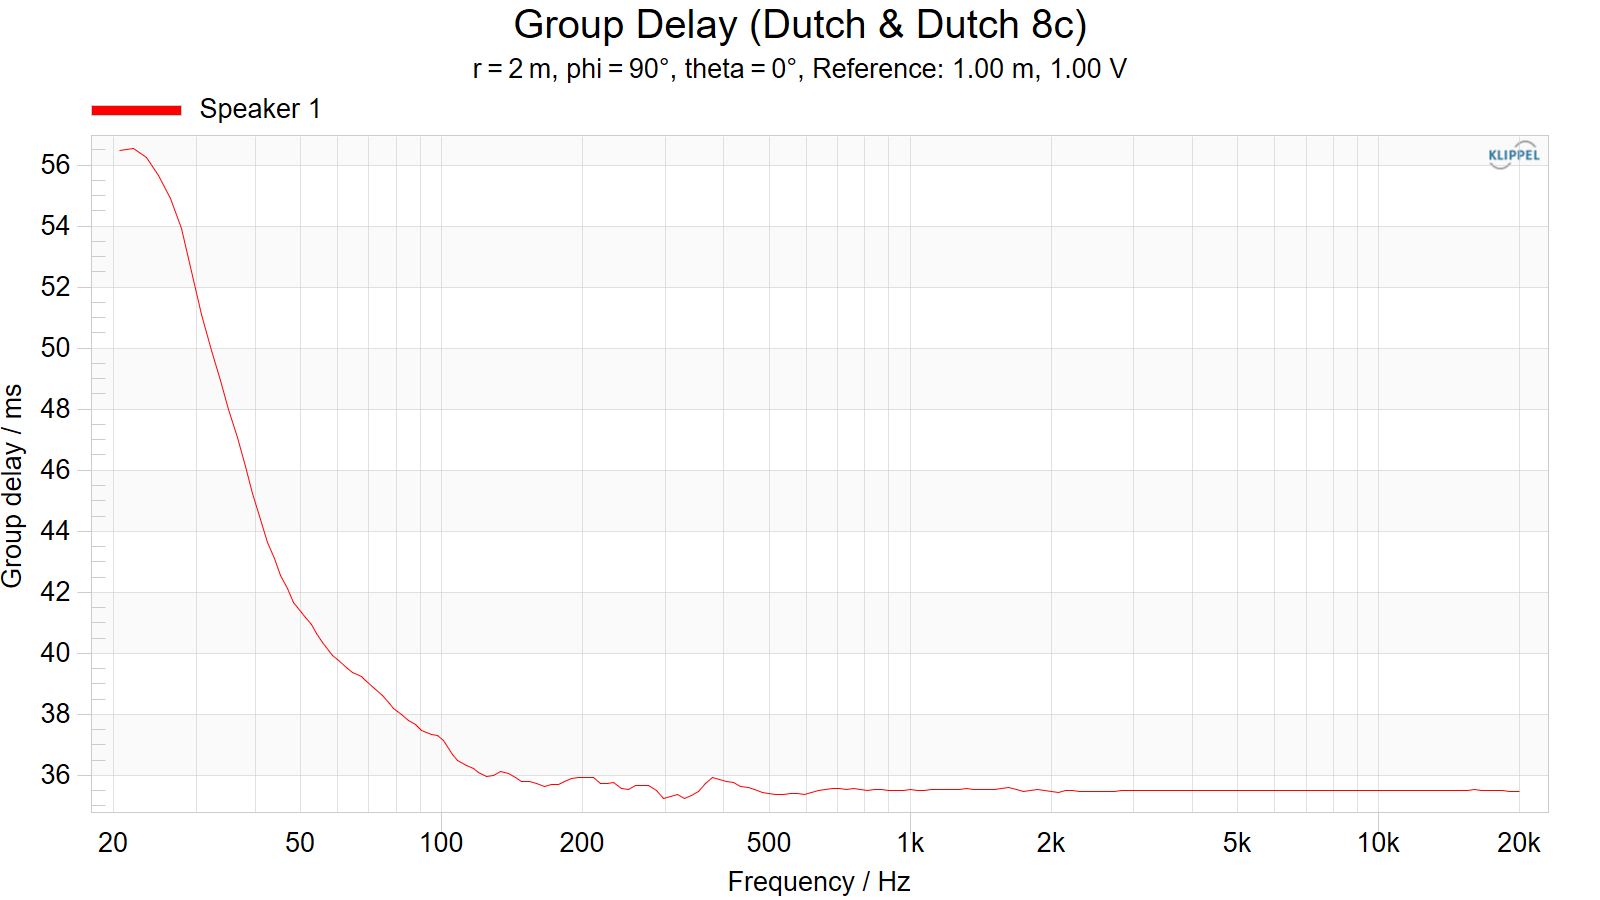
Group Delay (smoothed to 1/3-octave)
Dynamic Range (Instantaneous Compression Test)
The below graphic indicates just how much SPL is lost (compression) or gained (enhancement; usually due to distortion) when the speaker is played at higher output volumes instantly via a 2.7 second logarithmic sine sweep referenced to 76dB at 1 meter. The signals are played consecutively without any additional stimulus applied. Then normalized against the 76dB result.
The tests are conducted in this fashion:
- 76dB at 1 meter (baseline; black)
- 86dB at 1 meter (red)
- 96dB at 1 meter (blue)
- 102dB at 1 meter (purple)
The purpose of this test is to illustrate how much (if at all) the output changes as a speaker’s components temperature increases (i.e., voice coils, crossover components) instantaneously.

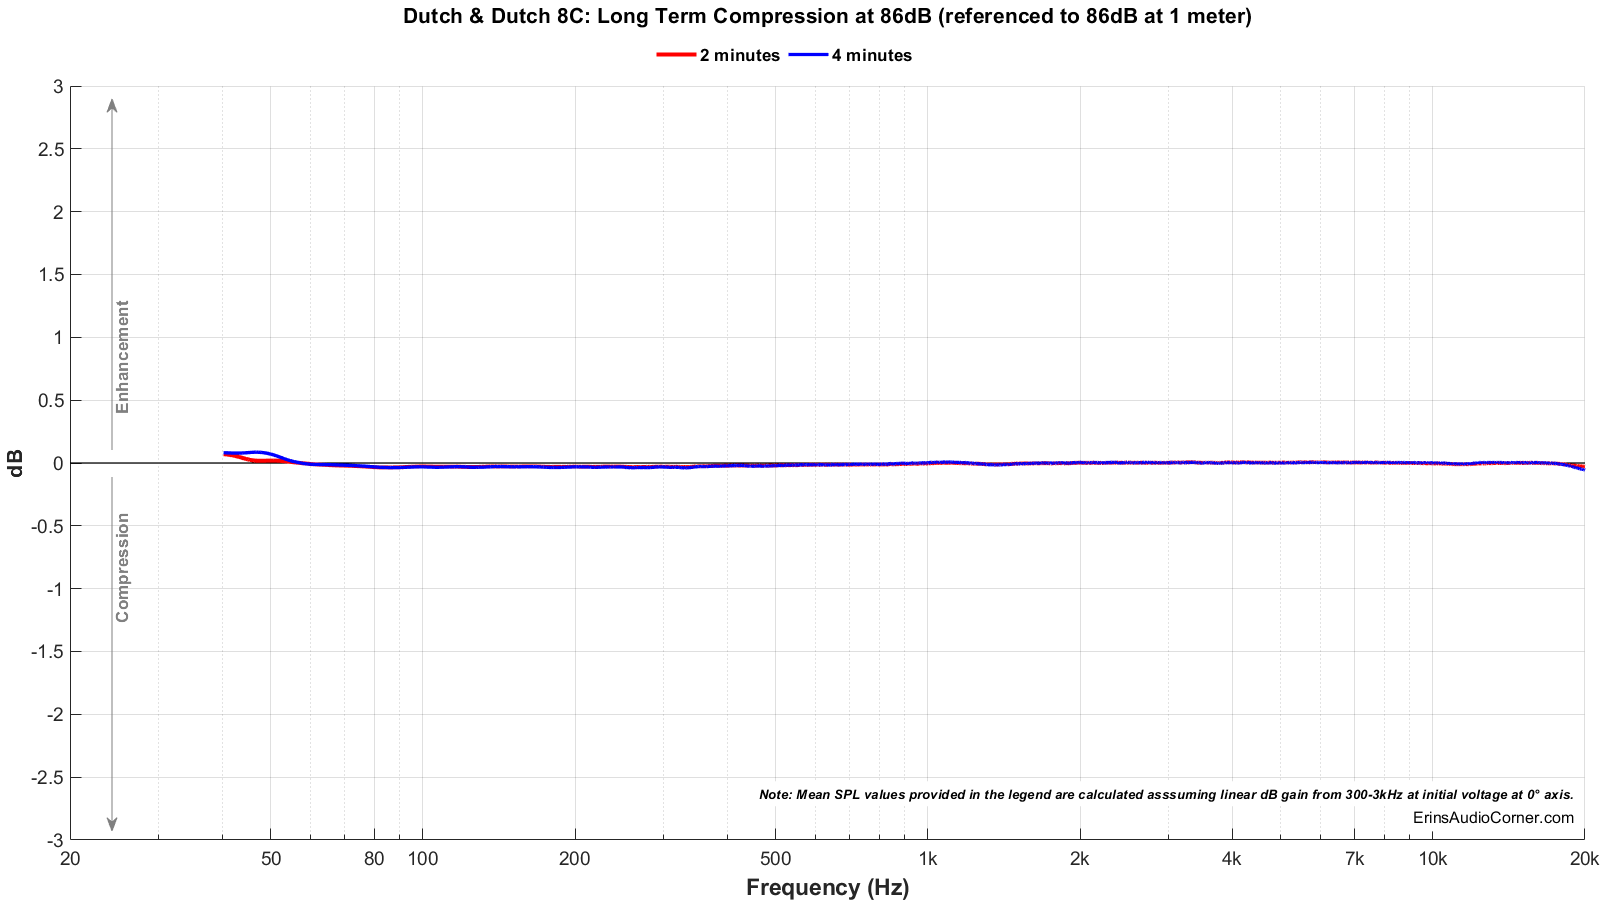
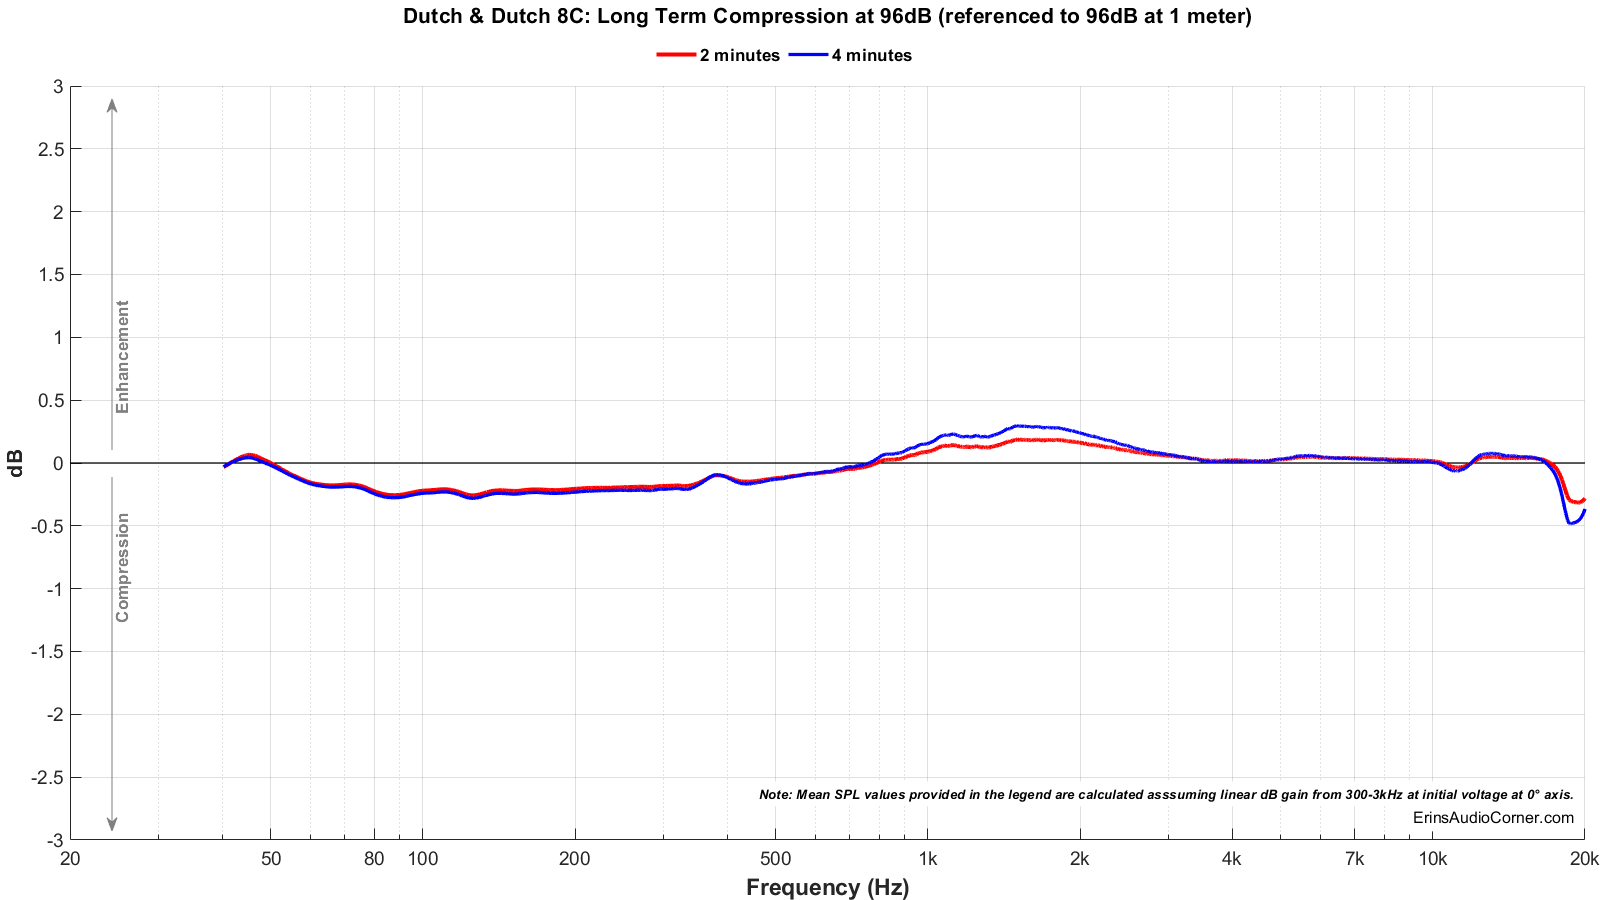
Long Term Compression Tests
The below graphics indicate how much SPL is lost or gained in the long-term as a speaker plays at the same output level for 2 minutes, in intervals. Each graphic represents a different SPL: 86dB and 96dB both at 1 meter.
The purpose of this test is to illustrate how much (if at all) the output changes as a speaker’s components temperature increases (i.e., voice coils, crossover components).
The tests are conducted in this fashion:
- “Cold” logarithmic sine sweep (no stimulus applied beforehand)
- Multitone stimulus played at desired SPL/distance for 2 minutes; intended to represent music signal
- Interim logarithmic sine sweep (no stimulus applied beforehand) (Red in graphic)
- Multitone stimulus played at desired SPL/distance for 2 minutes; intended to represent music signal
- Final logarithmic sine sweep (no stimulus applied beforehand) (Blue in graphic)
The red and blue lines represent changes in the output compared to the initial “cold” test.
Anechoic vs Boundary Loaded
These measurements are outside of my typical measurement set but I feel are necessary to provide additional insight in to the performance of this speaker. Thus, the “above and beyond” tag.
The Dutch & Dutch 8c is a speaker that breaks the norm. It is designed to be placed near a front wall in order to provide boundary gain. In order to achieve boundary gain, however, a typical speaker also loses timbre due to the rear wall reflections. With a cardioid speaker (such as the D&D 8c), the rear wall reflections are effectively “muted” and you are left with a forward-firing only speaker above 100Hz (below which, the subs are omnidirectional but cut off above this frequency sharply).
This presents a bit of a challenge when analyzing performance. Ideally you measure a speaker anechoically to see what happens when the room is not a factor in the performance. So, I did that using Klippel’s NFS which you saw above. This gave us all a baseline understanding of the speaker’s anechoic performance. However, I also needed a way to characterize performance in the situation it is designed for: near a boundary for below approximately 100Hz reinforcement. Therefore, I used high level engineering (see: scrap wood) to build a platform for the speaker so the subwoofers could load off the ground - effectively becoming the “rear wall”, if you will. And then I measured the performance in this manner. Now we have not only a full SPIN set of data for anechoic measurements but we also have a quasi-anechoic measurement via the ground plane method to see how the boundary loading changes performance.
Setup:
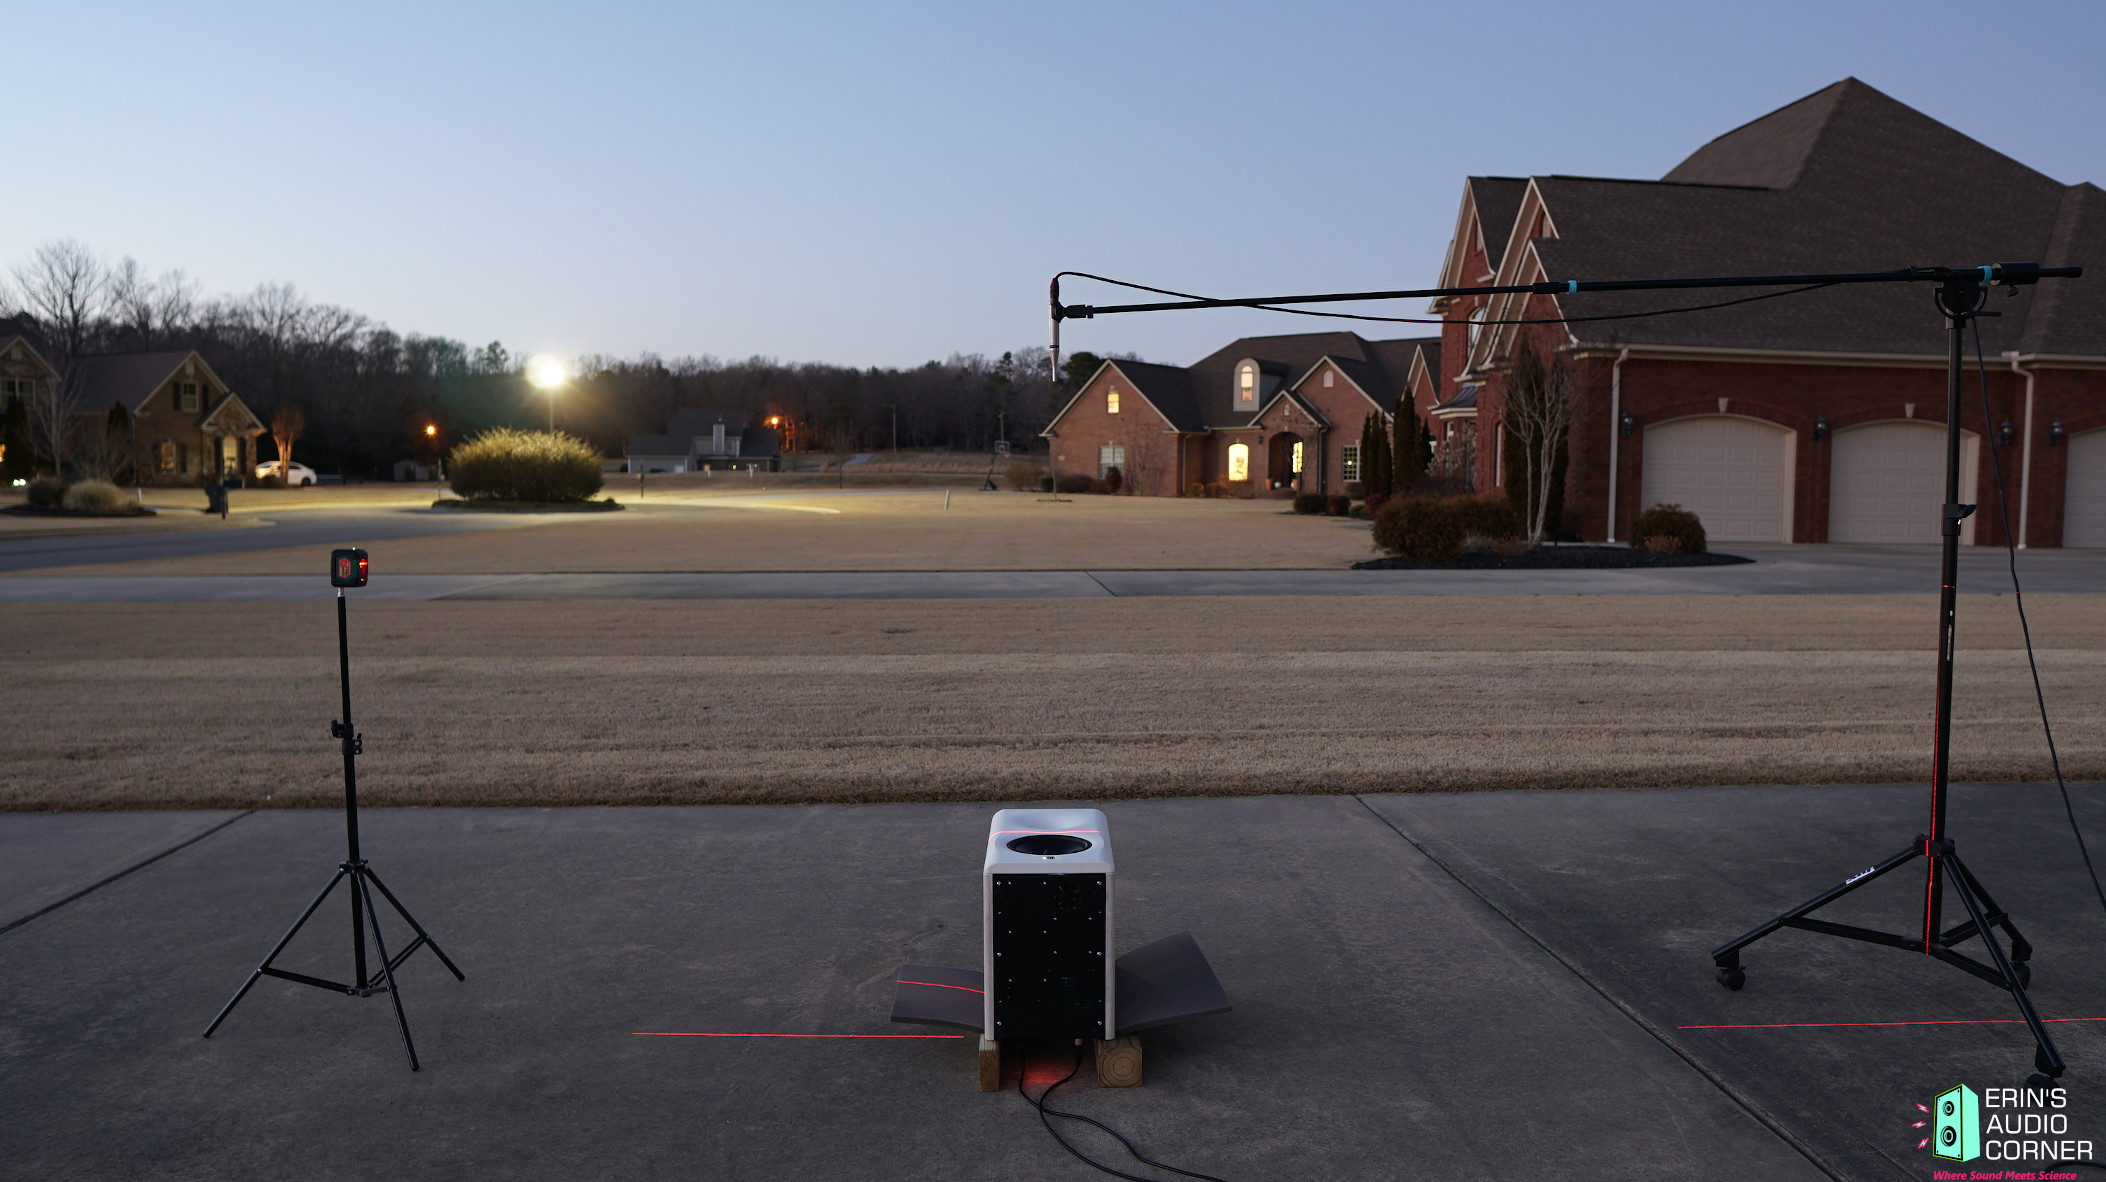
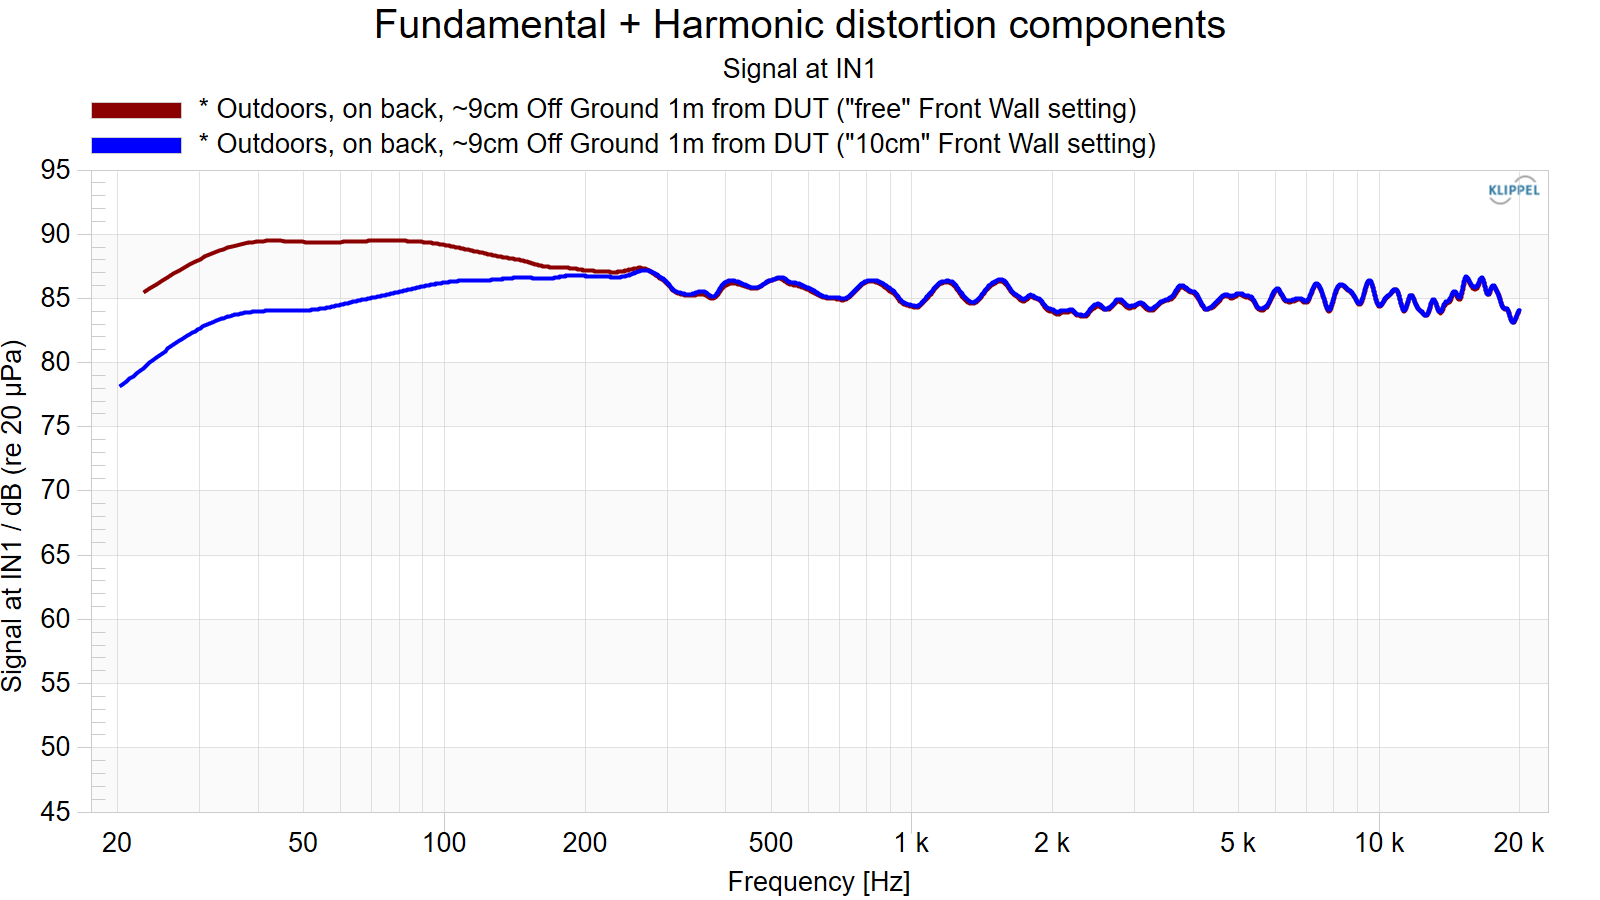
The 8c’s DSP settings were tested both “free” and set to “10cm” from the front wall. “Free” is essentially telling the speaker there is no rear wall behind it and there is no shelving of the bass. “10cm” is intended to emulate placement against a front wall in a real room and, when placed near a rear wall, will shelve the bass so the response is more neutral. As you can see in the below graphic, when the speaker is placed near a boundary and set to “free” the SPL increases from 0dB at 200Hz to approximately +6dB below about 80Hz. This gives us an idea of what to expect in a real room (to some degree). Ultimately, the takeaway here is that boundary gain works as expected and if you want a neutral response then the DSP should be set in accordance with the in-room front wall distance from the speaker.
Cardioid Performance
Conventional speakers are omnidirectional at low frequencies and become more directional at higher frequencies. Omnidirectional means that the sound is radiated 360° around the speaker. More directional means that the sound is “focused” more forward than it is behind or to the sides. For most bookshelf and floorstanding speakers, this is true below about 400-500Hz. Sometimes higher; sometimes lower. This is usually dictated by the size of the drive units used in the speaker.
A cardioid speaker - like the Dutch & Dutch 8c is designed to not be omnidirectional above a certain frequency, and in the case of the 8c that frequency is 100Hz. Why would this be useful? Well, remember, the 8c features subwoofers on the rear of the speaker. These subwoofers depend on boundary reinforcement in order for the response to extend as low as possible in frequency. The issue, typically, would be rear-wall reflections. If the 8c speaker had the upper midbass and lower midrange frequencies radiating backwards then there would be a high degree (no pun intended) of sound traveling rearward only to be reflected off the rear wall and back to the front of the speaker causing comb filtering in these lower frequencies. In terms of sound, this can (and typically does) result in marred tonality, impact and imaging of the mid-to-low frequencies at the listening position. The 8c claims to have “constant directivity” above 100Hz; something it does through its cardioid design.
How well does this actually work, though? Well, let’s take a look at the typical response of a generic studio monitor at 200Hz. The below graphic is a plot of the sound field of said speaker at 200Hz. This was generated using Klippel’s Near-Field Scanner and Visualization module. The story here is the sound is a big ball of energy, radiating in all directions. In front (illustrated by the red arrow), backwards, up and down. This energy is all practically the same SPL, too. Nothing new here. Typical of a standard monopole speaker.
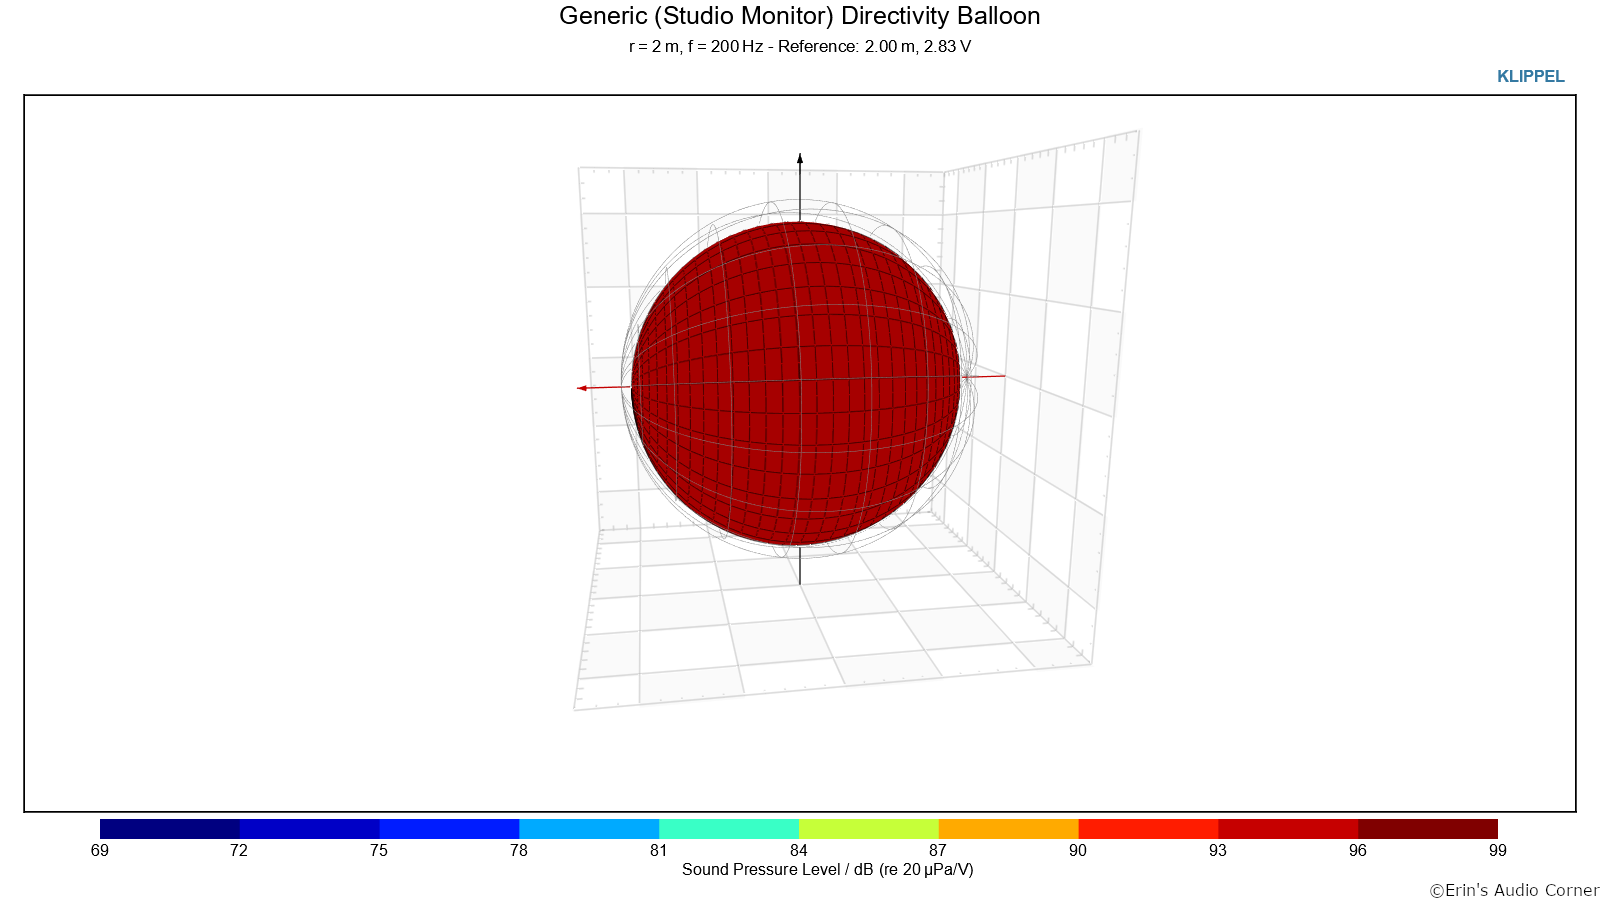
Now, let’s look at the response of the Dutch & Dutch 8c at 200Hz, below. What we see here is in stark contrast to the above. The first thing that stands out is there is practically zero sound radiating backwards (opposite of the red arrow). And what energy is back there is roughly 10-15dB down in level relative to what is firing forward.
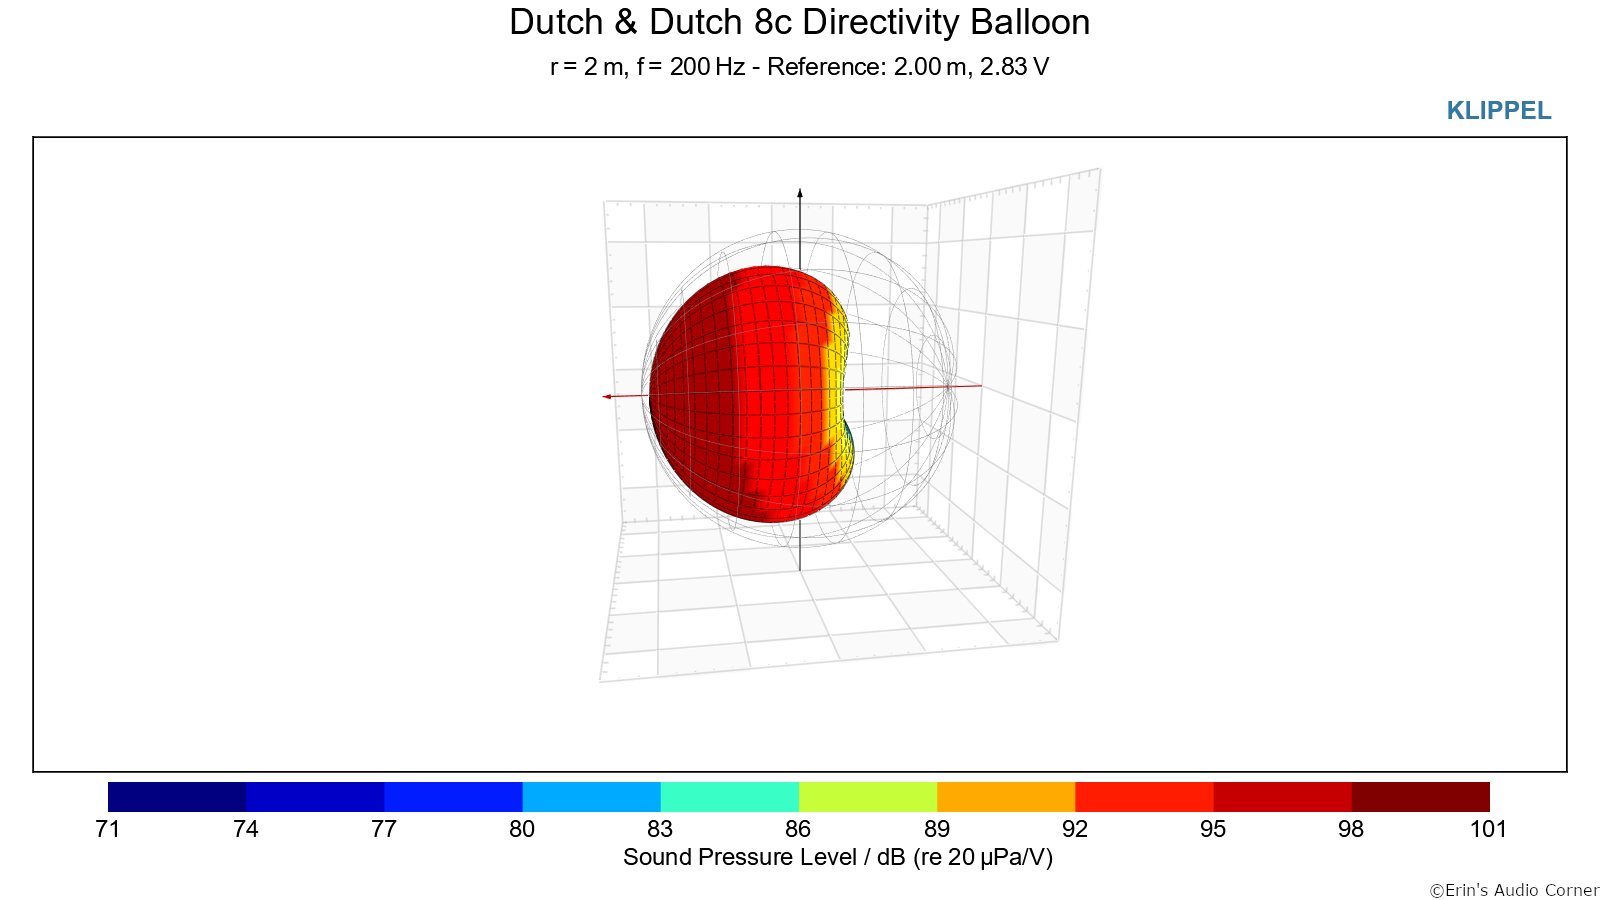
What does this mean? This means the 8c is a very well designed cardioid speaker. The manufacturer claims as much. And this data backs it up.
Just for fun, I went another step and have provided a gif of the sound radiation at varying frequencies below. A few notes about this gif:
- Look how the response is completely omnidirectional at 50Hz but practically all forward firing by 150Hz and by 200Hz is forward firing.
- You can see there is a mismatch in directivity in the crossover region (as illustrated by the balloon shape not being quite spherical at 2000Hz). This is also seen in the CTA-2034 data set.
In-Room Measurements from the Listening Position
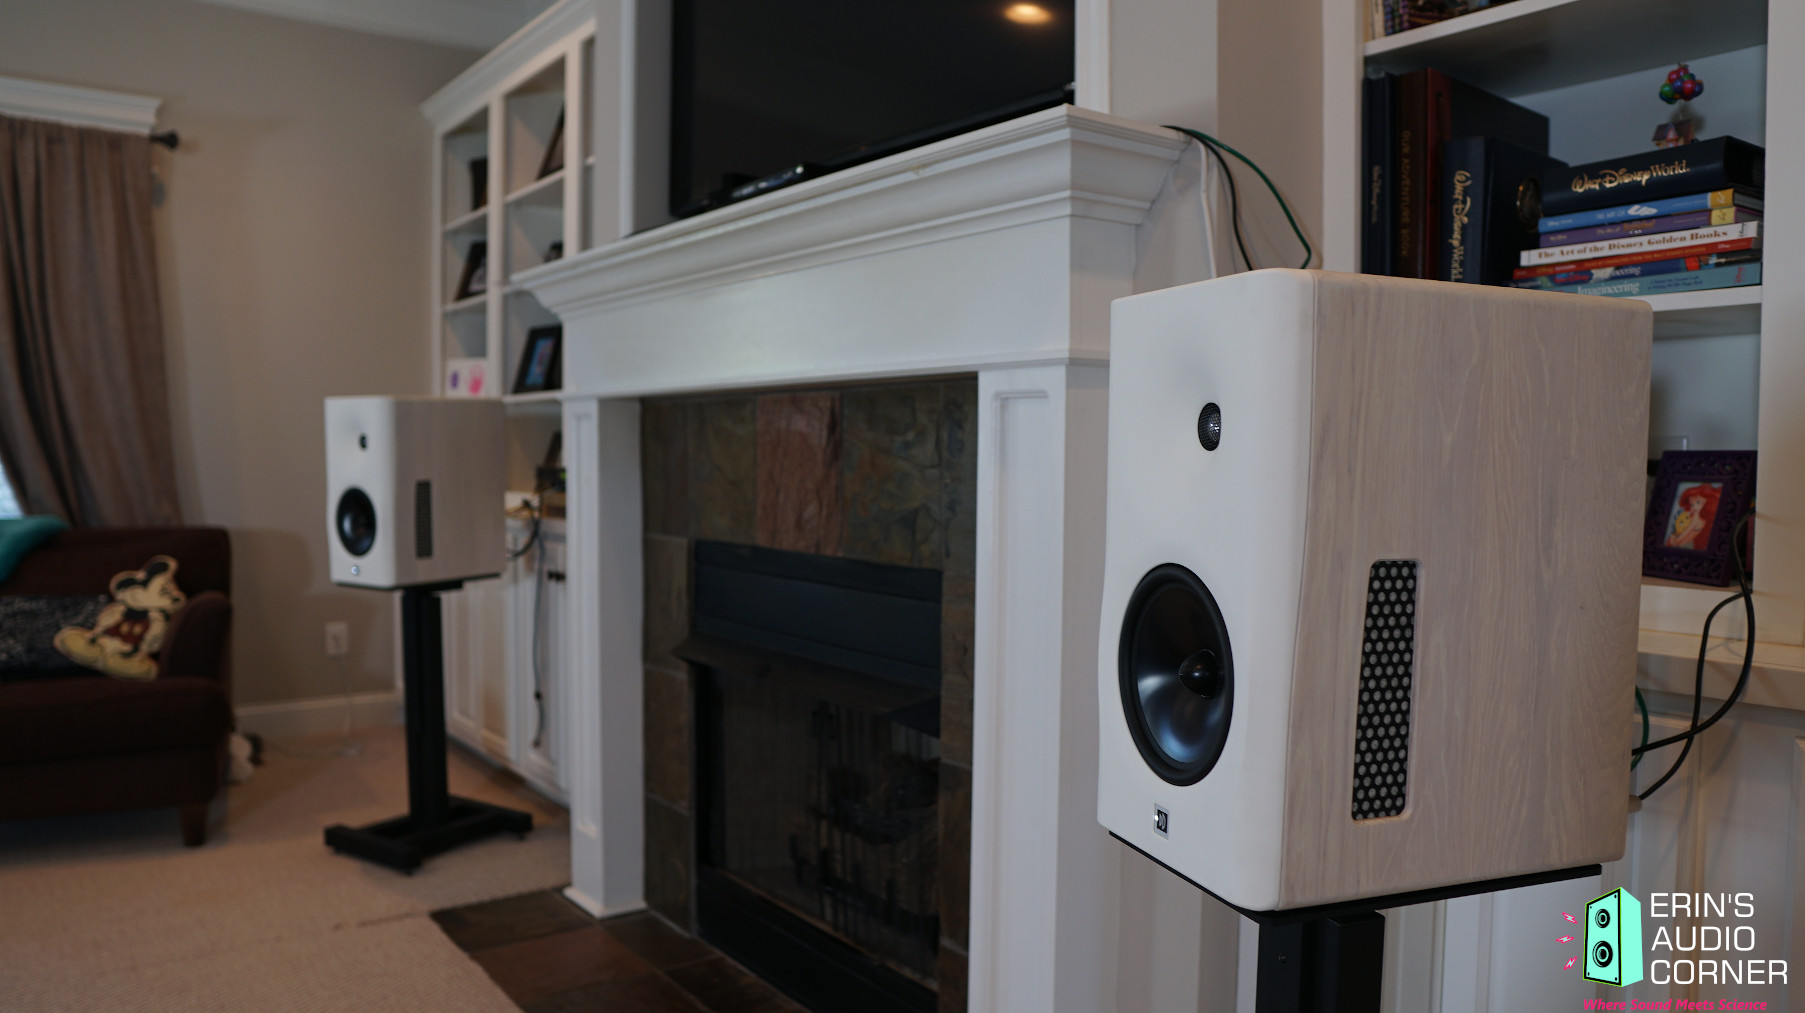
Below is a photograph of the speakers set up in my living room. The speakers were placed approximately 80cm from the front wall (not the cabinets; but the actual wall). The listening position was approximately 4 meters from the speakers.
Below is the actual measured in-room response (with no DSP correction). This is a spatial average taken over approximately 1 cubic foot. As you can see, the actual in-room response aligns quite well with the prediction generated from the SPIN data. Pretty cool to see how anechoic measurements can reliably predict the actual in-room response. I feel many others often overlook this powerful benefit of the SPIN data.
Black = Predicted In-Room Response from SPIN data
Teal = Actual In-Room Measured Response from Main Listening Position
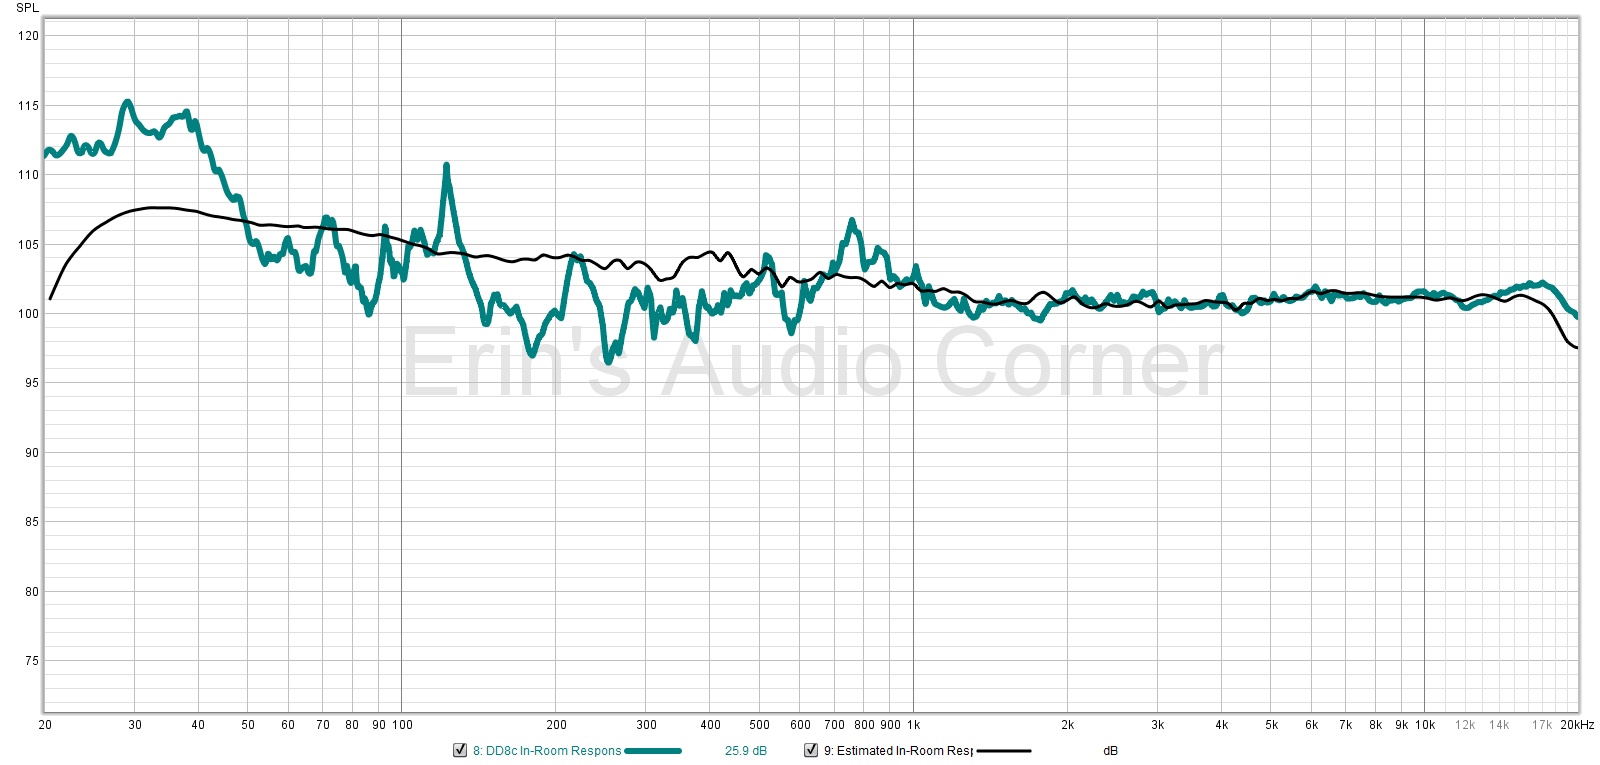
Below 1kHz we see more deviation from the prediction. This is expected. My couch, the back wall behind where I sit, the end table and the lamp near the listening position all have an effect on the measured response. The dip from 150-400Hz is caused by the rear wall and/or couch as when the microphone is moved in to the center of the room the dip fills in. The thing I notice here, though, is just how well behaved the room modes are above 100Hz. There are a few but they are much less severe than other in-room measurements I have taken of past speakers. One has to think this is attributed to the cardioid nature of the 8c speakers.
In this example, the 8c speakers were set to 80cm from the front wall in the DSP. This helps attenuate the bass to a more neutral response based on the prediction of the boundary loading (approximately +6dB below 100Hz). However, the room still has its say and I ended up with a +12dB response at 30Hz compared to 1kHz. That’s a lot of bass from a (albeit large) bookshelf speaker. Free bass is never a bad thing; especially with a speaker like this which has built-in DSP to attenuate such things if they are cause for concern.
Parting / Random Thoughts
I encourage you to watch my YouTube review for more details but a quick few notes:
- This speaker sounds phenomenal.
- Objectively speaking, the data indicates this is a terrific speaker. It is roughly ±1.5dB from 30Hz to 18kHz. That’s incredible.
- The data does indicate something - possibly a resonance - around 400Hz which appears to be caused by the 8-inch midrange (judging by the nearfield response). However, there was no hint of this when I specifically listened for this as an issue. Therefore, it could be another source or simply inaudible (Toole discusses this in his book )
- There is also a mild directivity mismatch at the crossover, but I am impressed it is so minimal given the size of the midrange and the center-to-center spacing of the tweeter/midrange. Of course, the 1250Hz crossover helps to alleviate this, though one expects an increase in distortion from the tweeter with such a relatively low crossover point. While the distortion profile is higher at 1kHz than at 2kHz , it appears this portion of the distortion profile is due to the midrange and not the tweeter. sdw There is no way to know for sure without testing the raw drive units with implemented crossover but I think that’s too far down in to the weeds (even for me).
- Speaking of distortion, yes, the measured harmonic distortion is relatively high. But, in my listening tests I had this speaker playing as high as 105dB @ 4 meters with no audible distortion other than the things that were buzzing in my living room. I even used test tones to see if I could hear the distortion in my MLP but, alas, the fireplace was vibrating as were some of the items in the bookshelves. Not to mention room modes. I’m not saying that someone else couldn’t hear the distortion if trying. But in my case, in a real living room with other things about, the distortion measured didn’t correlate to distortion heard if for no other reason than it was masked by all the things that make a real room a room. Aside from THD/HD profiles, the real “selling point” was the lack of mechanical issues. I have had numerous speakers in my room that couldn’t get past 90 or 95dB without bottoming out, flopping around, or otherwise emitting audible issues. These issues are much, much more audible than distortion. And in all of those cases, those issues still remained even when a HPF was implemented to help diminish those things. Yet, at >100dB, the DD8c speaker had no such issues while playing down to 20Hz. I can’t name another speaker I have tested thus far that has done this. Not even the venerable F226Be which rolled off at around 50Hz. I’m not making excuses. I have no reason to. Truthfully, I was surprised by the relatively high level of HD components. But, in my real-world listening they didn’t manifest in to issues. YMMV.
- The soundstage is something to behold. I truthfully expected, with the controlled directivity nature above 100Hz, that there would be less room interaction from the side walls and that would hurt the apparent source width (ASW), thus causing a more narrow soundstage. Um… Nope. Quite the opposite. Images were way outside the range where I expected and where I have heard with speakers with very wide radiation patterns. Crazy.
- The tonality of the speaker is great. The data indicates this should come as no surprise.
- The in-room response was +15dB at 30Hz. Yes, you read that correctly.
- Subjectively speaking, the maximum output SPL was approximately 100dB at the main listening position (4 meters away) for the pair of speakers playing full range (20Hz to 20kHz). Above this volume, I felt a bit apprehensive pushing the speaker further (I don’t own it and it isn’t cheap). 100dB full range at 4 meters is very loud.
- Integrating Room EQ Wizard DSP correction in to this speaker was not only a treat but incredibly easy.
- No audible “hiss” (problem with many powered speakers).
- I used these speakers both analog and digital. When using digital, I used this (relatively) $95 Hosa ODL-312 Optical SPDIF and AESEBU Digital Format Converter. This served to allow me to send my TV’s audio signal via optical output to the 8c speakers, thus enabling me to use all sources (TV, AppleTV, Blu-ray player).
- If you have the means and are considering this speaker, I recommend it.
As stated in the Foreword, this written review is purposely a cliff’s notes version. For more details about the performance (objectively and subjectively) please watch the YouTube video.
Contribute
If you like what you see here and want to help me keep it going, please consider donating via the PayPal Contribute button located below. Donations help me pay for new items to test, hardware, miscellaneous items and costs of the site’s server space and bandwidth. All of which I otherwise pay out of pocket. So, if you can help chip in a few bucks, know that it’s very much appreciated.
You can also join my Facebook and YouTube pages if you’d like to follow along with updates.