*Update 02/2020:
The results of this driver’s measured performance and unit-to-unit consistency have caught me a lot of grief as of late. Namely from people questioning my test methods and blaming me for my suggestion based on what the data shows.
In regards to my suggestions for usability from 300-2khz, I reference back to the mfg spec that shows a similar FR swing. I’ve found others who have used this use a similar range as well.
As for the unit-to-unit consistency the way I see it is: either the units 1) were somehow mistreated before they were sent to me or 2) really do vary this much. I’ve been tempted to remove this review entirely from my site due to concerns that it is #1 above. On the other hand, I would feel obliged to leave them up if it’s #2 above.
So, I’ve decided to compromise. I’ve made this update to my review and noted the concern over consistency. But I’m still leaving the data up.
Erring on the side of caution would mean you ignore the unit-to-unit consistency and instead focus on the single test sample I reviewed. In which case, my suggestions regarding performance in the Wrap-Up at the end of this review still stand.*
Thanks, Erin
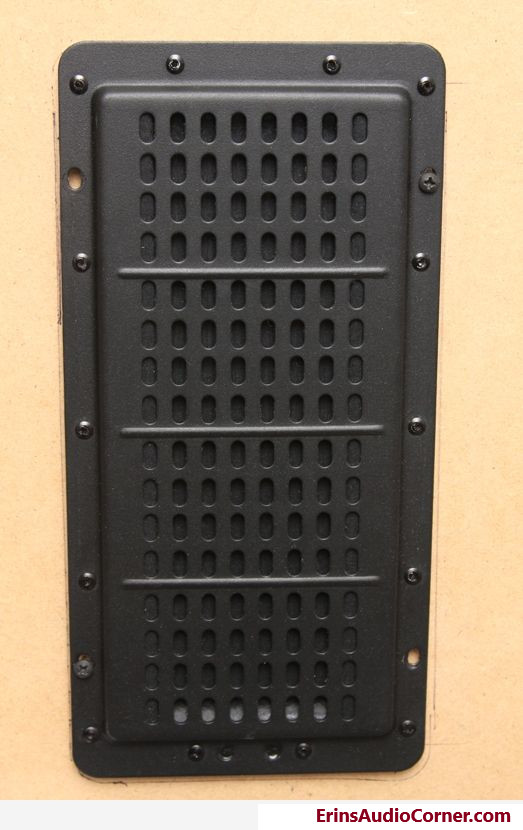
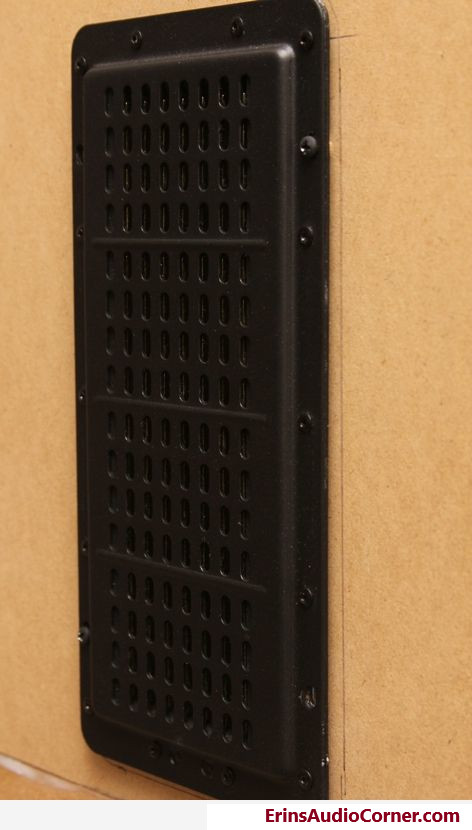
A fellow on the Parts-Express forum (tech-talk) sent me four of the Bohlender Graebener Neo10 Planar Transducers drivers to test and check for consistency. I normally don’t see the need but figured it’d be interesting so I obliged.
I tested each driver’s impedance, frequency response and relative harmonic distortion. I added each driver’s respective result to the same graph for comparison purpose. I then chose one of the drivers to do further testing on. So what we have is the typical suite of data plus unit-to-unit comparison data. I hope you enjoy!
Driver Comparison Testing
Let’s first start with the comparison data. All four drivers were tested in the exact same fashion. One was tested, then removed from the baffle and the next was added. The mic never moved and all the impulse responses were windowed to the exact same time(s). Therefore, the only variant in each test is the driver itself.
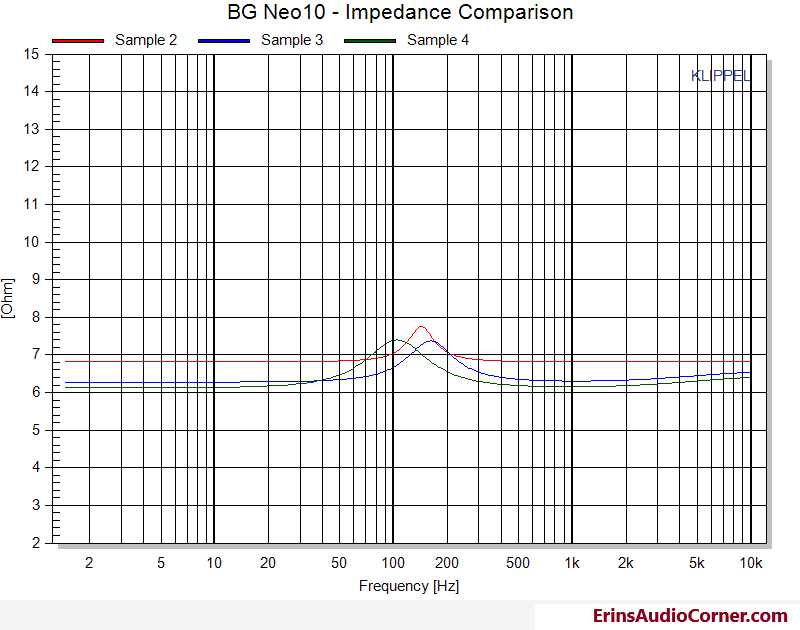
Impedance Comparison
As stated above, I received (4) of these drivers to test. However, I didn’t sweep the first driver sample for impedance so there are only (3) samples in the impedance data.
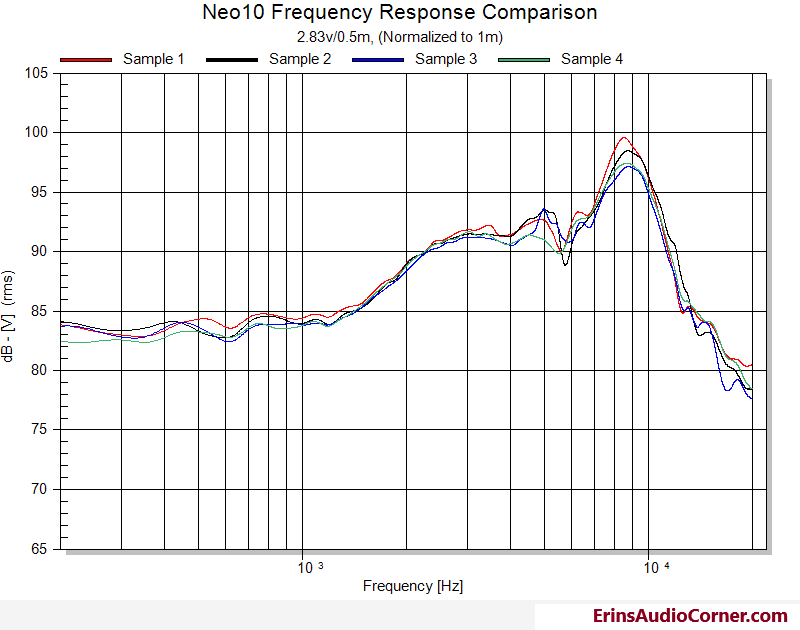
Frequency Response Comparison
The comparison testing for FR & HD was done at one-half meter, with 2.83v input signal. The results on the FR below were each attenuated 6dB in order to provide a normalized 2.83v/1meter response SPL.
This response is in the horizontal plane only. I did not test repeatability in the vertical plane.
Harmonic Distortion Comparison
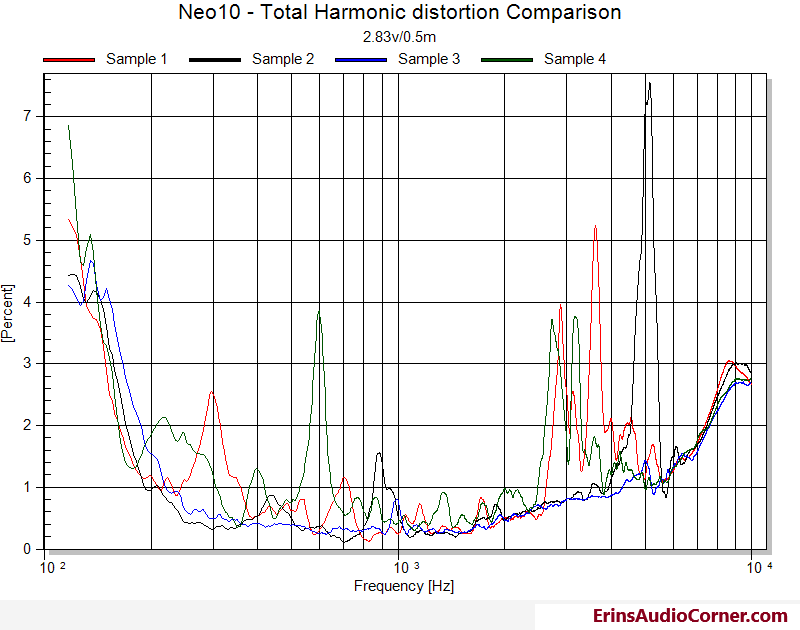
Well, Samples 1, 2, and 4 look terrible here.
———————————————————————————————————————————————
End of Comparison Testing….
———————————————————————————————————————————————
Single Driver Testing: Sample 3
After completing the comparison testing above, I chose Sample 3 to test further as it seemed to have the better response in FR and HD. Yes, this is cherry picking but you’ve seen the variance above.
Thiele-Small Parameters
| Electrical Parameters | |||
|---|---|---|---|
| Re | 6.28 | Ohm | electrical voice coil resistance at DC |
| Le | 0.006 | mH | frequency independent part of voice coil inductance |
| L2 | 0.01 | mH | para-inductance of voice coil |
| R2 | 0.29 | Ohm | electrical resistance due to eddy current losses |
| Cmes | 1264 | µF | electrical capacitance representing moving mass |
| Lces | 0.77 | mH | electrical inductance representing driver compliance |
| Res | 1.1 | Ohm | resistance due to mechanical losses |
| fs | 161.2 | Hz | driver resonance frequency |
| Loss factors | |||
| Qtp | 1.194 | total Q-factor considering all losses | |
| Qms | 1.403 | mechanical Q-factor of driver in free air considering Rms only | |
| Qes | 8.032 | electrical Q-factor of driver in free air considering Re only | |
| Qts | 1.194 | total Q-factor considering Re and Rms only |
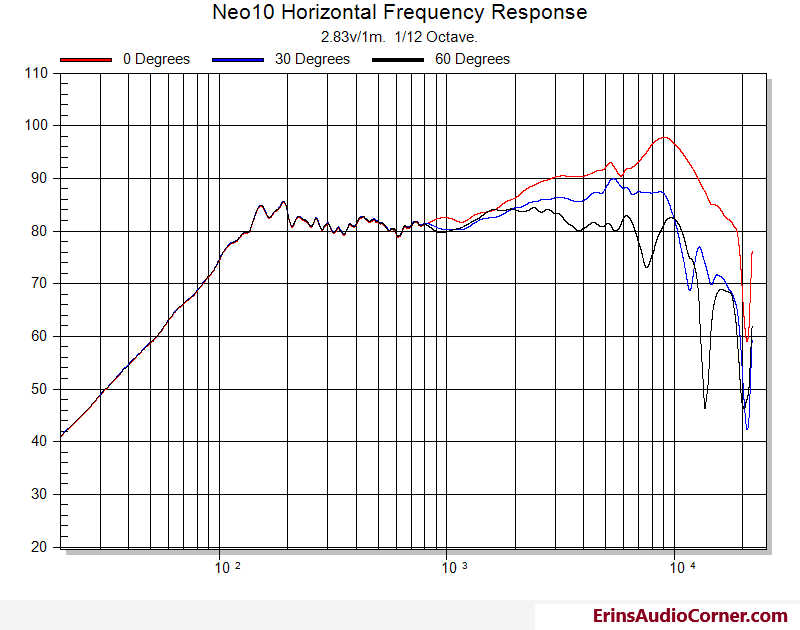
Frequency Response: Horizontal Axis
2.83v @ 1m
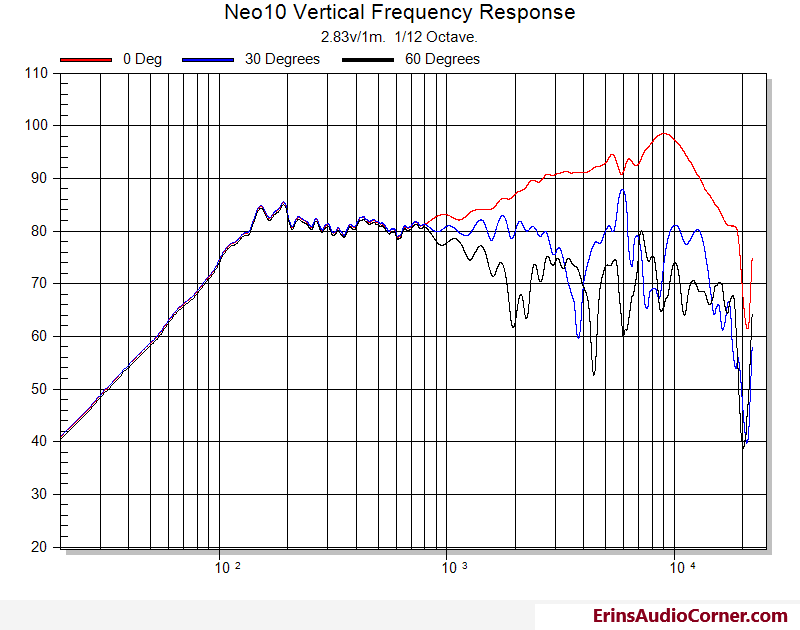
Frequency Response: Vertical Axis
2.83v @ 1m
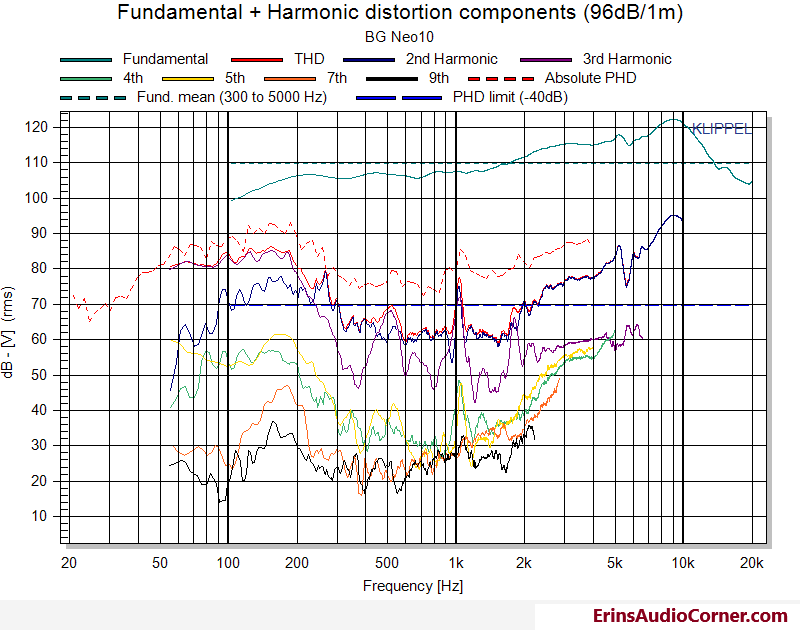
Harmonic Distortion (Horizontal Axis)
Note the response rises throughout. Therefore, the SPL level used to determine 96dB/1m was based on the fundamental mean SPL from 300hz to 5khz. This is the same as I do on all my tests, albeit with some more wiggle room here by a couple dB. Overall, this is comparable to my other test results.
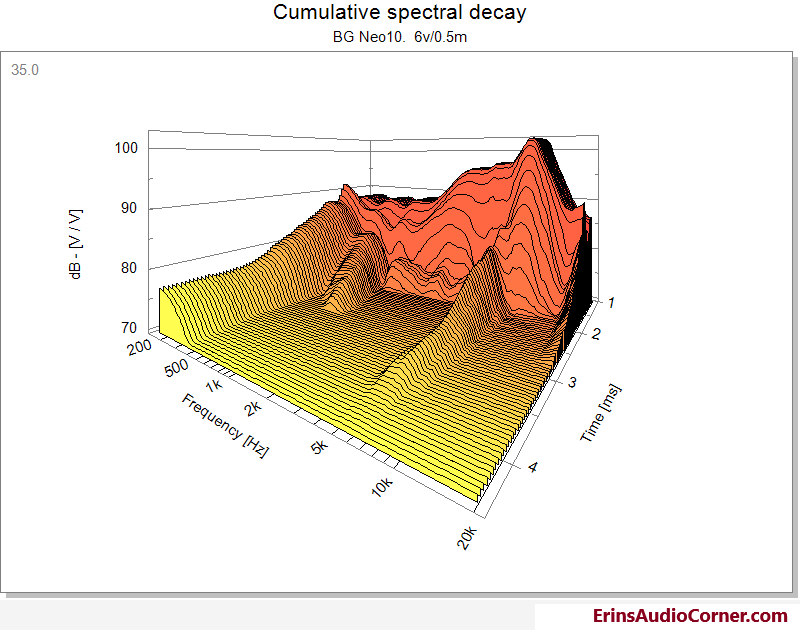
Cumulative Spectral Decay
Results Wrap-Up
As I stated in the opening paragraph, I tested both consistency between 4 units. 3 of the 4 had some really concerning distortion results. The one I wound up doing further testing on looked much better but still wasn’t great. In terms of consistency between these 4 units, well, I think the results speak for themselves. The owner had mentioned that one unit didn’t sound right to him but he didn’t keep track of which one it was so I can’t correlate it to results here. I’ve also been told these are quite fragile and BG’s spec goes as far to warn users to be careful when soldering as overheating can lead to diaphragm failure. I use alligator clips in my testing so that wasn’t an issue here; though, I can’t speak for what happened before I got them.
With all of that said in regards to unit-to-unit consistency, I’ve based the below on the best sample of the 4 which could be overgenerous but I chose to err on the side of caution given the unconfirmed history of each unit before they were sent to me for testing:
The FR rises +10dB from 1khz to 3khz and winds up at +18dB from 1khz to about 8khz. The manufacturer spec also shows the same behavior which backs up my measurements. Off-axis response on the horizontal axis looks pretty good with some issues above 5khz. CSD shows ringing around 5-6khz which shows up in every FR measurement as well. Vertical off-axis response is non-uniform above 2kHz. This driver’s vertical length is almost 9 inches which would put the beaming frequency starting at around 800hz; this is seemingly backed up by the data where the divergence between on/off-axis response begins around 900Hz.
In regards to the distortion measurements: At about 200hz the delta between the fundamental and THD lines is about 30dB which is equal to about 3% THD. On the upper end distortion is shown increasing above 2kHz (1% THD) to roughly 2-3% THD from 5-10kHz.
Crossed from 300-2khz seems to be where I’d be expecting to land - if I were using them in my own setup - given the upward swing in response and the poor vertical dispersion off-axis (thanks to the long dimension).
End
If you like what you see here and want to help me keep it going, there’s a Paypal Contribute button at the bottom of each page. Just provide what you can. Every little bit is truly appreciated.
You can also join my Facebook and YouTube pages via the links at the bottom of the page if you’d like to follow along with updates.
Thanks!