YouTube Video Review version:
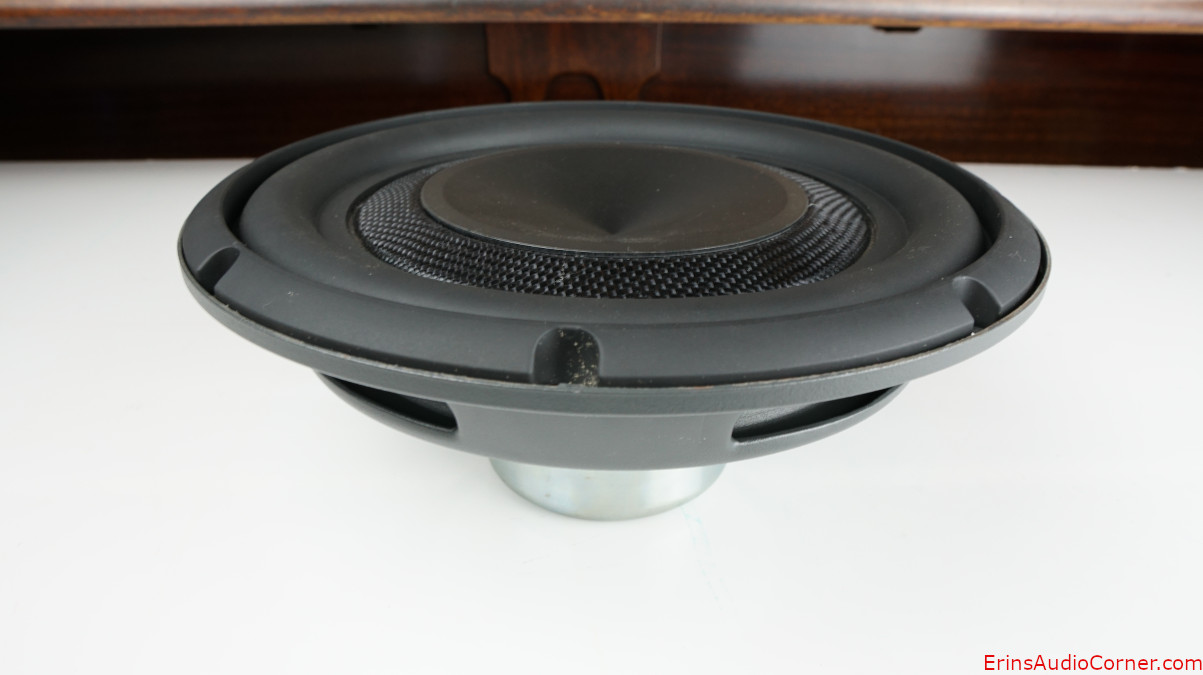
Information
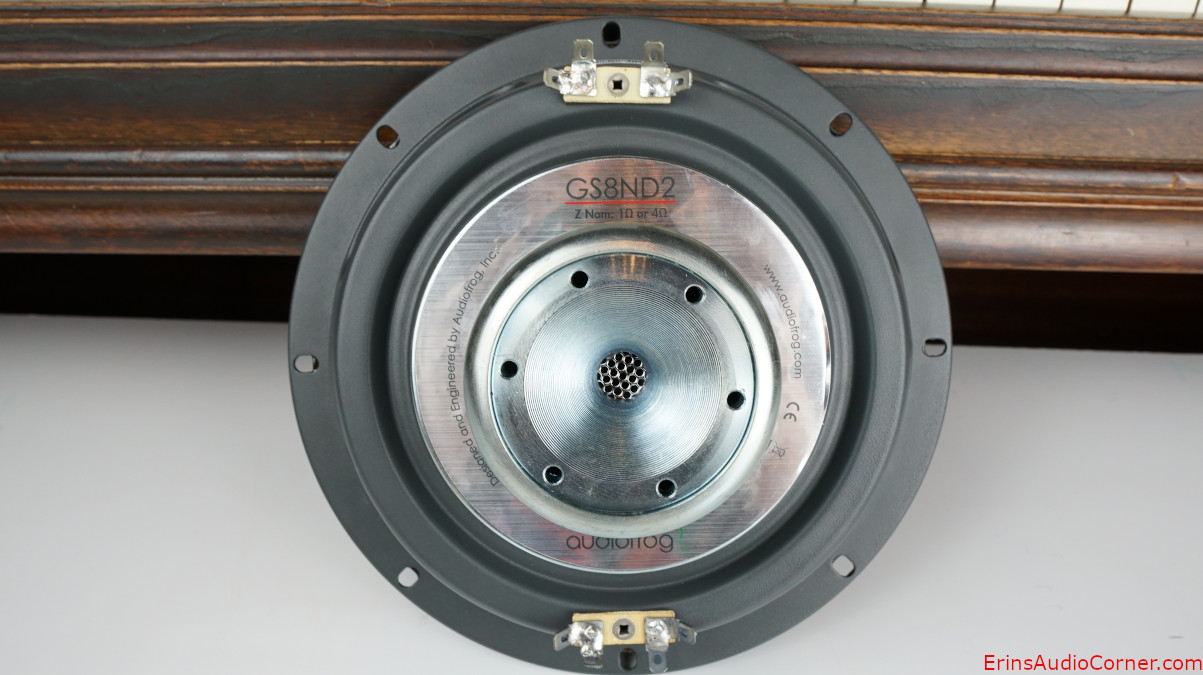
Before I dive in I want to note that this is a dual voice coil (DVC) woofer with dual 2 Ohm coil configurable in parallel or in series. I have tested and provided the T/S parameters with the coils wired in series and also in parallel. However, based on a poll I created on my Facebook page where I asked if people prefer to run a DVC woofer at a higher or lower load where over 80% of the replies indicated “higher load”, I only tested the woofer at the higher series load of 4-ohm nominal for frequency response. However, the linear excursion limits are practically the same between the two sets (the Bl, Cms, and Le curves do not change) and, thus, I only provide the results of the series testing.
Per Andy Wehmeyer (owner of AudioFrog):
“The GS8ND2 is a subwoofer/woofer. The objective of the design was to make a shallow subwoofer/woofer that will make bass in the correct application–a little box. Most shallow subwoofers require really big boxes and they’re often high Q drivers. There are a few that sound good, but not many. So, the GS8ND2 is cool because it can be used in a really small sealed box and also in a really small vented box. It has a long enough voice coil to be a suitable replacement for an OE sub in an infinite baffle. Recognizing that there are some of you who really want an 8” you can put in the door with a crossover frequency of 40 or 50Hz, I decided to put a shorting ring in the speaker to help with the midbass response and to reduce distortion. The spec sheet indicates that this should be crossed no higher than 300Hz. That works pretty well, since we make a GS25 and a GB25 which will both work great down to 300 Hz. So, if you need a WOOFER for your door in a 3-way system, then this is a pretty cool one that’s only 3" deep. It is NOT a midrange. It wasn’t intended to be a midrange. If you need a midbass/midrange driver, we make a great one. That’s a GB60. It has two shorting rings, a seriously stiff cone that provides really flat response in the intended passband (up to 2-2.5k). Every time someone asks me where they should cross their midbass, I say the same thing. 80Hz, LR4. Cross the sub at 60Hz also LR4. This works great. It gets the phase really close so getting the bass in the front is easy. It keeps a lot of distortion out of the signal, preserves the speaker and makes it possible for your system to play much louder than if you cross the midbass lower. If you drive a Porsche 91, as an example, and have no room for a sub, putting these in the doors along with a mid and tweeter will be great. In little boxes under the seats in trucks, these will be great. In the APERIODIC boxes under the seats of BMWs, these will work great."
Retail price is about $600/pair and can be purchased from your favorite AudioFrog dealer or direct from Crutchfield.
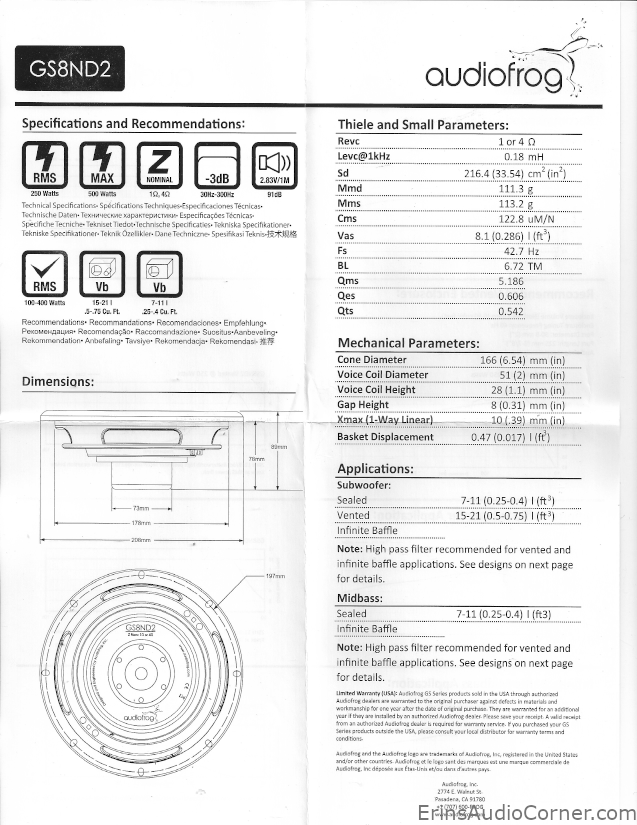
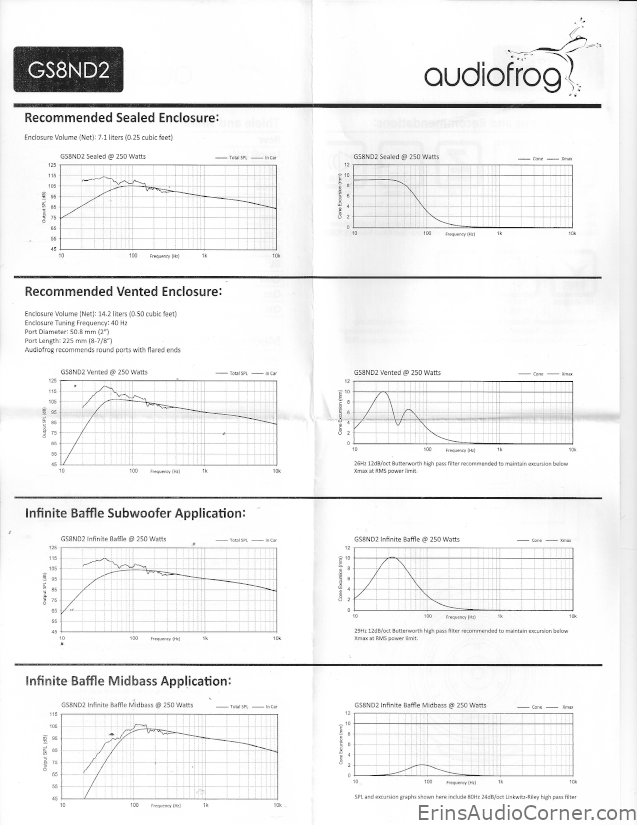
And here is a copy of the spec sheet:
Test Results
Foreword: Subjective Analysis vs Objective Data of Drive Units (click here)
While I would love to be able to confidently do so, I do not provide subjective analysis of raw drive units. Realistically, there is no easy way or meaningful way to do so. Drive units are parts of a whole. In order to test, subjectively, you would want to integrate it into a system and find what works best when mated to another driver (like a midwoofer to a tweeter, a midrange to a midwoofer, etc.). And to give it a fair shake it must be optimized in that inegration which would be a very arduous task to perform for every drive unit I review. It makes no sense to subjectively critique a single drive unit on its own because it may be used in a different configuration than someone else. One person may cross it with an LR2 HPF and LR4 LPF where another may use it in a completely different bandpass with completely different crossover and slopes. And if I were to try to create a speaker from it for the point of subjective analysis I am left with the same issue. The best implementation for a 6.5-inch midwoofer is different than it is for an 8-inch midwoofer. The data tells the story of performance on an apples-to-apples basis far better than someone's subjective imagination can.For all the reasons listed above: What I provide here is objective-heavy analysis. However, I provide my own subjective experience and provide insight into what I believe might be positive or negative performance characteristics based on the objective data.
Small Signal Testing (Thiele-Small Results)
Using Klippel’s Distortion Analyzer 2, Linear Lumped Parameter Measurement Module, Pro Driver Stand and provided Panasonic ANR12821 Laser along with Klippel’s Training 1 - Linear Lumped Parameter Measurement tutorial, I measured this drive unit’s impedance and small-signal parameters. Below are the results.
Series Wiring (4-ohm load nominal)
Note: The impedance graph can be found in the Frequency Response Linearity graphic later in this review.
| Electrical Parameters | |||
|---|---|---|---|
| Re | 3.94 | Ohm | electrical voice coil resistance at DC |
| Le | 1.139 | mH | frequency independent part of voice coil inductance |
| L2 | 3.146 | mH | para-inductance of voice coil |
| R2 | 8.60 | Ohm | electrical resistance due to eddy current losses |
| Cmes | 663.10 | µF | electrical capacitance representing moving mass |
| Lces | 30.45 | mH | electrical inductance representing driver compliance |
| Res | 49.60 | Ohm | resistance due to mechanical losses |
| fs | 35.4 | Hz | driver resonance frequency |
| Mechanical Parameters | |||
| (using laser) | |||
| Mms | 111.799 | g | mechanical mass of driver diaphragm assembly including air load and voice coil |
| Mmd (Sd) | 108.202 | g | mechanical mass of voice coil and diaphragm without air load |
| Rms | 3.400 | kg/s | mechanical resistance of total-driver losses |
| Cms | 0.181 | mm/N | mechanical compliance of driver suspension |
| Kms | 5.54 | N/mm | mechanical stiffness of driver suspension |
| Bl | 12.985 | N/A | force factor (Bl product) |
| Lambda s | 0.027 | suspension creep factor | |
| Loss factors | |||
| Qtp | 0.546 | total Q-factor considering all losses | |
| Qms | 7.318 | mechanical Q-factor of driver in free air considering Rms only | |
| Qes | 0.582 | electrical Q-factor of driver in free air considering Re only | |
| Qts | 0.539 | total Q-factor considering Re and Rms only | |
| Other Parameters | |||
| Vas | 11.9710 | l | equivalent air volume of suspension |
| n0 | 0.088 | % | reference efficiency (2 pi-radiation using Re) |
| Lm | 81.64 | dB | characteristic sound pressure level (SPL at 1m for 1W @ Re) |
| Lnom | 83.74 | dB | nominal sensitivity (SPL at 1m for 1W @ Zn) |
| Sd | 216.40 | cm² | diaphragm area |
Parallel Wiring (1-ohm load nominal)
| Electrical Parameters | |||
|---|---|---|---|
| Re | 1.05 | Ohm | electrical voice coil resistance at DC |
| Le | 0.284 | mH | frequency independent part of voice coil inductance |
| L2 | 0.785 | mH | para-inductance of voice coil |
| R2 | 2.15 | Ohm | electrical resistance due to eddy current losses |
| Cmes | 2639.80 | µF | electrical capacitance representing moving mass |
| Lces | 7.37 | mH | electrical inductance representing driver compliance |
| Res | 12.43 | Ohm | resistance due to mechanical losses |
| fs | 36.1 | Hz | driver resonance frequency |
| Mechanical Parameters | |||
| (using laser) | |||
| Mms | 109.988 | g | mechanical mass of driver diaphragm assembly including air load and voice coil |
| Mmd (Sd) | 106.391 | g | mechanical mass of voice coil and diaphragm without air load |
| Rms | 3.353 | kg/s | mechanical resistance of total-driver losses |
| Cms | 0.177 | mm/N | mechanical compliance of driver suspension |
| Kms | 5.65 | N/mm | mechanical stiffness of driver suspension |
| Bl | 6.455 | N/A | force factor (Bl product) |
| Lambda s | 0.024 | suspension creep factor | |
| Loss factors | |||
| Qtp | 0.588 | total Q-factor considering all losses | |
| Qms | 7.437 | mechanical Q-factor of driver in free air considering Rms only | |
| Qes | 0.630 | electrical Q-factor of driver in free air considering Re only | |
| Qts | 0.581 | total Q-factor considering Re and Rms only | |
| Other Parameters | |||
| Vas | 11.7228 | l | equivalent air volume of suspension |
| n0 | 0.084 | % | reference efficiency (2 pi-radiation using Re) |
| Lm | 81.45 | dB | characteristic sound pressure level (SPL at 1m for 1W @ Re) |
| Lnom | 81.22 | dB | nominal sensitivity (SPL at 1m for 1W @ Zn) |
| Sd | 216.40 | cm² | diaphragm area |
Large Signal Modeling (Linear Xmax Results)
Using Klippel’s Distortion Analyzer 2, Large Signal Identification Module, Pro Driver Stand and provided Panasonic ANR12821 Laser along with Klippel’s Training 3 - Loudspeaker Nonlinearities tutorial, I measured the linear, nonlinear and thermal parameters of this drive unit.
Nonlinearities
Traditionally, Xmax has been defined in one of the following ways:
- the physical overhang of the voice coil (height of the voice coil relative to height of the gap)
- 115% times the physical overhang above
- the point where displacement limit(s) is/are exceeded
The third option is where the Klippel LSI module comes in to play. It permits a more “apples to apples” approach of defining the displacement (Xmax) limits based on the XBL, XC, XL and Xd. The displacement limits XBL, XC, XL and Xd describe the limiting effect for the force factor Bl(x), compliance Cms(x), inductance Le(x) and Doppler effect, respectively, according to the threshold values Blmin, Cmin, Zmax and d2 used by the operator.
There are one of two sets of thresholds which can be used to define linear excursion:
- Non-Subwoofer Drivers: The thresholds Blmin= 82 %, Cmin=75 %, Zmax=10 % and d2=10% generate for a two-tone-signal (f1=fs, f2=8.5fs) 10 % total harmonic distortion and 10 % intermodulation distortion.
- Subwoofer Drivers: The thresholds Blmin= 70 %, Cmin=50 %, Zmax=17 % create 20 % total harmonic distortion which is becoming the standard for acceptable subwoofer distortion thresholds.
These parameters are defined in more detail in the (Klippel) papers:
- “AN04 – Measurement of Peak Displacement Xmax”
- “AN05 - Displacement Limits due to Driver Nonlinearities”
- “AN17 - Credibility of Nonlinear Parameters”
- “Prediction of Speaker Performance at High Amplitudes”
- “Assessment of Voice Coil Peak Displacement Xmax”
- “Assessing Large Signal Performance of Loudspeakers”
Below are the displacement limits’ results for this drive unit obtained from Klippel’s LSI module:
Series Wiring (4-ohm load nominal)
| Displacement Limits | |||
|---|---|---|---|
| X Bl @ Bl min=82% | 6.4 | mm | Displacement limit due to force factor variation |
| X C @ C min=75% | 4.2 | mm | Displacement limit due to compliance variation |
| X L @ Z max=10 % | 4.5 | mm | Displacement limit due to inductance variation |
| X d @ d2=10% | 31.4 | mm | Displacement limit due to IM distortion (Doppler) |
| Asymmetry (IEC 62458) | |||
| Ak | 35.28 | % | Stiffness asymmetry Ak(Xpeak) |
| Xsym | 3.48 | mm | Symmetry point of Bl(x) at maximal excursion |
Per the above table, this drive unit’s linear excursion is limited to 4.2mm due to exceeding the Cms displacement limit of 70% for the distortion limit of 10%.
Parallel Wiring (1-ohm load nominal)
| Displacement Limits | |||
|---|---|---|---|
| X Bl @ Bl min=82% | 6.6 | mm | Displacement limit due to force factor variation |
| X C @ C min=75% | 4.2 | mm | Displacement limit due to compliance variation |
| X L @ Z max=10 % | 4.8 | mm | Displacement limit due to inductance variation |
| X d @ d2=10% | 30.8 | mm | Displacement limit due to IM distortion (Doppler) |
| Asymmetry (IEC 62458) | |||
| Ak | 35.60 | % | Stiffness asymmetry Ak(Xpeak) |
| Xsym | 3.72 | mm | Symmetry point of Bl(x) at maximal excursion |
Per the above table, this drive unit’s linear excursion is limited to 4.2mm due to exceeding the Bl displacement limit of 82% for the distortion limit of 10%.
Changing the limits to permit up to 20% THD, typically how subwoofers are tested, yields the following results:
| Displacement Limits | |||
|---|---|---|---|
| X Bl @ Bl min=70% | 8.4 | mm | Displacement limit due to force factor variation |
| X C @ C min=50% | 7.8 | mm | Displacement limit due to compliance variation |
| X L @ Z max=17 % | 7.6 | mm | Displacement limit due to inductance variation |
| X d @ d2=17% | 55.7 | mm | Displacement limit due to IM distortion (Doppler) |
| Asymmetry (IEC 62458) | |||
| Ak | 30.84 | % | Stiffness asymmetry Ak(Xpeak) |
| Xsym | 2.67 | mm | Symmetry point of Bl(x) at maximal excursion |
Per the above table, this drive unit’s linear excursion is limited to 7.8mm due to exceeding the inductance variation displacement limit of 17% for the distortion limit of 20%.
We can break the above information down further. The below text is written by Patrick Turnmire of Red Rock Acoustics and used with his permission, substituting data from this drive unit’s test results where applicable.
Large Signal Modeling
At higher amplitudes, loudspeakers produce substantial distortion in the output signal, generated by nonlinear ties inherent in the transducer. The dominant nonlinear distortions are predictable and are closely related with the general principle, particular design, material properties and assembling techniques of the loudspeaker. The Klippel Distortion Analyzer combines nonlinear measurement techniques with computer simulation to explain the generation of the nonlinear distortions, to identify their physical causes and to give suggestion for constructional improvements. Better insight into the nonlinear mechanisms makes it possible to further optimize the transducer in respect with sound quality, weight, size and cost.
Nonlinear Characteristics
The dominant nonlinearities are modelled by variable parameters such as
| Bl(x) | instantaneous electro-dynamic coupling factor (force factor of the motor) defined by the integral of the magnetic flux density B over voice coil length l as a function of displacement |
| KMS(x) | mechanical stiffness of driver suspension a function of displacement |
| LE(i) | voice coil inductance as a function of input current (describes nonlinear permeability of the iron path) |
| LE(x) | voice coil inductance as a function of displacement |
Nonlinear Parameters
Bl change with excursion
.png)
The electrodynamic coupling factor, also called Bl-product or force factor Bl(x), is defined by the integral of the magnetic flux density B over voice coil length l and translates current into force. In traditional modeling this parameter is assumed to be constant. The force factor Bl(0) at the rest position corresponds with the Bl-product used in linear modeling. The red curve displays Bl over the entire displacement range covered during the measurement. You see the typical decay of Bl when the voice coil moves out of the gap. At the end of the measurement, the black curve shows the confidential range (interval where the voice coil displacement in this range occurred 99% of the measurement time). During the measurement, the black curve shows the current working range. The dashed curve displays Bl(x) mirrored at the rest position of the voice coil – this way, asymmetries can be quickly identified. Since a laser was connected during the measurement, a coil in / coil out marker is displayed on the bottom left / bottom right.
Suspension Stiffness change with excursion
.png)
The stiffness KMS(x) describes the mechanical properties of the suspension. Its inverse is the compliance CMS(x).
Inductance change with excursion
.png)
.png)
The inductance components Le (x) and Bl(i) of most drivers have a strong asymmetric characteristic. If the voice coil moves towards the back plate the inductance usually increases since the magnetic field generated by the current in the voice coil has a lower magnetic resistance due to the shorter air path. The nonlinear inductance Le(x) has two nonlinear effects. First the variation of the electrical impedance with voice coil displacement x affects the input current of the driver. Here the nonlinear source of distortion is the multiplication of displacement and current. The second effect is the generation of a reluctance force which may be interpreted as an electromagnetic motor force proportional to the squared input current.
The flux modulation Bl(i) has two effects too. On the electrical side the back EMF Bl(i)*v produces nonlinear distortion due to the multiplication of current i and velocity v. On the mechanical side the driving force F = Bl(i)*i comprises a nonlinear term due to the squared current i. This force produces similar effects as the variable term Le(x).
Fs shift with excursion
.png)
Qts change with excursion
.png)
Asymmetrical Nonlinearities
Asymmetrical nonlinearities produce not only second- and higher-order distortions but also a dc-part in the displacement by rectifying low frequency components. For an asymmetric stiffness characteristic the dc-components moves the voice coil for any excitation signal in the direction of the stiffness minimum. For an asymmetric force factor characteristic the dc-component depends on the frequency of the excitation signal. A sinusoidal tone below resonance (f<fS) would generate or force moving the voice coil always in the force factor maximum. This effect is most welcome for stabilizing voice coil position. However, above the resonance frequency (f>fS) would generate a dc-component moving the voice coil in the force factor minimum and may cause severe stability problems. For an asymmetric inductance characteristic the dc-component moves the voice coil for any excitation signal in the direction of the inductance maximum. Please note that the dynamically generated DC-components cause interactions between the driver nonlinearities. An optimal rest position of the coil in the gap may be destroyed by an asymmetric compliance or inductance characteristic at higher amplitudes. The module Large Signal Simulation (SIM) allows systematic investigation of the complicated behavior.
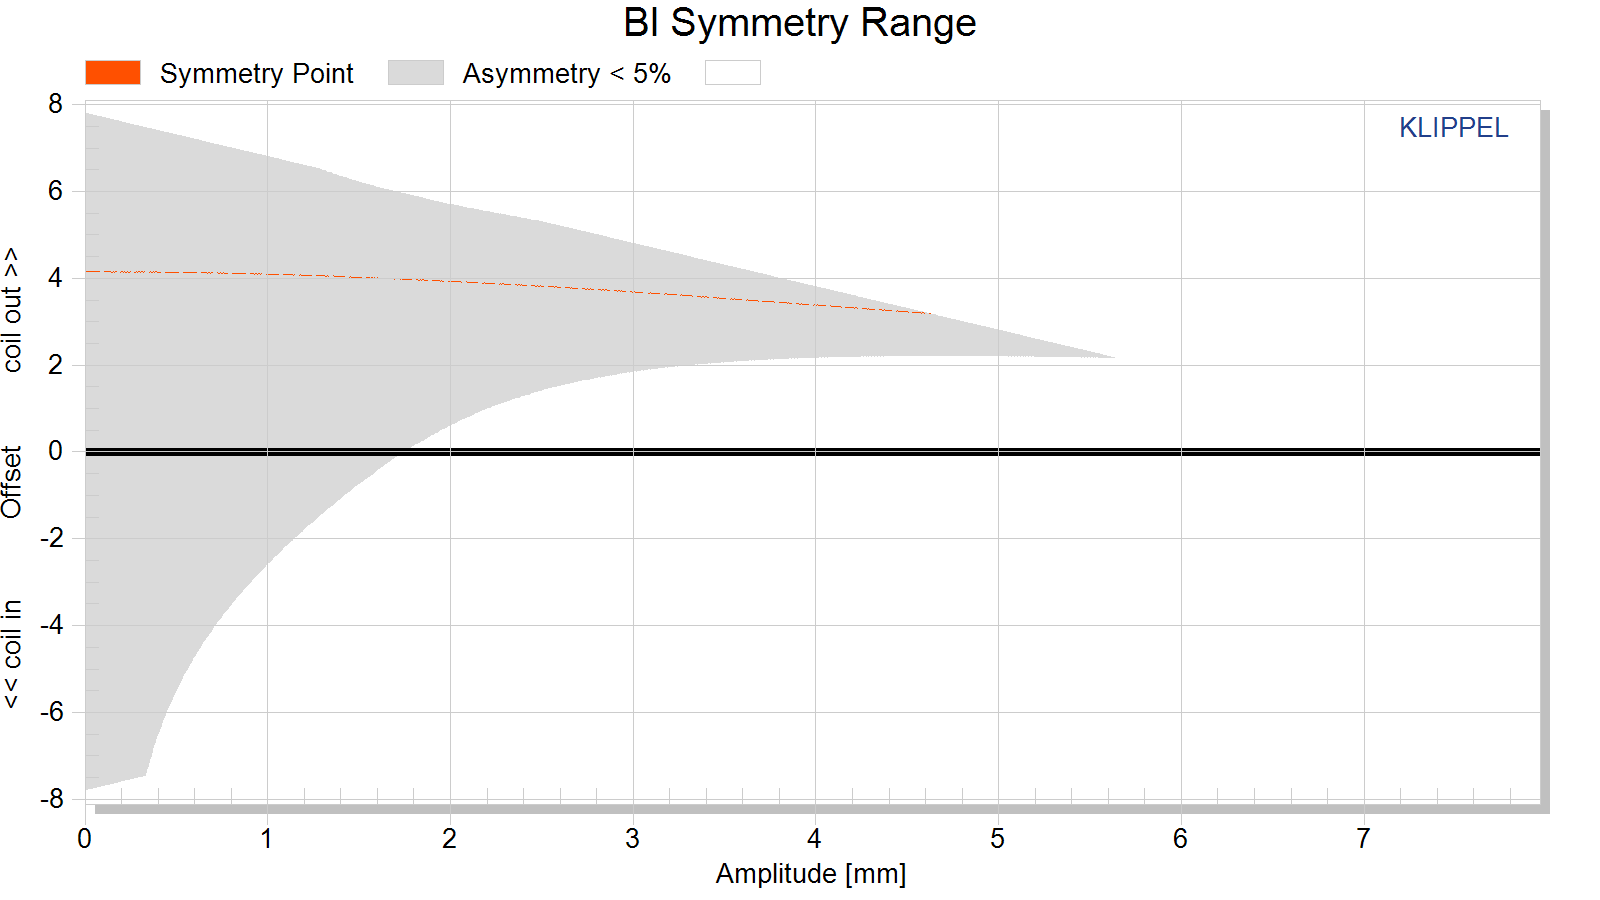
Bl symmetry xb(x)
This curve shows the symmetry point in the nonlinear Bl-curve where a negative and positive displacement x=xpeak will produce the same force factor Bl(xb(x) + x) = Bl(xb(x) – x).
If the shift xb(x) is independent on the displacement amplitude x then the force factor asymmetry is caused by an offset of the voice coil position and can be simply compensated.
If the optimal shift xb(x) varies with the displacement amplitude x then the force factor asymmetry is caused by an asymmetrical geometry of the magnetic field and cannot completely be compensated by coil shifting.
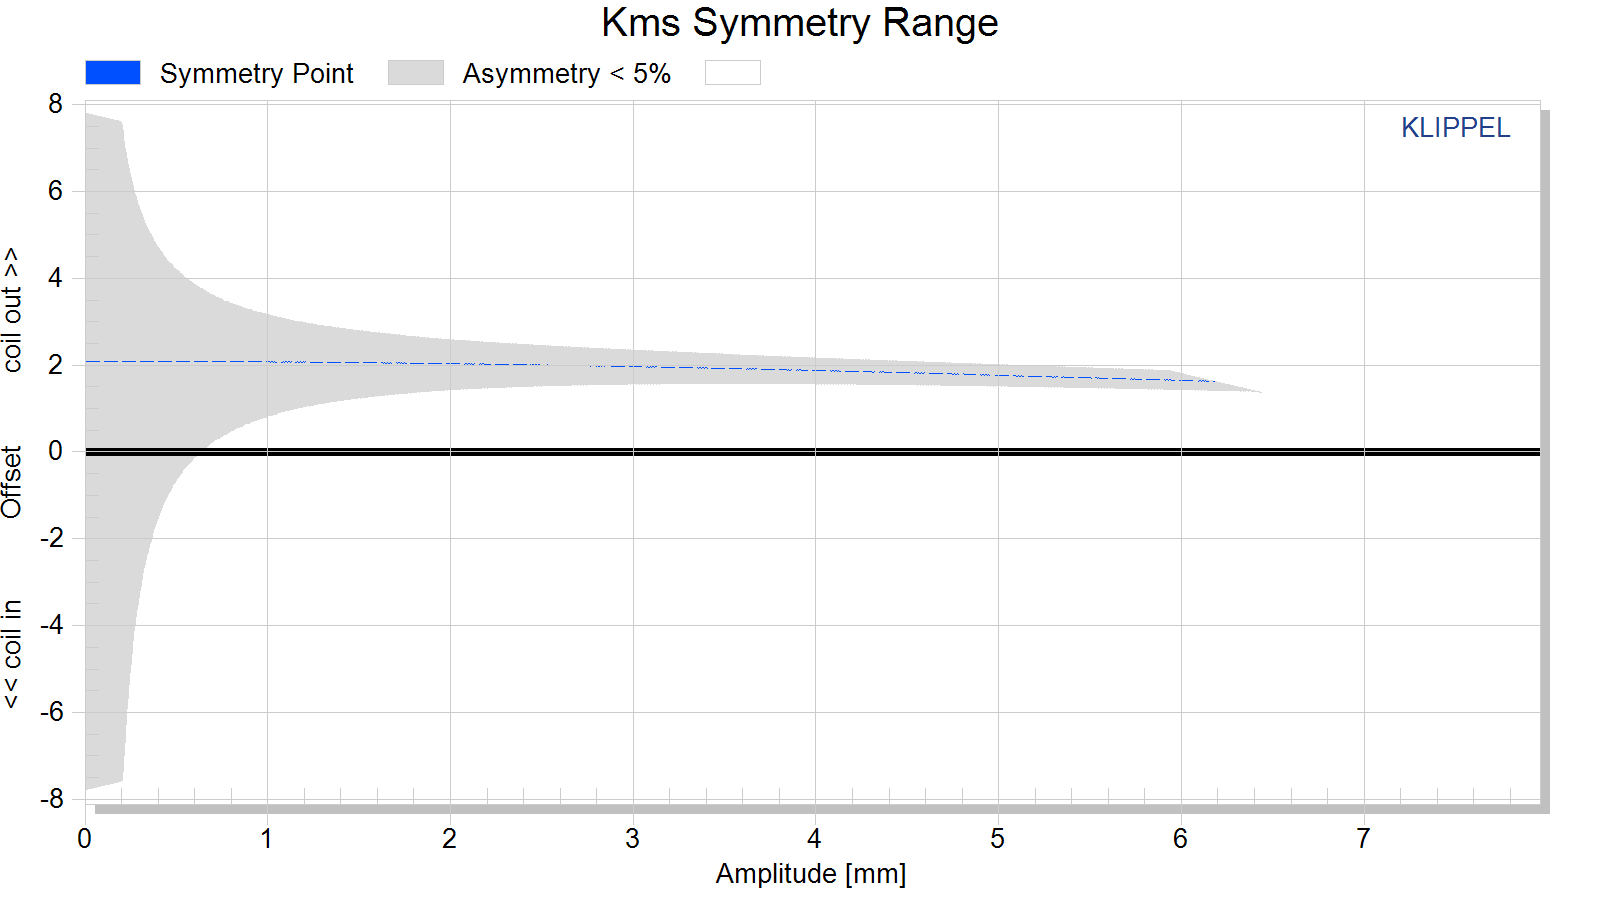
Kms Symmetry xc(x)
This curve shows the symmetry point in the nonlinear compliance curve where a negative and positive displacement x=xpeak will produce the same compliance value kms(xc(x) + x) = kms(xc(x) – x).
A high value of the symmetry point xc(x) at small displacement amplitudes x » 0 indicates that the rest position does not agree with the minimum of the stiffness characteristic. This may be caused by an asymmetry in the geometry of the spider (cup form) or surround (half wave). A high value of the symmetry point xc(x) at maximal displacement x» xmax may be caused by asymmetric limiting of the surround.
Parameters at the Rest Position
For accurate system modelling “Large + Cold” parameters are preferable to “Small Signal” parameters because they more closely reflect the parameters in their typical operating range.
| Symbol | Large + Warm | Large + Cold | Small Signal | Unit | Comment |
|---|---|---|---|---|---|
| Note: | for accurate small signal parameters, use LPM module | ||||
| ———————– | ——— | ——— | ——— | —— | ————————————————————————————————————– |
| Delta Tv [referenced] | 63.6 | 0 | K | increase of voice coil temperature during the measurement referenced to imported Re(Delta Tv=0K) | |
| Delta Tv = Tv-Ta | 61.1 | 0 | 0 | K | increase of voice coil temperature during the measurement |
| Xprot | 7.8 | 7.8 | 0.7 | mm | maximal voice coil excursion (limited by protection system) |
| Re (Tv) | 5.15 | 4.18 | 4.18 | Ohm | voice coil resistance considering increase of voice coil temperature Tv |
| Le (X=0) | 1.37 | 1.37 | 1.19 | mH | voice coil inductance at the rest position of the voice coil |
| L2 (X=0) | 2.70 | 2.70 | 2.60 | mH | para-inductance at the rest position due to the effect of eddy current |
| R2 (X=0) | 5.78 | 5.78 | 4.82 | Ohm | resistance at the rest position due to eddy currents |
| Cmes (X=0) | 815 | 815 | 692 | µF | electrical capacitance representing moving mass |
| Lces (X=0) | 37.39 | 37.39 | 32.31 | mH | electrical inductance at the rest position representing driver compliance |
| Res (X=0) | 32.70 | 32.70 | 24.42 | Ohm | resistance at the rest position due to mechanical losses |
| Qms (X=0, Tv) | 4.83 | 4.83 | 3.57 | mechanical Q-factor considering the mechanical system only | |
| Qes (Tv) | 0.62 | 0.50 | 0.61 | electrical Q-factor considering Re (Tv) only | |
| Qts (X=0, Tv) | 0.55 | 0.45 | 0.52 | total Q-factor considering Re (Tv) and Rms only | |
| fs | 28.8 | 28.8 | 33.7 | Hz | driver resonance frequency |
| Mms | 109.332 | 109.332 | g | (calculated from imported Bl) mechanical mass of driver diaphragm assembly including voice-coil and air load | |
| Rms (X=0) | 4.105 | 4.105 | 6.774 | kg/s | mechanical resistance of total-driver losses |
| Cms (X=0) | 0.28 | 0.28 | 0.20 | mm/N | mechanical compliance of driver suspension at the rest position |
| Kms (X=0) | 3.59 | 3.59 | 5.12 | N/mm | mechanical stiffness of driver suspension at the rest position |
| Bl (X=0) | 12.86 | 12.86 | 12.86 | N/A | (imported) force factor at the rest position (Bl product) |
| Vas | 18.3924 | 18.3924 | 12.8964 | l | equivalent air volume of suspension |
| N0 | 0.069 | 0.085 | 0.077 | % | reference efficiency (2Pi-sr radiation using Re) |
| Lm | 80.5 | 81.4 | 81.0 | dB | characteristic sound pressure level |
| Sd | 216.40 | 216.40 | 216.40 | cm² | diaphragm area |
Frequency Response
Frequency Response data is generated using Klippel’s Transfer Function Mueasurement module in conjunction with Klippel’s In-Situ Compensation module. This pairing enables me to generate anechoic-quality measurements in the farfield with a resolution of response down to 20Hz increments; far better than splicing nearfield with gated farfield data (the latter of which is often limited to 200Hz or 300Hz resolution and will not show high-Q resonance in the midrange and bass frequencies). Data is represented at 2.83v/1m.
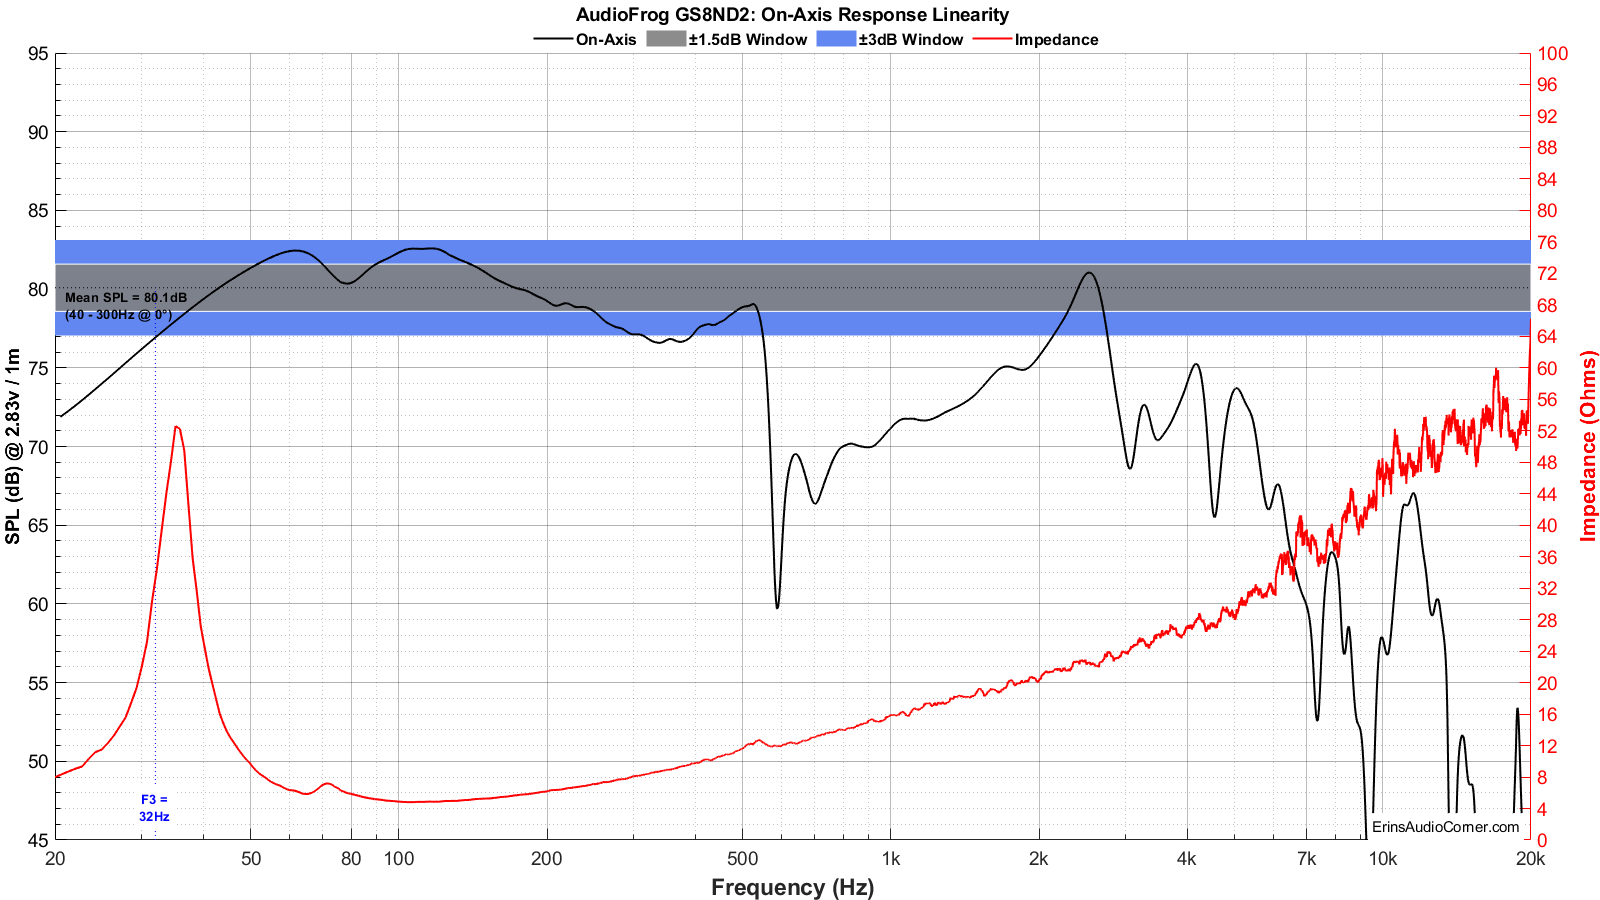
On-Axis Linearity and Impedance
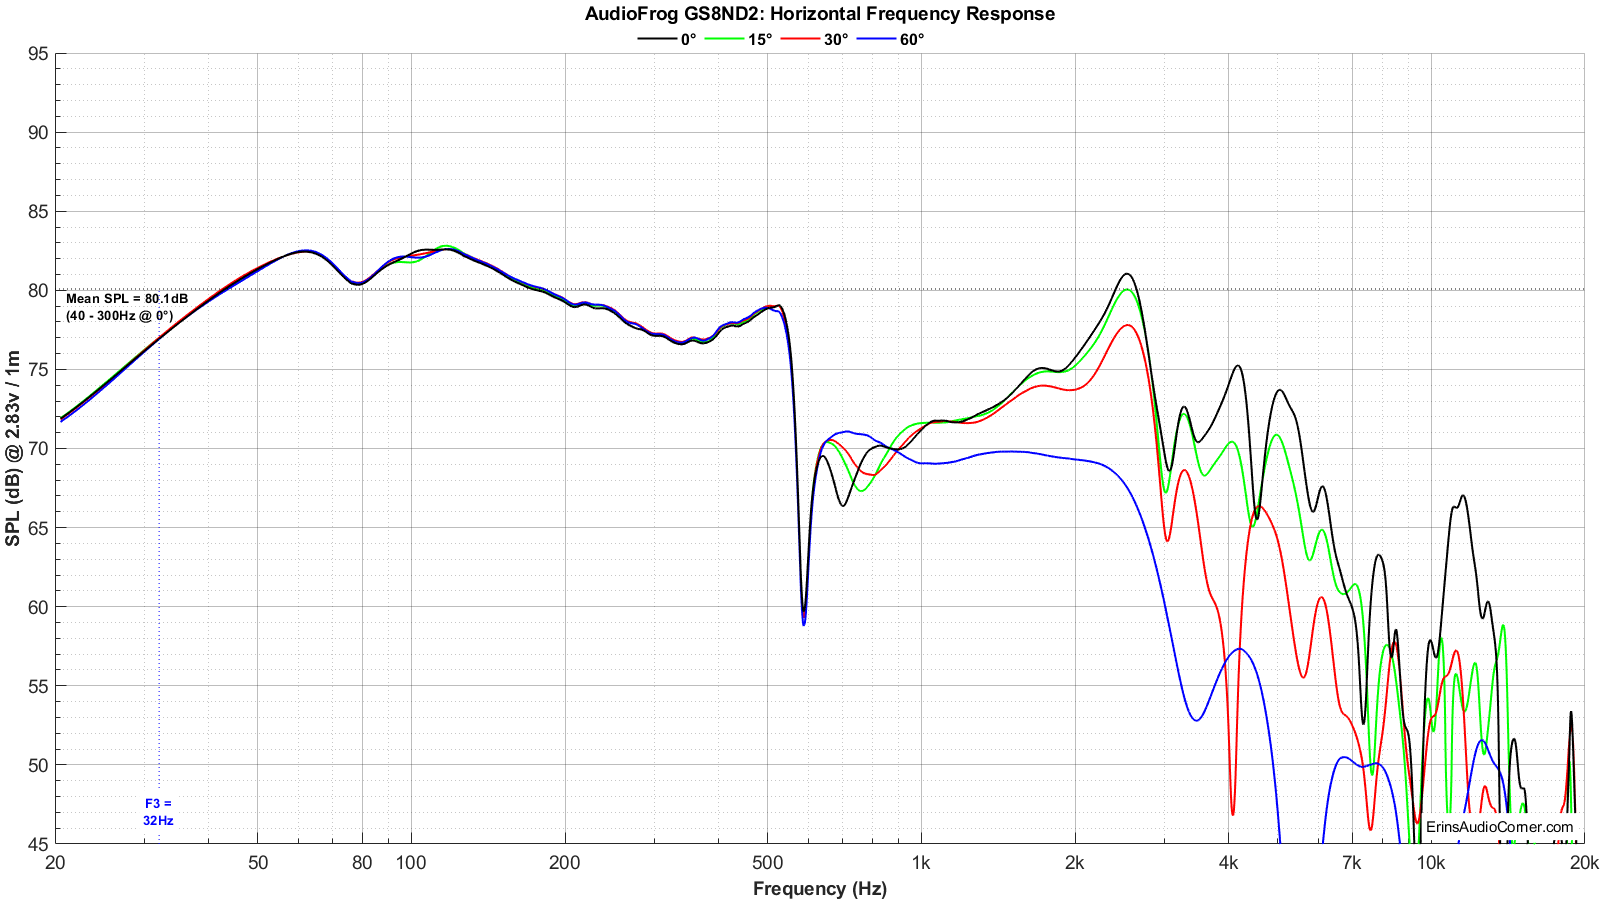
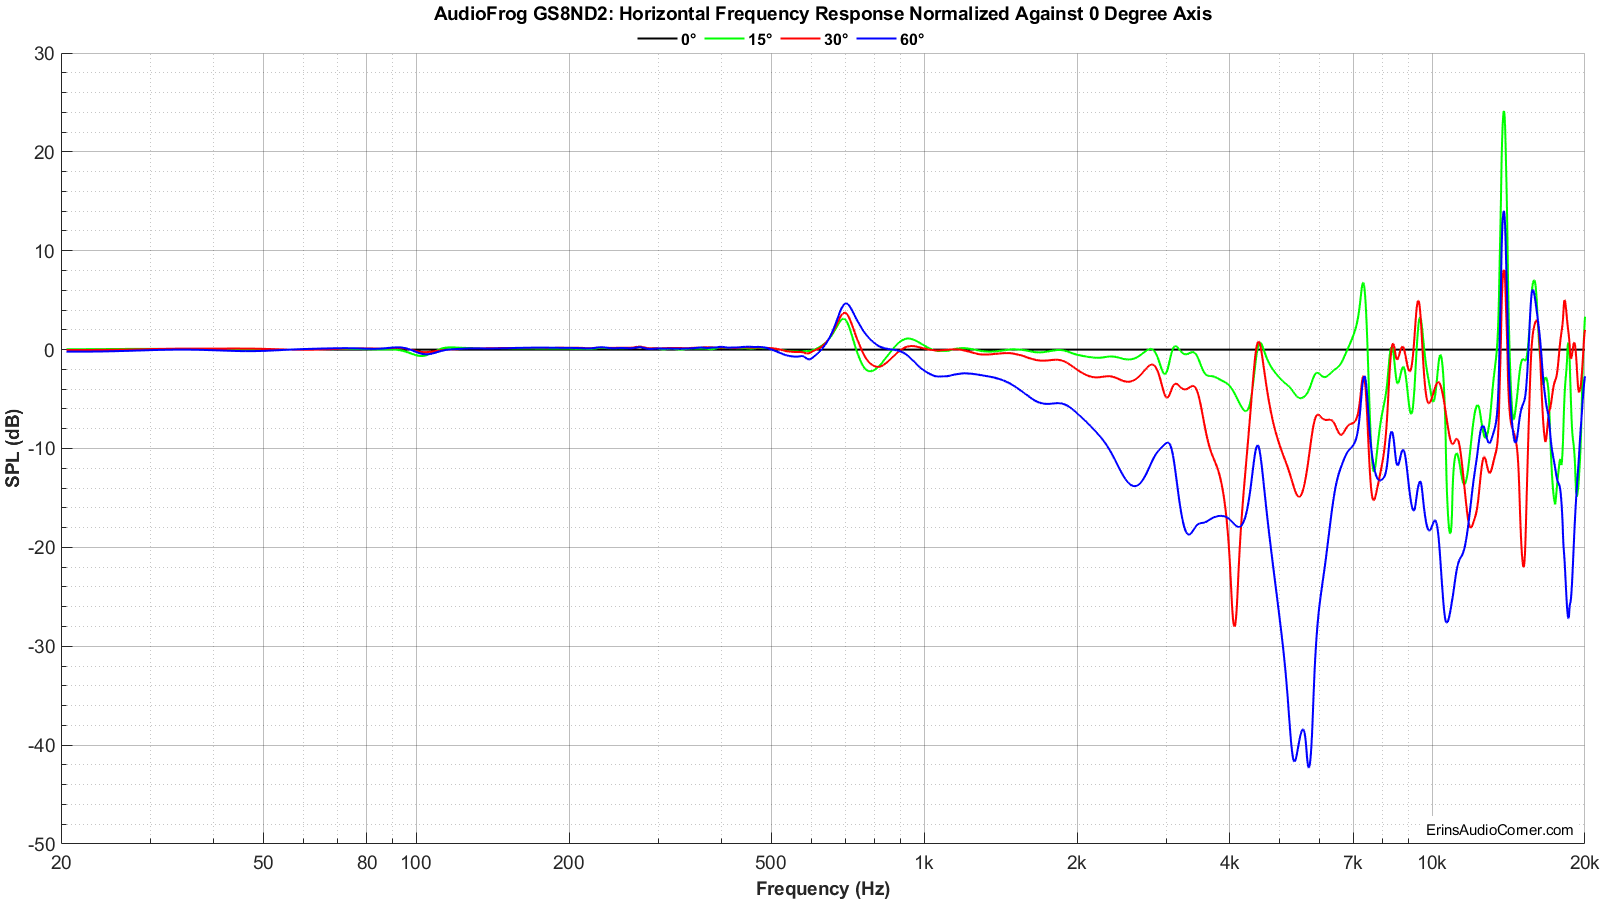
On and Off-Axis Frequency Response
Harmonic Distortion:
Measurements were completed in the nearfield (approximately 0.30 meters with room correction applied via Klippel’s ISC module) using Klippel’s TRF module. Multiple output levels were tested to provide the trend of distortion component profiles and to provide a comparison against other drive units I have tested. The SPL provided is relative to 1 meter distance, averaged in the noted bandpass region.
Intermodulated Distortion (IMD):
Klippel’s 3D-DISTORTION MEASUREMENT (DIS) module is used to calculate the Intermodulated Distortion for this drive unit.
Measurements were completed in the nearfield. Multiple output levels were tested to provide the trend of distortion component profiles and to provide a comparison against other drive units I have tested. The SPL provided is relative to 1 meter distance, averaged in the noted bandpass region.
Unlike Harmonic Distortion - which is a measure of only harmonics from a single tone - IMD is tested with two tones at the same time: a low frequency “bass tone” near Fs and a higher frequency “voice tone” much greater than Fs. For example a speaker driver plays 30Hz at the same time it plays 200Hz. Any distortion artifacts created by the sum and/or difference of the speaker playing both tones at the same time is a result of IMD. In this example, the speaker is supposed to play only 30Hz & 200Hz at the same time. Thanks to IMD, it plays 200Hz ± 30Hz. Second order IMD would be 200 ± 30Hz = 170Hz & 230Hz. Third order IMD would be 200 ± 60Hz = 140Hz & 260Hz. If these ‘side bands’ are high enough in output then they are heard as distortion. If not, they are not.
With that in mind, I used Klippel’s DIS module to test this drive unit in two ways:
- “Bass tone” fixed at the driver’s Fs, with a “voice sweep” where the 200Hz - 6kHz region is played, one tone at a time (over 50 individual tones).
- The same as above, but the “bass tone” fixed at 80Hz.
The purpose of me testing with two methods (different “bass tones”) is to see the difference between what happens when the driver plays with high(er) excursion vs when a typical HPF is used. All similarly sized and similarly purposed speakers are tested in the same manner. For better or worse. This means a 6-inch midwoofer is tested the same way an 8-inch midwoofer is. Ultimately, this is for my sanity, because having numerous measurement methods for all sizes of speakers would muddy the waters quickly and wouldn’t give us an idea of when performance is great (say, a 6-inch midwoofer that has much less distortion than an 8-inch) or vice-versa.
The above is tested at 3 voltages each. The first voltage is always 2.83v. The other two voltages are increased to provide higher output (usually targeting at least 96dB for one). As is the case with the multiple HD tests, the multiple IMD levels provides an idea of what the speaker’s IMD profiles look like as the output of the speaker is increased.
Results are provided in GIF form to help understand how the increased output levels impact the distortion profiles and levels. Also, I have provided the (calculated) excursion at the provided tests’ output level so you can see how much excursion the speaker is under at the bass tone. Naturally, with a lower frequency there is higher excursion than with a higher frequency bass tone. This also helps when you are comparing performance against another drive-unit because different speakers have different response profiles; one drive unit may have 2x the excursion from 30Hz to 80Hz while another may have 3x the excursion. Just something to keep in mind.
Test 1: Bass Tone at Fs, Voice Tones from 200-6000Hz
Test 2: Bass Tone at 80Hz, Voice Tones from 200-6000Hz
Maximum Long Term SPL (Multitone Distortion Testing) & Compression
Klippel’s Multi-Tone Measurement (MTON) module is used to calculate the maximum SPL for this drive unit.
Unlike IMD testing, Multitone testing incorporates a complex stimulus, used to emulate actual music. However, it is a bit more limited in evaluation purposes so I am using it here to characterize the maximum SPL of a drive unit at 1 meter distance as well as provide how much compression it exhibits with an increase in voice coil temperature.
The below data provides the metrics for how Maximum Long Term SPL is determined. This measurement follows the IEC 60268-21 Long Term SPL protocol, per Klippel’s template, as such:
- Rated maximum sound pressure according IEC 60268-21 §18.4
- Using broadband multi-tone stimulus according §8.4
- Stimulus time = 60 s Excitation time + Preloops according §18.4.1
Each voltage test is 1 minute long (hence, the “Long Term” nomenclature).
The thresholds to determine the maximum SPL are:
- -30dB Distortion relative to the fundamental
- -2dB Compression relative to the reference (1V) measurement
When the speaker has reached either or both above thresholds, the test is terminated and the SPL of the last test is the maximum SPL. In the below results, the legend indicates the average SPL within the same passband as is provided for the Frequency Response measurements. The highest SPL in the legend is the maximum SPL referencd to 1 meter distance. I provide the data showing which threshold was exceeded. The graphic(s) with a red line indicate the threshold that failed and capped the maximum SPL.
This measurement is conducted twice (with a 30-minute break between to let the voice coil cool down):
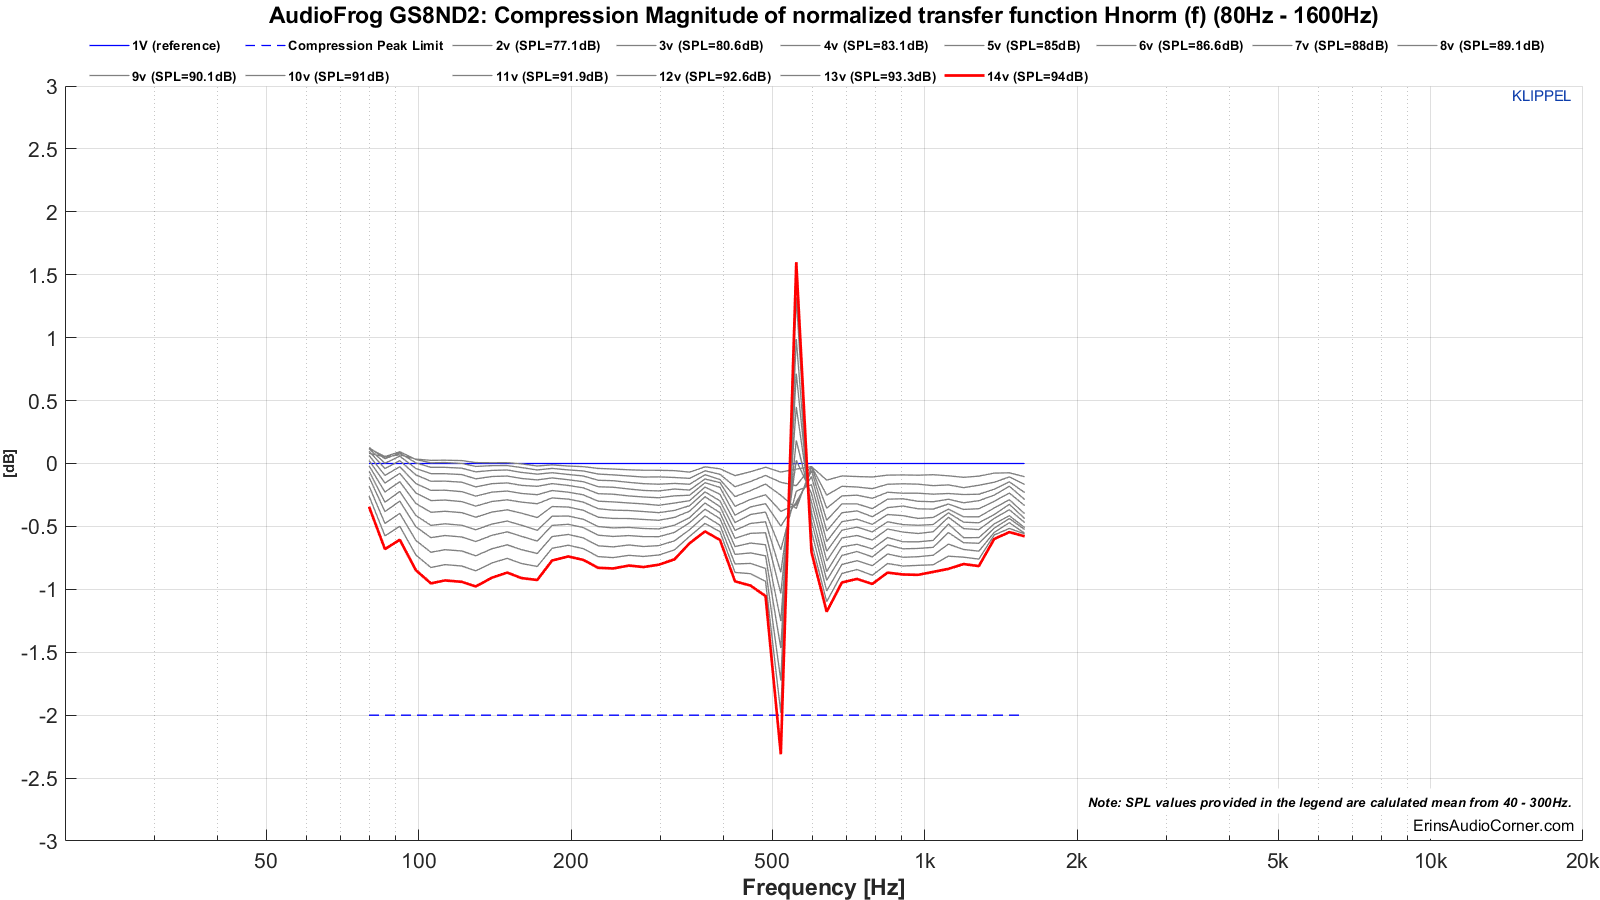
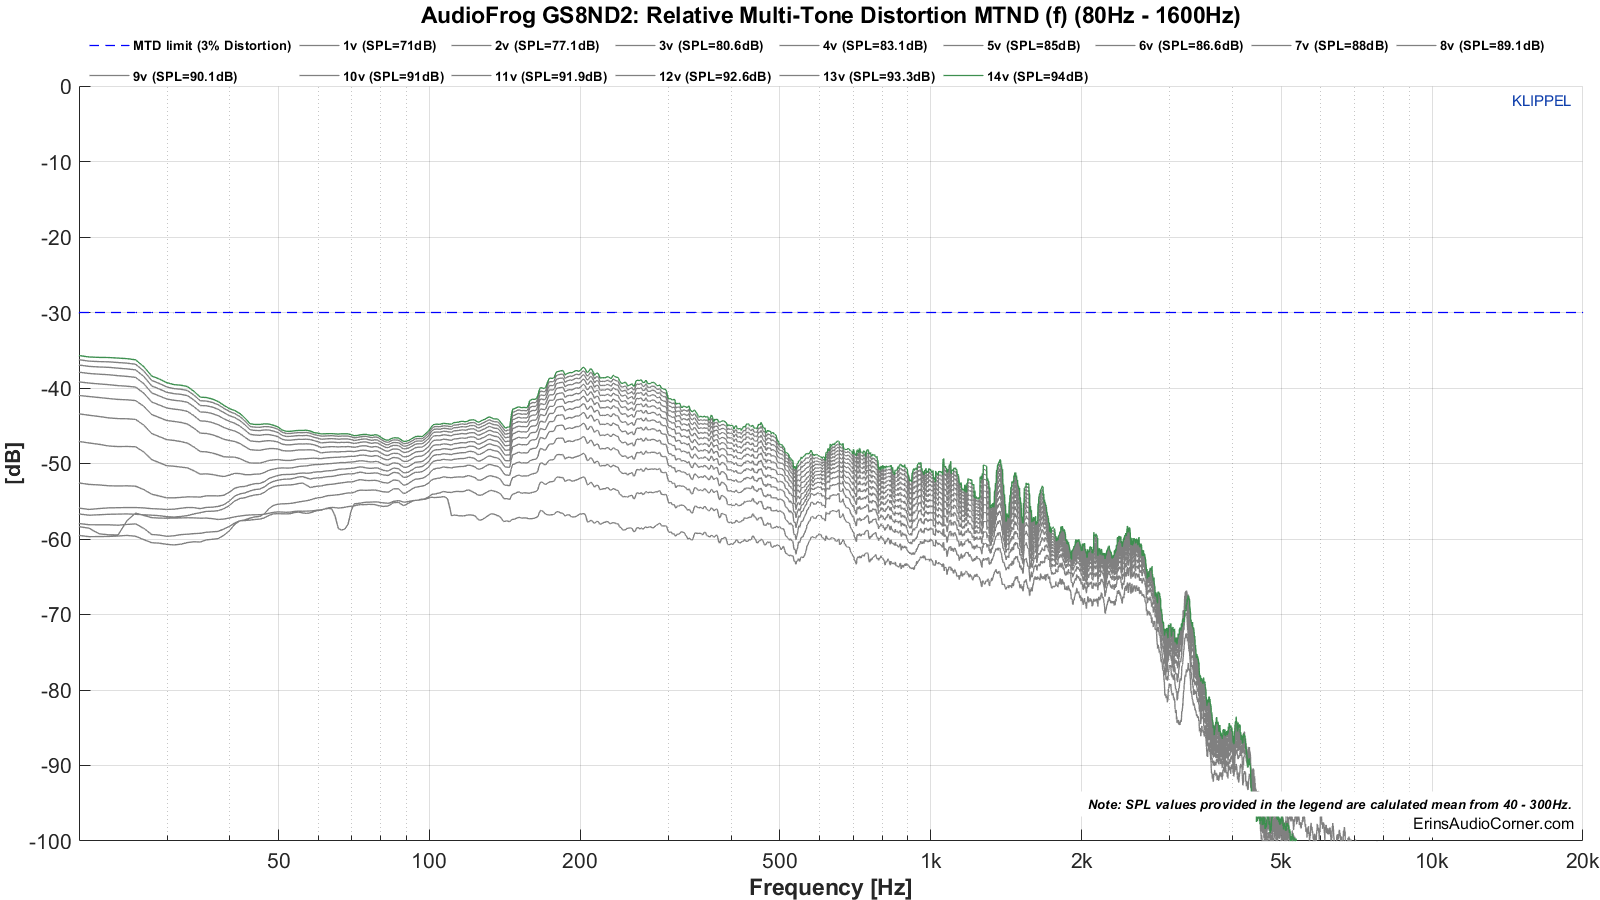
- “Typical” - 80Hz to 1600Hz
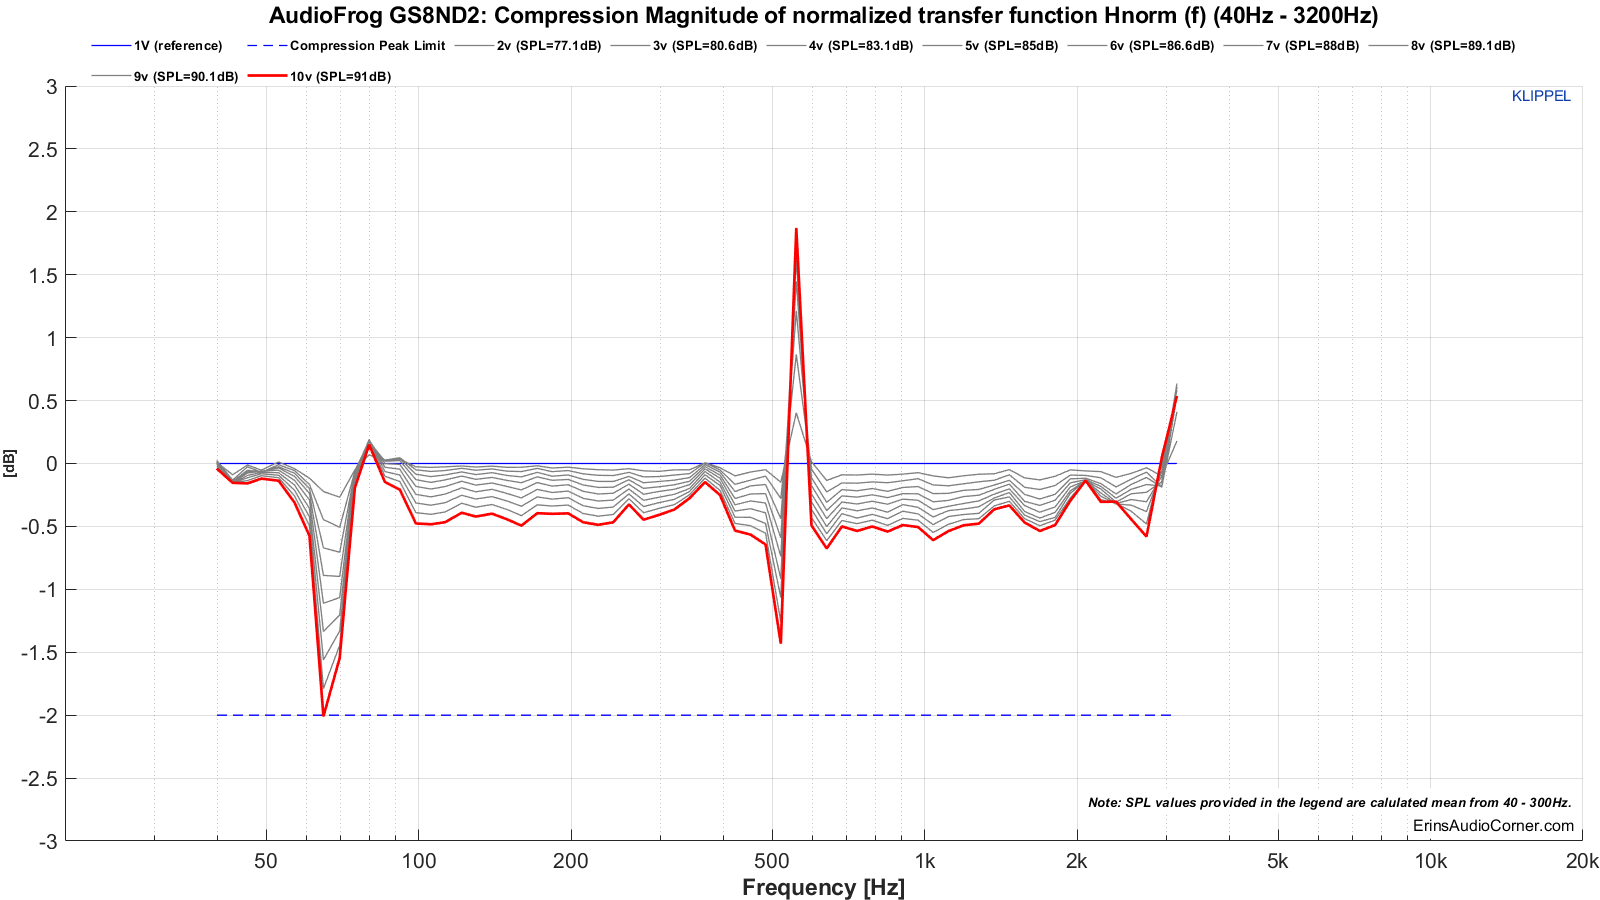
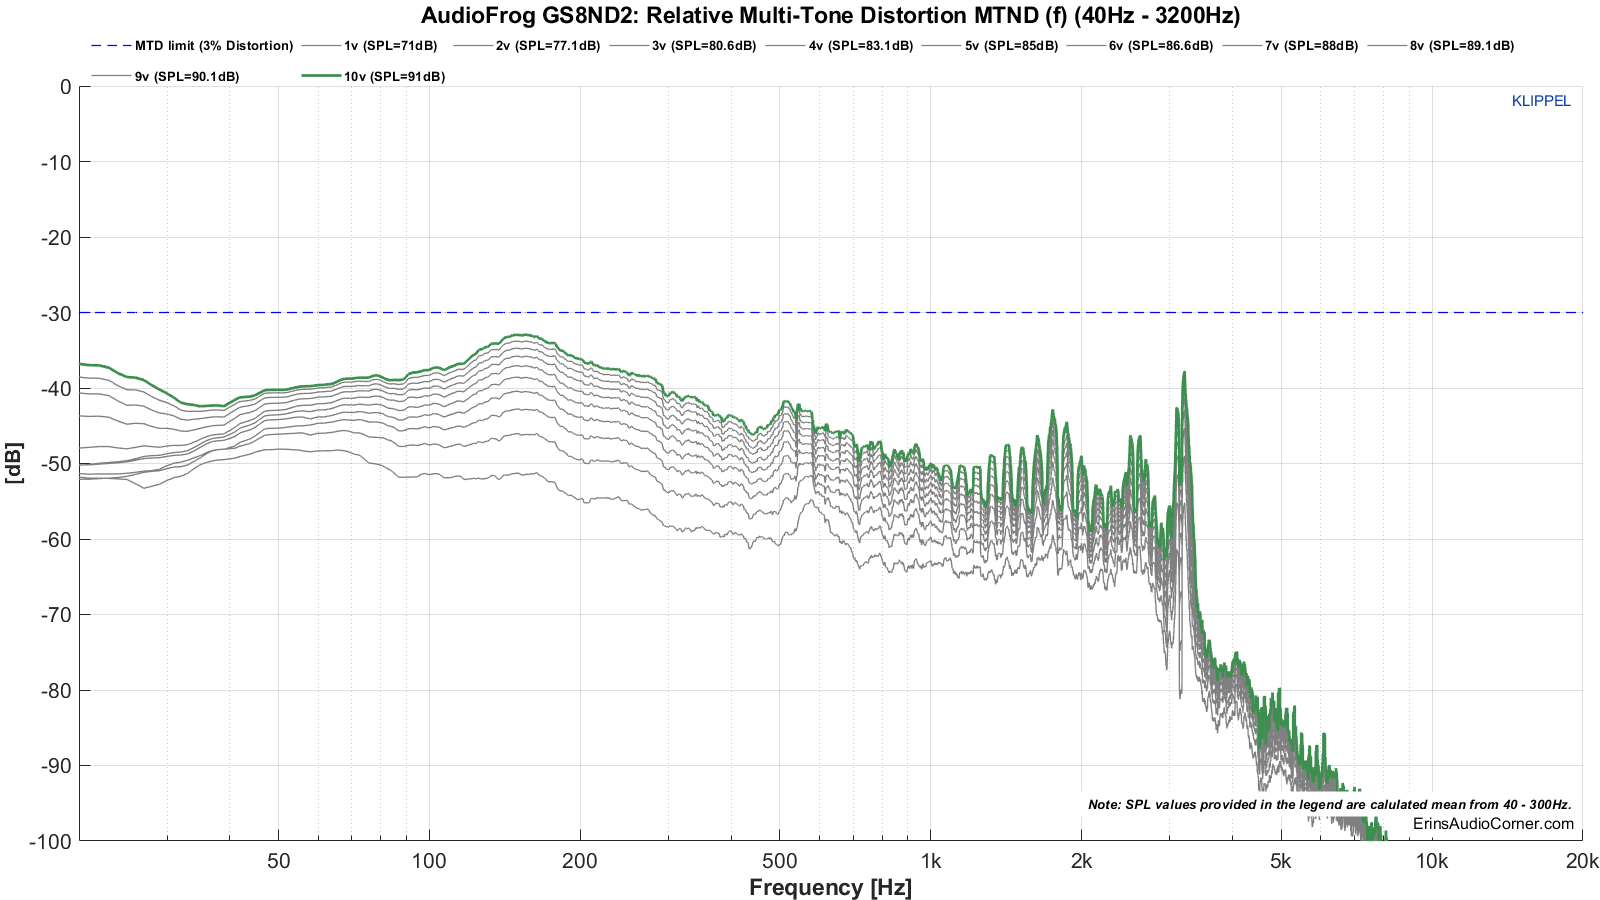
- “Extended” - 40Hz to 3200Hz
The purpose of me testing with two methods is to see how a driver performs in a more “typical” passband vs when it plays an “extended” passband. All similarly sized and similarly purposed speakers are tested in the same manner. For better or worse. This means a 6-inch midwoofer is tested the same way an 8-inch midwoofer is. Ultimately, this is for my sanity, because having numerous measurement methods for all sizes of speakers would muddy the waters quickly and wouldn’t give us an idea of when performance is great (say, a 6-inch midwoofer that has much less distortion than an 8-inch) or vice-versa.
You can watch a demonstration of this testing via my YouTube channel: https://youtu.be/iCjJufvW0IA
Test 1: Typical
Multitone compression results.
Multitone distortion results.
Test 2: Extended
Multitone compression results.
Multitone distortion results.
The maximum SPL referenced to 1 meter for each test are:
- Max SPL for Test 1 is 94dB. The compression threshold was exceeded above this SPL at about 500Hz.
- Max SPL for Test 2 is 91dB. The compression threshold was exceeded above this SPL at about 60Hz.
Does this mean the speaker will not play above this level? No. It simply means, within a set of limits, the above values are the maximum the speaker output is. Above that SPL, the limits are further and further exceeded.
Bottom Line
T/S Parameters and Linear Excursion:
- My measured linear excursion is limited to about 4.2mm one-way using the 10% distortion limits per the IEC standard.
- Increasing these limits to permit up to 20% THD results in linear excursion of 7.6mm.
- The coil is forward of the gap by approximately 3-4mm with nonlinear profile. Per Patrick Turnmire’s quote above “If the optimal shift xb(x) varies with the displacement amplitude x then the force factor asymmetry is caused by an asymmetrical geometry of the magnetic field and cannot completely be compensated by coil shifting”.
- Using the “Large + Cold” parameters for modeling in WinISD, I arrived at a sealed enclosure size of 0.45ft³ to reach a Qtc of 0.707 with an F3 of 46Hz. Please refer to the manufactur’s recommendation, provided at the beginning of this review, for enclosure type/size.
Frequency Response:
- Since this is designed as a woofer and not a midrange/woofer, the average sensitivity is calculated from 40Hz to 300Hz rather than my usual 300Hz - 1kHz. From 40-300Hz the average sensitivity is 80.1dB at 2.83v/1 meter at 4-ohm. At 1-ohm nominal the sensitivity is raised about 6dB to an average of 86.1dB at 2.83v/1 meter.
- On-axis response linearity is not reasonably within ±1.5dB thanks to the resonance at ~80Hz.
- On-axis response linearity is ±3.0dB from 32Hz to 300Hz.
- There is a 5dB drop in output from 100Hz to 300Hz.
- Upper frequency response is limited to 500Hz where a strong resonance occurs. But, again, this drive unit is not intended to be played above 300Hz per the manufacturer. This data simply points to agreeance with that and a cautionary tale should someone wonder if they can push the upper end limit above the 300Hz recommendation.
Distortion and Compression:
- At 90dB (average) the THD is greather than 3% below 80Hz.
- At 96dB (average) the THD is greather than 3% below 150Hz.
- The cone resonance shows up as a steep spike in 2nd order distortion at approximately 500Hz.
- Max SPL for Test 1 is 94dB. The compression threshold was exceeded above this SPL at about 500Hz. If the bandlimited range were limited to 300Hz there would have been more SPL capability. But, as a means of keeping my tests all apples-to-apples, this is how the speaker was tested. All other woofer tests are conducted in the same manner.
- Max SPL for Test 2 is 91dB. The compression threshold was exceeded above this SPL at about 60Hz.
This speaker was designed for a small enclosure application and to fit some very specific installs such as the afore-quoted Porsche per Andy, as well as certain BMW models which feature under-seat midbass locations. If you are a customer who has these needs then the GS8ND2 is an option for you. However, if you are a person simply looking for an 8-inch midbass to fill in between their subwoofer and midrange then I cannot recommend the GS8ND2. While the linear excursion is par for the course with 8-inch drivers I have tested so far, this drive unit’s very low sensitivity, variable frequency response in even a limited bandpass region of 40-300Hz, and high low-frequency distortion (thanks to the low sensitivity) are all enough reason to keep from recommending it to the general consumer looking for an 8-inch midbass. The Dyn MW182 or Dyn MW172 I tested here are better options for that task. Their higher sensitivity enables more output in the typical midbass region of 80-300Hz with lower distortion and better linearity in frequency response.
Contribute
If you like what you see here and want to help me keep it going, please consider donating via the PayPal Contribute button located below. The cost to host images on the server exceeded $100 last month and are likely to only continue going up as I post more and more reviews. Therefore, any amount you can chip in to the cause would go a long way toward me keeping the grease on the cogs. Thanks.
You can also join my Facebook and YouTube pages if you’d like to follow along with updates.